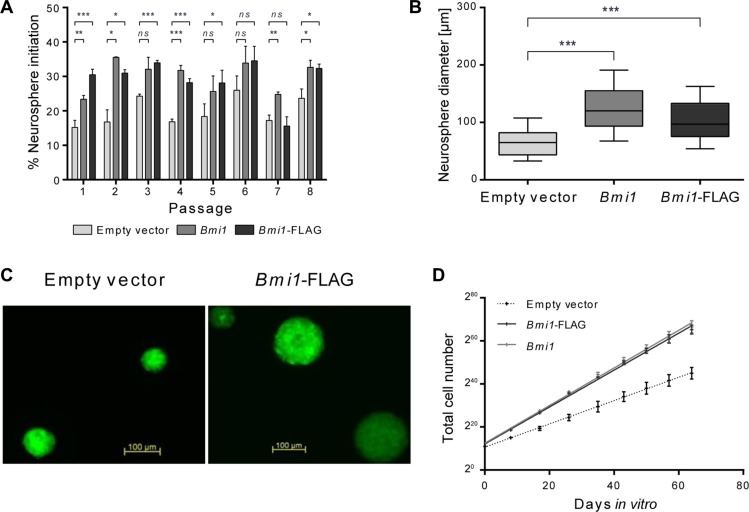
Figure 1. Bmi1 overexpression increases proliferation and self-renewal of postnatal NSP cells in vitro.
(A) Frequency of neurosphere initiation of empty vector, pCMMP-Bmi1 and pCMMP-Bmi1-FLAG transduced cells assessed 7 days post plating for 8 passages (n = 3). Error bars represent standard deviations. (B) Box plots representing neurosphere diameters determined for empty vector, pCMMP-Bmi1 and pCMMP-Bmi1-FLAG transduced NSP cells at passage 2 (50 spheres were investigated in 3 independent cultures). Whiskers represent the 10–90th percentiles. Results of unpaired t-tests in (A) and (B) are marked as follows: *p ≤ 0.05, **p ≤ 0.01, ***p ≤ 0.001, ns: not significant (p > 0.05). (C) Fluorescent micrographs of empty vector and Bmi1-FLAG transduced neurospheres. (D) Total cell numbers measured at 7–9 days post plating over 8 passages (n = 3). Mean values with standard deviation and linear regression lines are shown. Linear regression analysis showed a significant difference between empty vector and pCMMP-Bmi1 and pCMMP-Bmi1-FLAG transduced NSP cultures (ANCOVA, p < 0.0001).

