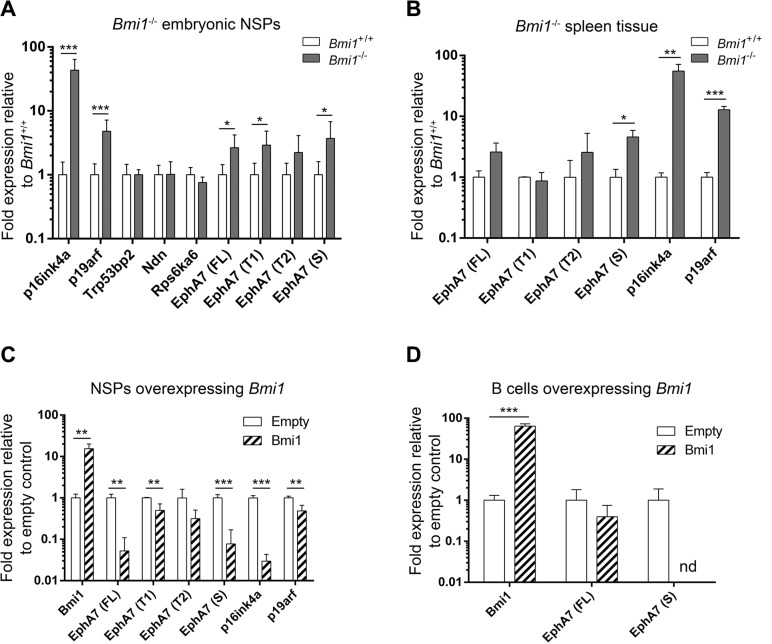
Figure 3. Derepression of EphA7 isoforms in Bmi1−/− cells and downregulation in Bmi1-overexpressing cells.
Gene expression levels determined by qPCR analyses are shown. p16ink4a and p19arf served as positive controls. (A) Upregulation of candidate BMI-1 target genes in embryonic day E14.5 neurosphere (NSP) cells isolated from Bmi1−/− animals in comparison to cells isolated from Bmi1+/+ animals (n = 8). Note the increased transcript levels of the full length (FL), truncated (T1) and secreted (S) EphA7 isoforms (B) Upregulation of EphA7 secreted isoform in postnatal spleen tissue from adult Bmi1−/− animals in comparison to tissue from Bmi1+/+ mice (n = 3). Downregulation of EphA7 isoform transcripts in postnatal neurosphere cells (C) and in postnatal spleen B cells (D) in Bmi1-overexpressing cells in comparison to empty vector control cells (n = 3). Note that upon Bmi1 overexpression in spleen B cells, transcripts of the secreted EphA7 isoform were not detectable (nd) anymore. Significant results of unpaired t-tests are marked as follows: *p ≤ 0.05, **p ≤ 0.01, ***p ≤ 0.001. Mean values with standard deviation are shown.

