
Figure 3. ω-3 PUFAs induce phosphorylation and cytoplasmic translocation of YAP in CRC cells.
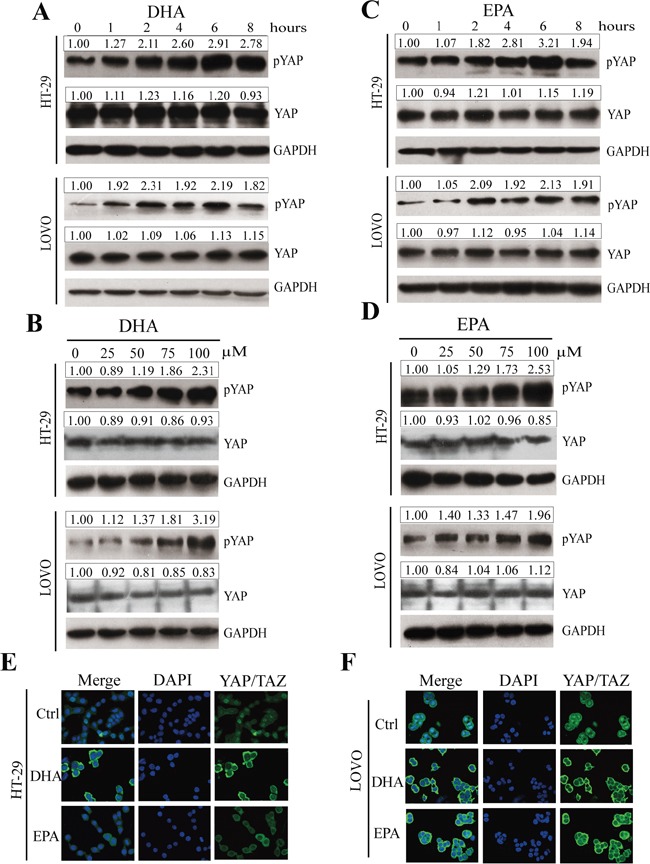
A-D. pYAP and YAP signals were examined and quantified by western blot after HT-29 and LOVO cells were treated with 75 μM DHA (A and B) or EPA (C and D) for indicated times (A and C) or different concentrations at 4h (B and D). GAPDH served as the loading control. Bands were semiquantified by image intensity area under the curve. Intensity of specific band is normalized in relation to loading control protein intensity. E and F. HT-29 (E) and LOVO (F) cells were treated with 75 μM DHA or EPA for 6 h. Expression and translocation of YAP/TAZ were determined by confocal microscopy; DAPI stained nuclei blue.