
Figure 2. EF2 expression in LSCC tissues and peri-cacinoma lung tissues by western blot and IHC analysis.
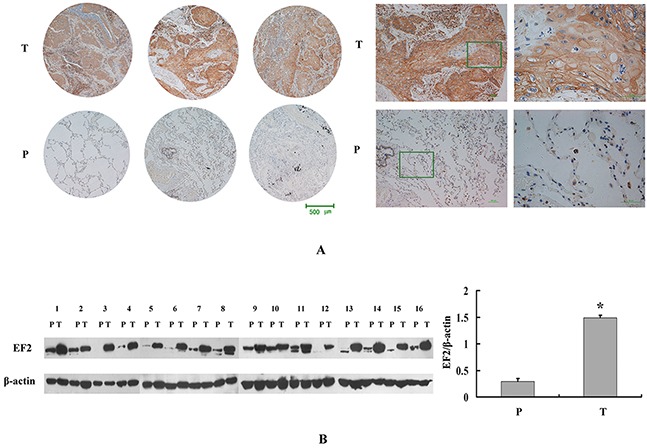
A. Representative IHC images of the EF2 protein expression in LSCC specimens and matched peri-cacinoma lung tissues of tissue microarray. P and T stand for peri-cacinoma lung tissues and LSCC tissues respectively. B. Western blot analysis for EF2 in 16 pairs of LSCC tissues and peri-cacinoma lung tissues. The protein level of EF2 in LSCC tissues was 4.8-fold higher than that in the peri-cacinoma lung tissues (* p < 0.05).