

Abstract
The Psychological Inventory of Criminal Thinking Styles (PICTS) is one of the most widely used measures of criminal thinking. Although the PICTS has adequate psychometric qualities with many general population inmates, the measurement confound of reading ability may decrease its construct validity in low-literacy inmates. To help resolve this confound, we present psychometric evaluation of a simplified version of the PICTS (PICTS-SV) in which item language was simplified but item content was preserved. We first conducted Lexile analyses to confirm the reading level of the PICTS-SV is significantly lower than the original PICTS (i.e., sixth grade versus ninth grade). We then tested a bifactor model to confirm the PICTS-SV contains the same two factors as the original PICTS: proactive and reactive criminal thinking. These PICTS-SV results are commensurate with the factor structure of the original PICTS. Results suggest the PICTS-SV is a valid alternative for assessing criminal thinking in inmates with low reading ability.
Keywords: PICTS, criminal thinking, literacy levels, clinical assessment
Psychological measures are not universally validated, but rather are validated for specific populations and purposes (Cizek 2012). The interpretation of scale scores may be highly valid for one population or purpose and highly invalid for another (AERA et al. 2014). For example, an assessment of adult verbal abilities such as the Wechsler Adult Intelligence Scale (WAIS) vocabulary subscale would be highly invalid for an individual who does not speak English. Similarly, the WAIS vocabulary subscale would have questionable validity if used to select players in the National Football League draft. Although not always as obvious, self-reported personality scales follow the same conceptualization of validity.
One such assessment is the Psychological Inventory of Criminal Thinking Styles (PICTS; Walters 1995), a self-report measure designed to measure criminal thinking styles and identify individuals at risk for recidivism. The PICTS has demonstrated predictive validity among inmates for future crimes (Walters 2002; Walters 2012) and has been the subject of much research (e.g., Walters 1997; Walters 2012, 2014). However, measurement confounds may affect PICTS scale scores when used with low-literacy inmate populations. Of note, whereas the PICTS effectively predicts recidivism among inmates with 12 or more years of education, evidence indicates this is not the case among inmates with fewer than 12 years of education (Walters 2014b). In the current study we discuss the potential confound of reading ability and present a psychometric evaluation of a simplified version of the PICTS. Our goal is to increase measurement validity of the PICTS among inmates with low reading abilities and thereby more accurately assess the construct of criminal thinking in this population (Borsboom et al. 2004).
Reading Ability
Inmates in the United States typically have low literacy levels. Broadly defined, literacy includes reading, writing, and quantitative abilities, which are highly correlated with one another (Greenberg et al. 2007). The 2003 National Assessment of Adult Literacy (Greenberg et al. 2007), a large scale assessment of the English literacy among incarcerated adults, found the majority of inmates fell in the two lowest literacy levels: “basic” and “below basic.” Basic literacy is defined as possessing the skills needed to perform simple and everyday literacy activities (e.g., find information in a newspaper article explaining the benefits of a community organization); below basic literacy is defined as possessing no more than the most simple and concrete literacy skills (e.g., ability to follow written instructions in preparation for a medical test). Operationalizing literacy in two ways, Greenberg et al. (2007) found that 50% to 56% of the prison population had either basic or below basic literacy. Three percent of the prison population was considered non-literate in English.
In the current study we focus solely on the reading component of literacy. Studies of adult inmates in the United States have shown that only 50% read at or above a sixth-grade reading level and only 25% read at or above a twelfth-grade reading level (Ryan 1991). In a large Canadian sample, 19% of inmates read at only a fifth-grade level or lower, 49% at a sixth- to eighth-grade reading level, 22% at a ninth- to twelfth-grade reading level, and 10% at collegiate level (Muirhead and Rhodes 1998). Although not as representative, more recent investigations show similar inmate reading levels (Shippen et al. 2010). With such low reading levels, it is imperative that self-report scales used with inmates contain items at or below their reading level.
Given the importance of an assessment's language matching the reading level of the target population (Clark and Watson 1995), a small but growing number of medical researchers have modified assessments with specific consideration of participant reading level (e.g., Kalichman et al. 2005; Williams et al. 1998; Wolf et al. 2005; Wolf et al. 2005). When modifying assessments for low reading level populations, Wolf, Bennett and colleagues (2005) suggest using Lexile analysis to ensure items achieve an eighth-grade reading level or lower and paying careful attention to item valence (i.e., avoid mixing negatively and positively worded items). Because low reading ability can affect the interpretation of test items, decreasing required reading level may be an effective way to bolster construct validity (e.g., Benet-Martinez and John 1998; White et al. 1998). In the current study, we present Lexile and psychometric analyses of a simplified version of the PICTS, referred to as the PICTS-SV, with attention paid to these considerations.
Criminal Thinking
Andrews and Bonta (2010) have identified criminal thinking as one of the “big four” criminogenic needs and one of the most robust predictors of recidivism. As a result there have been increasing efforts in recent years to measure and alter criminal thinking among inmates. The earliest conceptualization of criminal thinking comes from Sykes and Matza (1957) who studied the thought patterns of juvenile delinquents and theorized that offenders use criminal thinking to reduce the cognitive dissonance produced when they act contrary to their moral standards. Walters (2012) defines criminal thinking as the “attitudes, beliefs, and rationalizations that offenders use to justify and support their criminal behavior” (p. 272). Criminal thoughts contain cognitive distortions theorized to propagate future criminal acts.
The Psychological Inventory of Criminal Thinking Styles
The Psychological Inventory of Criminal Thinking Styles (PICTS) is the most widely used measure of criminal thinking and is positively related to inmates' criminal history (Walters 1995a; Walters et al. 1998), prison-based therapy dropout (Walters 2004), institutional infractions while incarcerated (Walters 1996; Walters and Elliot 1999), and recidivism post-release (Gonsalves et al. 2009; Walters 1997; Walters 2009; Walters 2012; Walters and Elliot 1999). The PICTS has been shown to effectively predict recidivism among male and female, federal and state prison, American and English inmates (Walters 2009; Walters and Elliot 1999; Palmer and Hollin 2004a), as well as sexual offenders (Walters et al. 2015). The adequate internal consistency, proactive-reactive criminal thinking factor structure, and predictive validity of recidivism in general inmate populations were replicated with a sexual offending inmate sample (Walters et al. 2009; Walters et al. 2015).
While initial theory suggested an eight-factor structure of the PICTS, follow up research has instead supported a two-factor structure. Three preliminary studies tested eight a priori criminal thinking style subscales and two validity scales developed, in part, from Yochelson and Samenow's (1976) model of criminal thinking errors (Walters 1995a; Walters 1995b; Walters 1996). Subsequent psychometric evaluation with confirmatory factor analysis and item response theory failed to support this factor structure, however, leading instead to two broad criminal thinking styles (i.e., proactive and reactive; Egan et al. 2000; Walters et al. 2011; Walters 2005, 2006, 2014) and revised validity scales (Walters 2001). The proactive and reactive thinking distinction stems from literature on childhood aggression describing two related dimensions (e.g., Dodge and Coie 1987; Poulin and Boivin, 2000). Proactive aggression is purposeful and calculated harm to others expected to bring positive outcomes (e.g., “in cold blood”), while reactive aggression is impulsive-driven harm due to strong negative emotions such as anger and hostile attribution biases (e.g., “in the heat of the moment”; Walters 2007). Proactive and reactive criminal thinking can be conceptualized as the cognitive styles underlying these two types of aggressive, antisocial behavior.
Proactive and reactive criminal thinking are characterized by different cognitive distortions and associated with different behavioral outcomes. Offenders high on proactive criminal thinking are theorized to commit planned crimes, potentially against strangers (Walters 2007). Proactive criminal thinking is associated with robbery and burglary offenses as well as self-assertive and deceptive tendencies. An example proactive criminal thought is “I will steal a car later this evening to solidify my place in the gang.” Offenders high on reactive criminal thinking are theorized to commit more spontaneous crimes against acquaintances after being provoked. Reactive criminal thinking is associated with assault and domestic violence offenses, problem avoidance and poor emotion regulation, symptoms to anxiety and depression, and disciplinary infractions during incarceration (Walters 2006; Walters et al. 2007; Walters and Geyer 2005). An example of reactive criminal thinking is “This man does not respect me; he deserves to be punched in the face.” Although both types of criminal thinking appear related to psychopathy, proactive thinking is more closely related to Factor 1 of the Psychopathy Checklist - Revised (i.e., selfish, callous and remorseless use of others) (Gonsalves et al. 2009; Walters 2002). Importantly, proactive and reactive criminal thinking are not mutually exclusive or independent. Rather, they are two correlated dimensions that may motivate the same antisocial behavior (Walter 2005b).
Current Study
The goal of the current study was to expand the validity and utility of the PICTS among inmates with limited reading skills using a simplified version of the PICTS (i.e., the PICTS-SV). Lexile analysis was used to determine reading levels of the original PICTS and the PICTS-SV, in which items were altered to lower the reading level. We then conduct psychometric analyses to determine whether the factor structure of the PICTS-SV is comparable to that of the original PICTS. If the reading level is lower than that of the original PICTS and the PICTS-SV factor structure is similar to that of the original PICTS, this new simplified version may be useful for assessing criminal thinking among low-literacy inmate populations.
Method
Data Collection
The current study involves secondary data analysis, utilizing a sample of 492 male inmates at a medium-security Midwestern state prison, convicted of sexual crimes and living in a residential sex offender treatment program. The PICTS-SV was provided to each inmate as a part of a larger assessment packet they received upon intake to the residential sex offender treatment program between May 2009 and July 2010. Admission was limited to offenders who were psychiatrically stable and able to benefit from a therapeutic community. Demographic information specific to the sample was not available, and as we used an archival dataset we were unable to collect sample specific information. Demographics for male sexual offenders in the state's prison system from an annual 2009 report of the state's offender population confirmed the following. Within the male sex offender population of the states' prison system, the median age was 32 years (interquartile range = 27 - 42). The majority of male offenders were White (70.7%), with the remaining identifying as Black (26.6%), Hispanic (2.3%), and other (0.4%). Most male offenders (66.8%) had earned their high school diploma, GED, or higher (e.g., college degree), with the remaining having dropped out during high school (8.1%), middle school (7.1%), or elementary school (16.2%)1. The most commonly committed sexual offenses in the state were crimes in which the victim was under the age of 14 (43.8%), including Statutory Sodomy-1st degree (21.4%), Child Molestation-1st degree (9.5%), Statutory Rape-1st degree (10.2%), and Endangering the Welfare of a Child-1st degree (2.7%). Other crimes included Rape (13.4%), crimes in which the victim was ages 14 to 17 (12.7%), Sodomy (6.9%), and Sexual Assault (3.9%).
Measures
The Psychological Inventory of Criminal Styles – Simplified Version (PICTS-SV) was adapted from the original PICTS (Version 4.0) by the senior authors (Barboza and Wilson) after permission to modify the original PICTS was provided by Dr. Walters, the developer of the original PICTS. In clinical practice with state inmates, the authors had observed inmates repeatedly had difficulty reading and understanding PICTS items. Due to frequent literacy challenges among state inmate populations, a version of the PICTS with simplified language appeared necessary. Two clinical psychologists reworded 67 of the 80 items (84%) to lower the scale's reading level by using shorter synonyms and simplifying sentences while attempting to preserve the original intent and meaning of the item. For example, the 16th item from the original PICTS was reworded from “I am uncritical of my thoughts and ideas to the point that I ignore the problems and difficulties associated with these plans until it is too late” to “I don't stop and think about the problems I could cause until it is too late.”
The PICTS-SV includes 80 self-report items, to which participants respond on an asymmetrical 4-point Likert scale (1 = disagree; 2 = uncertain; 3 = agree; 4 = strongly agree) without a specified time interval. Excluding the validity scales and 8 items loading on the original Sentimentality subscale, 56 PICTS-SV items measure criminal thinking. Identical to the original PICTS, proactive and reactive criminal thinking composite scores for the PICTS-SV are calculated by summing items from their respective a priori criminal thinking subscales (Walters et al. 2011). Proactive criminal thinking contains 32 items from the Mollification (i.e., tendency to externalize blame for offending and offers rationalizations and excuses for committing crimes), Entitlement (i.e., attitude of privilege or ownership and misidentifies wants as needs), Power Orientation (i.e., need to exert control or authority over others), and Superoptimism (i.e., belief that the negative consequences of crime can be avoided) a priori subscales (Walters 1996). A sample item is “I thought the victims of my crimes deserved what they got or should have known better.” Reactive criminal thinking contains 24 items from the Cutoff (i.e., low distress tolerance and a tendency to remove deterrents of committing crime), Cognitive indolence (i.e., poor critical thinking skills and an over-reliance on short cuts for dealing with problems), and Discontinuity (i.e., inconsistency between intentions or cognitions and behavior) a priori subscales. A sample item is “I tend to act without thinking when I'm under stress.” The Sentimentality subscale is no longer included in any composite score because it failed to load onto a general criminal thinking factor in two large-scales studies (Walters 2014a; Walters et al. 2011). A general criminal thinking score can also be calculated by summing the two subscales, totaling 56 items.
Inter-scale correlations and coefficient alphas for the PICTS-SV in the current sample and the original PICTS in the Walters et al. (2015) sexual offender sample suggest the two versions have similar psychometric properties (see Table 1). The correlations between general criminal thinking and its associated subscales are identical in both PICTS versions. In the current study, the proactive and reactive subscales of the PICTS-SV are correlated .68 and in the Walters et al. (2015) sample the same original PICTS subscales correlated .70. The difference between the correlations was non-significant (Zou 2007). The very similar inter-scale correlations offer preliminary evidence for commensurate factor structures across PICTS versions. The coefficient alphas for each composite score were also very similar across versions of the PICTS indicating high reliability for both. Differences in means are not presented due to potential sample dependencies.
Table 1. Descriptive statistics of the PICTS-SV in the current sample and original PICTS correlations and coefficient alphas in the Walters et al. (2015) sample.
| Scale | General | Proactive | Reactive |
|---|---|---|---|
| General criminal thinking | - | .91 | .93 |
| Proactive criminal thinking | .91 | - | .70 |
| Reactive criminal thinking | .93 | .68 | - |
|
| |||
| Current sample α | .92 | .86 | .89 |
| Walters et al. (2015) sample α | .94 | .89 | .92 |
|
| |||
| Mean (Current sample) | 96.2 | 50.1 | 46.1 |
| SD (Current sample) | 22.1 | 11.4 | 12.7 |
α = coefficient alpha; SD = standard deviation Current sample PICTS-SV correlations below the diagonal; Walters et al. (2015) sample original PICTS correlations above the diagonal.
Missing Data
Cases missing data on four or more items from the PICTS-SV were excluded from all analyses (n = 6), resulting in a sample size of 488. An additional 48 participants were missing data on fewer than four items. These missing data were handled through singular imputation using R statistical software with the “mice package” (van Buuren and Groothuis-Oudshoorn 2011). Individual ordinal logistic regression imputation was conducted for each PICTS-SV item using the other 79 items as predictors (Allison 2002).
Results
Reading Level
A Lexile analysis of the PICTS and the PICTS-SV was conducted using an online software program (Simpson, 2014). Content was analyzed according to five different grade level formulas: Flesch Kincaid Grade Level, Gunning Fog Score, SMOG Index, Coleman Liau, and ARI (see Table 2). The PICTS-SV contained fewer total words, words per sentence, and syllables per word than the original PICTS. On average, the PICTS-SV requires a sixth grade reading level, whereas the PICTS requires a ninth grade reading level (see Table 3).
Table 2. Lexile analysis of the PICTS-SV and PICTS.
| Reading Ability Index | PICTS-SV | PICTS |
|---|---|---|
| Number of sentences | 82 | 81 |
| Number of words | 1,288 | 1,501 |
| Number of complex words | 63 | 160 |
| Percent of complex words | 4.89 | 10.66 |
| Average words per sentence | 15.71 | 18.53 |
| Average syllables per word | 1.27 | 1.43 |
Note. Statistics include the measure's items and directions
Table 3. Grade equivalent readability indices of the PICTS-SV and PICTS.
| Reading Ability Index | PICTS-SV | PICTS |
|---|---|---|
| Flesch Kincaid Grade Levela | 5.5 | 8.5 |
| Gunning Fogb | 8.2 | 11.6 |
| SMOG Indexc | 5.3 | 8.2 |
| Coleman Liau Indexd | 6.7 | 9.5 |
| Automated Readability Indexe | 4.5 | 8.1 |
| Average | 6.04 | 9.18 |
The Flesch Kincaid Grade Level is based on the number of words per sentence and number of syllables per word.
The Gunning Fog Score is based on the number of words per sentence and the ratio of the number of complex words to the number of words.
The SMOG Index is based on the number of complex words per sentence.
The Coleman Liau Index is based on the number of characters per word and the ratio of sentences to words.
The ARI is based on the number of characters per word and the number of words per sentence.
Confirmatory Factor Analyses
Confirmatory factor analyses (CFA) were conducted to test whether the structure of the PICTS-SV conforms to the identified structure of the PICTS (Walters et al. 2011). All structural equation modeling was conducted using R statistical software with the “lavaan” package (Rosseel 2012). Because the variables (i.e., PICTS-SV items) included in the CFA were on an ordinal scale of measurement, we used polychoric correlations rather than Pearson product-moment correlations (Choi et al. 2010; Holgado–Tello et al. 2010). Any zero values in the 4×4 contingency tables used to calculate the polychoric correlations were changed to .001 (Savalei 2011; Y. Rosseel, personal communication, September 18, 2014). With Likert scale items, polychoric correlations violate fewer statistical assumptions, have greater statistical power, and generate better model fit than Pearson product-moment correlations. A robust version of the weighted least squares (WLS) estimator is most appropriate for fitting CFAs with ordinal items (Flora and Curran 2004; Muthen 1984). This estimation method is consistent with the analyses conducted by Walters et al. (2011) and Walters (2014).
Three CFAs were tested. The first was a one-factor model where all 56 items from both the proactive and reactive subscales loaded onto one general criminal thinking factor. The second was a correlated two-factor model where each of the 56 items loaded onto their respective subscales: proactive or reactive thinking. The third was a bifactor model where all items loaded onto two factors: a general criminal thinking factor and their respective subscale factors. The bifactor model is becoming a more popular CFA for multidimensional constructs over the hierarchical model because it can test the significance of variance specific to subscales above and beyond the global factor (Chen et al. 2012). The goodness of fit for these models was compared to determine whether the one- or two-factor model more accurately represented the relationships between the PICTS-SV items.
The Comparative Fit Index (CFI), Non-normed Fit Index (NNFI; also known as Tucker-Lewis Index), Root Mean Square Error of Approximation (RMSEA), and Weighted Room Mean Square Residual (WRMR) were used to assess model fit (Hu and Bentler 1999; Kenny 2014). The CFI and NNFI range from 0 to 1.0 with higher values indicating better model fit. Traditionally a CFI and NNFI of .95 or greater is evidence that the model sufficiently represents the observed. However, the CFI and NNFI overestimate specification error with a large number of items per factor, and in these cases a cut-off value of .90 is considered more appropriate (Kenny and McCoach 2003). The Root Mean Square Error of Approximation (RMSEA) ranges from 0 to 1.0 with lower values indicating better model fit. In general, a RMSEA of .08 or less is evidence the model sufficiently represents the observed data. The Weighted Root Mean Square Residual (WRMR) ranges from 0 to ∞ with lower values indicating better model fit (Yu 2002). Although there is less simulation research on the WRMR, preliminary evaluation suggests a value 1.0 or less is considered evidence the model represents the observed data. Lastly, the chi-square test statistic is presented, with lower values indicating better model fit. A scaled chi-square difference test (Δχ2) was used to directly compare models (Santorra and Bentler 2001).
One-factor Model
For the one-factor model only the RMSEA index reached acceptable cut-off standards (see Table 4). All item loadings were positive and statistically significant except for item 5 (“I can do anything if I try hard enough”). Past item response theory (IRT) analyses suggest the original PICTS item 5 (“There is nothing I can't do if I try hard enough”) is a poorly distinguishing item (Walters et al. 2011). The average factor loading was .53 and the standard deviation of all factor loadings was .14. Although not standardized, factor loadings estimated with polychoric correlations can be interpreted as the latent correlation between the item and factor.
Table 4. Measurement model fit indices.
| Model | χ2 | df | CFI | NNFI | RMSEA | WRMR |
|---|---|---|---|---|---|---|
| One-factor | 779.3 | 183.2 | .80 | .89 | .082 | 1.62 |
| Two-factor | 666.9 | 183.8 | .83 | .91 | .073 | 1.50 |
| Bifactor | 494.8 | 186.8 | .90 | .94 | .058 | 1.20 |
χ2= chi-square value; All chi-square values were significant at p<.001;
CFI = confirmatory fit index; NNFI = non-normed fit index; RMSEA = RootMean Square Error of Approximation; WRMR = Weighted Root Mean Square Residual
Two-factor Model
For the two-factor model the RSMEA and NNFI indices reached acceptable cut-off standards (see Table 4). All item loadings were positive and statistically significant with the exception of item 5, as above. The latent correlation between the proactive and reactive criminal thinking factors was .77. The average proactive criminal thinking factor loading was .52 and the standard deviation of all factor loadings was .14. The average reactive criminal thinking factor loading was .61 and the standard deviation of all factor loadings was .12. A scaled chi-square difference test showed that the one-factor and two-factor models equally fit the observed data (Δχ2(18.2) = 25.22; p = .124).
Bifactor Model
The bifactor model fit the observed data with all fit indices except the WRMR reaching acceptable cut-off standards (see Table 4). As a requirement for bifactor models, the latent correlations between the general criminal thinking, proactive criminal thinking, and reactive criminal thinking factors were constrained to zero. For the general criminal thinking factor, 55 out of the 56 item factor loadings were positive and statistically significant (excluding item 5). For the proactive criminal thinking factor, 12 of the 36 items were positive and statistically significant. Five negative loadings for the proactive criminal thinking factor were significant and likely caused by redundancy with the general criminal thinking factor. This suggests many proactive criminal thinking subscale items were adequately captured by the general criminal thinking factor. However, comparing the fit of a bifactor model with and without the proactive criminal thinking factor suggests the subscale factor explains significant item variance (Δχ2(21.1) = 161.18; p < .001). For the reactive criminal thinking factor, 20 out of the 24 items were positive and statistically significant with no significant negative loadings. To confirm the item variance explained by the reactive criminal thinking factor was significant, a scaled chi-square difference tests revealed significantly worse model fit without the factor (Δχ2(17.8) = 303.2; p < .001). Figure 1 shows the average factor loadings and their standard deviation for each factor. As shown in Figure 1, the general criminal thinking factor explained the most variance in item responses.
Figure 1. Bifactor model of the PICTS-SV.
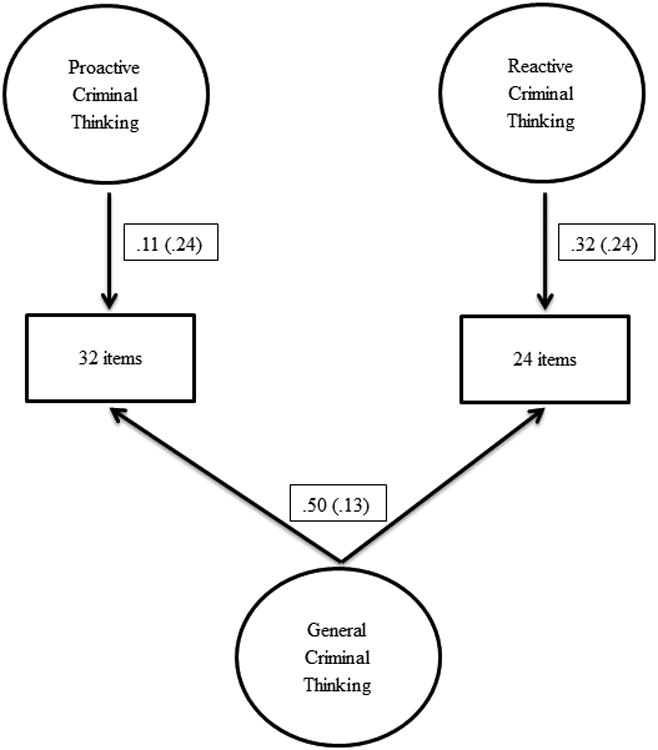
The average factor loading for each factor is presented with standard deviations for factor loading in parentheses
Scaled chi-square difference test showed that the bifactor model fit the observed data better than both the one-factor (Δχ2(22.2) = 84.7; p < .001) and two-factor (Δχ2(21.8) = 73.4; p < .001) models. The significant scaled chi-square difference test between the bifactor and one-factor models suggest that variance specific to the proactive and reactive criminal thinking subscales (i.e., independent of the general criminal thinking factor) explains significant variance in item responses. Comparing the magnitude of the factor loadings suggests the reactive criminal thinking factor explains more unique variance than the proactive factor; however, this may be a statistical artifact due to the greater number of proactive criminal thinking items loading onto the general factor. The significant scaled chi-square difference test between the bifactor and two-factor models suggest that variance specific to the general criminal thinking total scale (i.e., independent of the proactive and reactive criminal thinking factors) explains significant variance in item responses.
Discussion
The current study piloted a simplified version of the PICTS, a commonly used assessment of criminal thinking. Lexile analysis revealed the PICTS-SV requires a lower reading level than the original PICTS (i.e., sixth grade versus ninth grade). Although 66.8% of the offenders from which the current study sampled were high school graduates, grade level achievement does not necessitate reading ability level (Masner and Wootton 1993; Paasche-Orlow et al. 2005). In fact, one study found that 25% of adults with a high school diploma or GED read at or below an 8th grade read level (Masner and Wooton 1993). Relying upon the normative reading level of inmates as determined by Muirhead and Rhodes (1998), 82% of inmates could likely adequately read the PICTS-SV compared with only 32% for the original PICTS. Because the modal inmate reading level interval is between sixth-grade and eighth-grade, the percentage of inmates able to understand all PICTS-SV items may be much larger than the percentage of inmates able to understand the original PICTS items. Although lower literacy inmates are likely able to decipher the meaning of some original PICTS items, they may be guessing on others.
Psychometric analyses confirmed a bifactor structure of the PICTS-SV; this is commensurate with prior psychometric evaluations of the PICTS (Walters 2014a; Walters et al. 2011) showing a general criminal thinking factor with meaningful uniqueness by the proactive and reactive subscales. Given the lower reading level and reliability of the PICTS-SV, the PICTS-SV may extend the reach of the original PICTS to low-literacy adult and adolescent populations.
General, proactive, and reactive criminal thinking
The significant factor loadings for each factor suggest the total score (i.e., general criminal thinking) and/or subscale scores (i.e., proactive and reactive criminal thinking) may be used. In clinical practice, proactive and reactive criminal thinking scores may be used to match inmates to interventions. Walters (2006) suggested inmates high on proactive criminal thinking may respond best to more confrontational interventions, while inmates high on reactive thinking may respond best to a stress and anger management intervention (Folk et al. in preparation). In research, inquiry into the causes of criminal thinking may be better understood through examination of the two subscales; proactive criminal thinking is theorized to result from callous-unemotional traits and social learning (Fanti et al. 2009; Walters 2007), while reactive criminal thinking in adults is often a consequence of hostile attribution biases and impulsivity (Miller and Lynam 2006; Murray-Close et al. 2010). Although proactive and reactive thinking have the same meta-analytic correlation with general recidivism (r = .17; Walters 2012), these two types of thinking differentially predict specific types of criminal activity; proactive criminal thinking is associated with burglary and reactive criminal thinking is associated with domestic assault (Walters et al. 2007). When assessing inmates with low-reading levels, clinicians and researchers can use the PICTS-SV to replicate and advance these findings.
Limitations and Future Directions
The limitations of the current study invite several directions for future research. The first pertains to generalizability. The current study included a sample of all male sex offenders and therefore may not generalize to female and general population offenders. Male sex offenders may differ on characteristics which affect the measurement of criminal thinking (e.g., men who commit sex offenses tend to score lower on IQ tests than men who commit nonsexual offenses; Cantor et al. 2005). Future research should examine the replicability of the PICTS-SV factor structure with other samples of offenders, including female and general inmates, as well as non-correctional populations. Previous research with the PICTS has demonstrated that factor analyses of the PICTS are replicable in both sex and non-sex offenders (e.g., Walters et al. 2015). Additional studies may also investigate the utility of the PICTS-SV in juvenile populations as the original PICTS did not perform as well with 18-22 year old English inmates (Palmer and Hollin 2004b). Given that the PICTS-SV only requires a sixth grade reading level, it may prove useful in studies of adolescent criminal thinking and juvenile offenders.
Second, future investigations may consider administering both the PICTS and the PICTS-SV to the same sample to assess convergence directly and compare predictive validity. Given the predictive utility of the PICTS as it relates to recidivism (Walters 1997; Walters 2009; Walters 2012; Walters and Elliot 1999), it would be useful for future investigations to examine whether the PICTS-SV has the same utility. One could also evaluate the added utility of using the lower reading level assessment by examining the degree to which reading level moderates the predictive validity of the PICTS and the PICTS-SV. It is possible that for samples with lower reading abilities, the PICTS-SV may be a more valid assessment of criminal thinking and as such, a stronger predictor of recidivism.
Implications and Conclusions
Results of the current study suggest the PICTS-SV is a reliable alternative to the original PICTS for assessing criminal thinking in low literacy populations. This may be a valuable tool not only for research and program evaluation, but also for identifying individuals for whom participation in interventions targeting criminal thinking is most appropriate. Given the low reading ability of many individuals involved in the criminal justice system, use of the PICTS-SV is likely a valid alternative to the original PICTS.
Acknowledgments
The authors are grateful to Dr. Walters for providing permission to modify the original PICTS and for his initial review of this paper.
Footnotes
Educational attainment was unavailable for 1.8% of male sexual offenders.
References
- Allison PD. Missing data (Quantitative applications in the social sciences) Thousand Oaks, CA: Sage; 2002. [Google Scholar]
- American Educational Research Association, American Psychological Association, & National Council on Measurement in Education. Standards for educational and psychological testing 2014 [Google Scholar]
- Andrews JR, Bonta J. The psychology of criminal conduct. 5th. New Providence, NJ: Matthew Bender & Company, Inc; 2010. [Google Scholar]
- Benet-Martinez V, John OP. Los Cinco Grandes across cultures and ethnic groups: Multitrait-multimethod analyses of the Big Five in Spanish and English. Journal of Personality and Social Psychology. 1998;75(3):729–750. doi: 10.1037//0022-3514.75.3.729. [DOI] [PubMed] [Google Scholar]
- Borsboom D, Mellenbergh GJ, van Heerden J. The concept of validity. Psychological Review. 2004;111(4):1061–1071. doi: 10.1037/0033-295X.111.4.1061. [DOI] [PubMed] [Google Scholar]
- Cantor JM, Blanchard R, Robichaud LK, Christensen BK. Quantitative reanalysis of aggregate data on IQ in sexual offenders. Psychological Bulletin. 2005;131(4):555–568. doi: 10.1037/0033-2909.131.4.555. [DOI] [PubMed] [Google Scholar]
- Chen FF, Hayes A, Carver CS, Laurenceau JP, Zhang Z. Modeling general and specific variance in multifaced constructs: A comparison of the bifactor model to other approaches. Journal of Personality. 2012;80(1):219–251. doi: 10.1111/j.1467-6494.2011.00739.x. [DOI] [PubMed] [Google Scholar]
- Choi J, Peters M, Mueller RO. Correlational analysis of ordinal data: from Pearson's r to Bayesian polychoric correlation. Asia Pacific Education Review. 2010;11(4):459–466. [Google Scholar]
- Cizek GJ. Defining and distinguishing validity: Interpretations of scores meaning and justification of test use. Psychological Methods. 2012;17(1):31–43. doi: 10.1037/a0026975. [DOI] [PubMed] [Google Scholar]
- Clark LA, Watson D. Constructing validity: Basic issues in objective scale development. Psychological Assessment. 1995;7(3):309–319. doi: 10.1037/pas0000626. [DOI] [PMC free article] [PubMed] [Google Scholar]
- Dodge KA, Coie JD. Social-information processing factors in reactive and proactive aggression in children's peer groups. Journal of Personality and Social Psychology. 1987;53(6):1146–1158. doi: 10.1037//0022-3514.53.6.1146. [DOI] [PubMed] [Google Scholar]
- Egan V, McMurran M, Richardson C, Blair M. Criminal cognitions and personality: What does the PICTS really measure? Criminal Behaviour and Mental Health. 2000;10(3):170–184. [Google Scholar]
- Fanti KA, Frick PJ, Georgiou S. Linking callous-unemotional traits to instrumental and non-instrumental forms of aggression. Journal of Psychopathology and Behavioral Assessment. 2009;31(4):285–298. [Google Scholar]
- Flora DB, Curran PJ. An empirical evaluation of alternative methods of estimation for confirmatory factor analysis with ordinal data. Psychological Methods. 2004;9(4):466–491. doi: 10.1037/1082-989X.9.4.466. [DOI] [PMC free article] [PubMed] [Google Scholar]
- Gonsalves VM, Scalora MJ, Huss MT. Prediction of recidivism using the Psychopathy Checklist—Revised and the Psychological Inventory of Criminal Thinking Styles within a forensic sample. Criminal Justice and Behavior. 2009;36(7):741–756. [Google Scholar]
- Greenberg E, Dunleavy E, Kutner M, White S. Literacy behind bars: Results from the 2003 National Assessment of Adult Literacy Prison Survey. Washington, DC: National Center for Education Statistics; 2007. [Google Scholar]
- Hambleton RK. Guidelines for Adapting Educational and Psychological Tests. Washington, DC: National Center for Education Statistics; 1996. [Google Scholar]
- Holgado–Tello FP, Chacón–Moscoso S, Barbero–García I, Vila–Abad E. Polychoric versus Pearson correlations in exploratory and confirmatory factor analysis of ordinal variables. Quality & Quantity. 2010;44(1):153–166. [Google Scholar]
- Hu LT, Bentler PM. Cutoff criteria for fit indices in covariance structure analysis: Conventional criteria versus new alternatives. Structural Equation Modeling. 1999;6(1):1–55. [Google Scholar]
- Kalichman SC, Cain D, Fuhrel A, Eaton L, Di Fonzo K, Ertl T. Assessing medication adherence self-efficacy among low-literacy patients: Development of a pictographic visual analogue scale. Health Education Research. 2005;20(1):24–35. doi: 10.1093/her/cyg106. [DOI] [PubMed] [Google Scholar]
- Kane MT. Validating the interpretations and uses of test scores. In: Lissitz RW, editor. The concept of validity. Charlotte, NC: Information Age; 2009. pp. 39–64. [Google Scholar]
- Kenny DA. Measuring model fit. 2014 Oct 6; Retrieved from: http://davidakenny.net/cm/fit.htm.
- Kenny DA, McCoach DB. Effect of the number of variables on measures of fit in structural equation modeling. Structural Equation Modeling. 2003;10(3):333–351. [Google Scholar]
- Masner JB, Wootton RR. Literacy and the Job Training Act: A survey study. Journal of Employment Counseling. 1993;30(1):13–14. [Google Scholar]
- Miller JD, Lynam DR. Reactive and proactive aggression: Similarities and differences. Personality and Individual Differences. 2006;41(8):1469–1480. [Google Scholar]
- Muirhead JE, Rhodes R. Literacy level of Canadian federal offenders. Journal of Correctional Education. 1998;49(2):59–60. [Google Scholar]
- Murray-Close D, Ostrov JM, Nelson DA, Crick NR, Coccaro EF. Proactive, reactive, and romantic relational aggression in adulthood: Measurement, predictive validity, gender differences, and association with Intermittent Explosive Disorder. Journal of Psychiatric Research. 2010;44(6):393–404. doi: 10.1016/j.jpsychires.2009.09.005. [DOI] [PMC free article] [PubMed] [Google Scholar]
- Muthen B. A general structural equation model with dichotomous, ordered categorical, and continuous latent variable indicators. Psychometrika. 1984;49(1):115–132. [Google Scholar]
- Paasche-Orlow MK, Clarke JG, Hebert MR, Ray MK, Stein MD. Educational attainment but not literacy is associated with HIV risk behavior among incarcerated women. Journal of Women's Health. 2005;14(9):852–859. doi: 10.1089/jwh.2005.14.852. [DOI] [PubMed] [Google Scholar]
- Palmer EJ, Hollin CR. Predicting reconviction using the Psychological Inventory of Criminal Thinking Styles with English prisoners. Legal and Criminological Psychology. 2004a;9(1):57–68. [Google Scholar]
- Palmer EJ, Hollin CR. The use of the Psychological Inventory of Criminal Thinking Styles with English young offenders. Legal and Criminological Psychology. 2004b;9(2):253–263. [Google Scholar]
- Poulin F, Boivin M. The role of proactive and reactive aggression in the formation and development of boys' friendships. Developmental Psychology. 2000;36(2):233–240. doi: 10.1037//0012-1649.36.2.233. [DOI] [PubMed] [Google Scholar]
- Rosseel Y. lavaan: An R package for structural equation modeling. Journal of Statistical Software. 2012;48(2):1–36. [Google Scholar]
- Ryan TA. Literacy training and reintegration of offenders. Forum on Corrections Research. 1991;3(1):17–23. [Google Scholar]
- Santorra A, Bentler PM. A scaled difference chi-square test statistic for moment structure analysis. Psychometrika. 2001;66(4):507–514. doi: 10.1007/s11336-009-9135-y. [DOI] [PMC free article] [PubMed] [Google Scholar]
- Savalei V. What to do about zero frequency cells when estimating polychoric correlations. Structural Equation Modeling. 2011;18(2):253–273. [Google Scholar]
- Shippen ME, Houchins DE, Crites SA, Derzis NC, Patterson D. An examination of the basic reading skills of incarcerated males. Adult Learning. 2010;21(3/4):4–12. [Google Scholar]
- Simpson D. The Readability Test Tool (Software) 2014 Available from http://read-able.com/
- Sykes GM, Matza D. Techniques of neutralization: A theory of delinquency. American Sociological Review. 1957;22(6):664–670. [Google Scholar]
- van Buuren S, Groothuis-Oudshoorn K. Mice: Multivariate imputation by chained equations in R. Journal of Statistical Software. 2011;45(3):1–67. [Google Scholar]
- Walters GD. The criminal lifestyle: Patterns of serious criminal conduct. Thousand Oaks, CA: Sage; 1990. [Google Scholar]
- Walters GD. The Psychological Inventory of Criminal Thinking Styles: I. Reliability and preliminary validity. Criminal Justice and Behavior. 1995a;22(3):307–325. [Google Scholar]
- Walters GD. The Psychological Inventory of Criminal Thinking Styles Part II: Identifying simulated responses sets. Criminal Justice and Behavior. 1995b;22(4):437–445. [Google Scholar]
- Walters GD. The Psychological Inventory of Criminal Thinking Styles: Part III. Predictive validity. International Journal of Offender Therapy and Comparative Criminology. 1996;40(2):105–112. [Google Scholar]
- Walters GD. Predicting short-term release outcome using the LCSF and PICTS. Journal of the Mental Health in Corrections Consortium. 1997;43(3&4):18–25. [Google Scholar]
- Walters GD. Revised validity scales for the Psychological Inventory of Criminal Thinking Styles (PICTS) Journal of Offender Rehabilitation. 2001;32(4):1–13. [Google Scholar]
- Walters GD. The Psychological Inventory of Criminal Thinking Styles (PICTS): A review and meta-analysis. Assessment. 2002;9(3):278–291. doi: 10.1177/1073191102009003007. [DOI] [PubMed] [Google Scholar]
- Walters GD. Predictors of early termination in a prison-based program of psychoeducation. The Prison Journal. 2004;84(2):171–183. [Google Scholar]
- Walters GD. How many factors are there on the PICTS? Criminal Behaviour and Mental Health. 2005a;15(4):273–283. doi: 10.1002/cbm.25. [DOI] [PubMed] [Google Scholar]
- Walters GD. Proactive and reactive aggression: A lifestyle view. In: Morgan JP, editor. Psychology of Aggression. Hauppauge, NY: Nova Science Publishers; 2005b. pp. 29–43. [Google Scholar]
- Walters GD. Proactive and reactive composite scales for the Psychological Inventory of Criminal Thinking Styles (PICTS) Journal of Offender Rehabilitation. 2006;42(4):23–36. [Google Scholar]
- Walters GD. Measuring proactive and reactive criminal thinking with the PICTS: Correlations with outcome expectancies and hostile attribution biases. Journal of Interpersonal Violence. 2007;22(4):371–385. doi: 10.1177/0886260506296988. [DOI] [PubMed] [Google Scholar]
- Walters GD. Effect of a longer versus shorter test-release interval on recidivism prediction with the Psychological Inventory of Criminal Thinking (PICTS) International Journal of Offender Therapy and Comparative Criminology. 2009;53(6):665–678. doi: 10.1177/0306624X08321867. [DOI] [PubMed] [Google Scholar]
- Walters GD. Criminal thinking and recidivism: Meta-analytic evidence on the predictive and incremental validity of the Psychological Inventory of Criminal Thinking Styles (PICTS) Aggression and Violent Behavior. 2012;17(3):272–278. [Google Scholar]
- Walters GD. An item response theory analysis of the Psychological Inventory of Criminal Thinking Styles: Comparing male and female probationers and prisoners. Psychological Assessment. 2014a;26(3):1050–1055. doi: 10.1037/pas0000014. [DOI] [PubMed] [Google Scholar]
- Walters GD. Relationships among race, education, criminal thinking, and recidivism: Moderator and mediator effects. Assessment. 2014b;21(1):82–91. doi: 10.1177/1073191112436665. [DOI] [PubMed] [Google Scholar]
- Walters GD, Deming A, Casbon T. Predicting recidivism in sex offenders with the psychological inventory of criminal thinking styles (PICTS) Assessment. 2015;22(2):167–177. doi: 10.1177/1073191114539384. [DOI] [PubMed] [Google Scholar]
- Walters GD, Deming A, Elliot WN. Assessing criminal thinking in male sex offenders with the Psychological Inventory of Criminal Thinking Styles. Criminal Justice and Behavior. 2009;36(10):1025–1036. [Google Scholar]
- Walters GD, Elliott WN. Predicting release and disciplinary outcome with the Psychological Inventory of Criminal Thinking Styles: Female data. Legal and Criminological Psychology. 1999;4(1):15–21. [Google Scholar]
- Walters GD, Elliott WN, Miscoll D. Use of the Psychological Inventory of Criminal Thinking Styles in a group of female offenders. Criminal Justice and Behavior. 1998;25(1):125–134. [Google Scholar]
- Walters GD, Frederick AA, Schlauch C. Postdicting arrests for proactive and reactive aggression with the PICTS Proactive and Reactive composite scales. Journal of Interpersonal Violence. 2007;22(11):1415–1430. doi: 10.1177/0886260507305556. [DOI] [PubMed] [Google Scholar]
- Walters GD, Geyer MD. Construct validity of the Psychological Inventory of Criminal Thinking Styles in relationship to the PAI, disciplinary adjustment, and program completion. Journal of Personality Assessment. 2005;84(3):252–260. doi: 10.1207/s15327752jpa8403_04. [DOI] [PubMed] [Google Scholar]
- Walters GD, Hagman BT, Cohn AM. Toward a hierarchical model of criminal thinking: Evidence from item response theory and confirmatory factor analysis. Psychological Assessment. 2011;23(4):925–936. doi: 10.1037/a0024017. [DOI] [PubMed] [Google Scholar]
- Williams MV, Baker DW, Honig EG, Lee TM, Nowlan A. Inadequate literacy is a barrier to asthma knowledge and self-care. Chest Journal. 1998;114(4):1008–1015. doi: 10.1378/chest.114.4.1008. [DOI] [PubMed] [Google Scholar]
- White JM, Wampler RS, Winn KI. The Identity Style Inventory: A revision with a sixth-grade reading level (ISI-6G) Journal of Adolescent Research. 1998;13(2):223–245. [Google Scholar]
- Wolf MS, Bennett CL, Davis TC, Marin E, Arnold C. A qualitative study of literacy and patient response to HIV medication adherence questionnaires. Journal of Health Communication. 2005;10(6):509–517. doi: 10.1080/10810730500228631. [DOI] [PubMed] [Google Scholar]
- Wolf MS, Chang CH, Davis T, Makoul G. Development and validation of the Communication and Attitudinal Self-efficacy scale for cancer (CASE-cancer) Patient Education & Counseling. 2005;57(3):333–341. doi: 10.1016/j.pec.2004.09.005. [DOI] [PubMed] [Google Scholar]
- Yochelson S, Samenow SE. The criminal personality: Vol I A profile for change. New York, NY: Jason Aronson; 1976. [Google Scholar]
- Yu CY. Doctoral dissertation. Los Angeles: University California; 2002. Evaluating cutoff criteria of model fit indices for latent variables models with binary and continuous outcomes. [Google Scholar]
- Zou GY. Toward using confidence intervals to compare correlations. Psychological Methods. 2007;12(4):399–413. doi: 10.1037/1082-989X.12.4.399. [DOI] [PubMed] [Google Scholar]