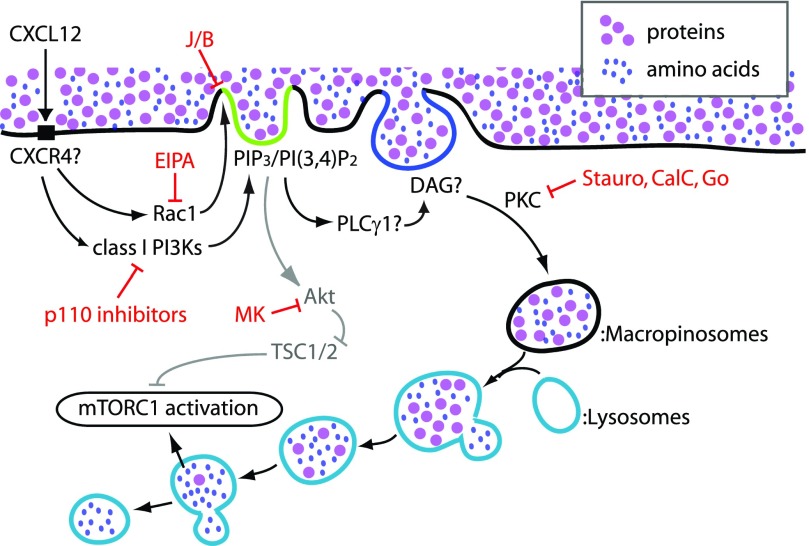
CXCL12-induced mTORC1 activation in BMM is regulated by two mechanisms: macropinosomes convey extracellular nutrients to lysosomes, and the macropinocytic cup localizes Akt signaling.
Keywords: PI3K, Akt, live-cell imaging
Abstract
Although growth factors and chemokines elicit different overall effects on cells—growth and chemotaxis, respectively—and activate distinct classes of cell-surface receptors, nonetheless, they trigger similar cellular activities and signaling pathways. The growth factor M-CSF and the chemokine CXCL12 both stimulate the endocytic process of macropinocytosis, and both activate the mechanistic target of rapamycin complex 1 (mTORC1), a protein complex that regulates cell metabolism. Recent studies of signaling by M-CSF in macrophages identified a role for macropinocytosis in the activation of mTORC1, in which delivery of extracellular amino acids into lysosomes via macropinocytosis was required for activation of mTORC1. Here, we analyzed the regulation of macropinosome (MP) formation in response to CXCL12 and identified 2 roles for macropinocytosis in the activation of mTORC1. Within 5 min of adding CXCL12, murine macrophages increased ruffling, macropinocytosis and amino acid-dependent activation of mTORC1. Inhibitors of macropinocytosis blocked activation of mTORC1, and various isoform-specific inhibitors of type 1 PI3K and protein kinase C (PKC) showed similar patterns of inhibition of macropinocytosis and mTORC1 activity. However, unlike the response to M-CSF, Akt phosphorylation (pAkt) in response to CXCL12 required the actin cytoskeleton and the formation of macropinocytic cups. Quantitative fluorescence microscopy showed that phosphatidylinositol (3,4,5)-trisphosphate (PIP3), a product of PI3K and an upstream activator of Akt, localized to macropinocytic cups and that pAkt occurred primarily in cups. These results indicate that CXCL12 activates mTORC1 via 2 mechanisms: 1) that the macropinocytic cup localizes Akt signaling and 2) that MPs convey extracellular nutrients to lysosomes.
Introduction
Macropinocytosis is a dynamic endocytic process in which large vesicles form from actin-rich cell-surface ruffles. It is a common activity in cells stimulated by growth factors and chemokines and in cells transformed by oncogenic mutations. Since its discovery by time-lapse microscopy of macrophages and sarcoma cells [1], macropinocytosis has been implicated in antigen processing by phagocytes [2], uptake of bacteria and viruses [3, 4], and cell growth and cancer [5–8]. MPs internalize nutrients necessary for anabolic metabolism and may also serve as essential components of signal transduction.
M-CSF is a hematopoietic growth factor that stimulates macropinocytosis in BMMs [9]. MP formation begins with Rac1 activation, which triggers formation of actin-rich membrane ruffles and macropinocytic cups. Class I PI3Ks transiently synthesize PIP3 and PI(3,4)P2 in the inner leaflet of the cup membrane, which recruits and activates Akt and PLCγ, which generates DAG, which activates PKC and Ras, leading to closure of the cup into a MP [10, 11]. The components of a MP membrane change during intracellular trafficking; the GTPase Rab5a is exchanged for Rab7 before the MP fuses with the lysosome [12].
We recently demonstrated that macropinocytosis is required for M-CSF-induced activation of mTORC1, a key promoter of cell growth and proliferation in response to growth factors, cytokines, and amino acids [13, 14]. Growth factor-induced mTORC1 activation requires 2 small GTPases—Rag and Rheb—which are located on the lysosome and are regulated by amino acids and growth factors, respectively [15, 16]. MPs formed after M-CSF stimulation deliver extracellular amino acids into the lysosome, resulting in Rag activation, a vesicular pathway of mTORC1 activation [7]. Meanwhile, PIP3 or PI(3,4)P2 synthesized in membranes recruits Akt via its PIP3-binding PH domain, and membrane-localized Akt is phosphorylated by PDK1. pAkt inhibits the repressive activity of the TSC1/2 protein complex, thereby activating Rheb and providing a cytosolic pathway of mTORC1 activation. Thus, M-CSF activates mTORC1 by 2 coordinated pathways: vesicular and cytosolic [7].
These studies were initiated as a test of the hypothesis, developed in our earlier study of growth factor signaling, that MPs are discrete units of signal transduction to mTORC1. The chemokine CXCL12 binds to the G-protein-coupled receptor CXCR4 to stimulate chemotaxis in macrophages [17]. It also stimulates macropinocytosis in human hepatocarcinoma cells, HeLa cells, and BMM [18–21]. Therefore, CXCL12 provides a growth factor-independent mechanism for inducing MPs and asking if, like M-CSF, CXCL12-stimulated macropinocytosis can activate mTORC1 by a vesicular pathway, delivering extracellular amino acids into lysosomes, and by a cytosolic pathway involving pAkt. To test this idea, we analyzed the mechanism of MP formation in BMM in response to CXCL12 and the relationship between macropinocytosis and activation of mTORC1. We show that macropinocytosis is necessary for activation of mTORC1 by CXCL12 in macrophages and that different PI3K p110 isoforms contribute to MP formation, pAkt, and mTORC1 activation. Unlike M-CSF-induced activation of mTORC1, the cytosolic pathway leading to pAkt, induced by CXCL12, required membrane ruffling and macropinocytic cup formation. These findings indicate 2 essential roles for macropinocytosis in receptor signaling to mTORC1 in macrophages.
MATERIALS AND METHODS
Reagents
DMEM (low glucose; 11885), DPBS, HBSS, EIPA, and FITC-Dextran MW 70,000 (FDx70) were purchased from Thermo Fisher Scientific (Waltham, MA, USA). CXCL12 was from PeproTech (Rocky Hill, NJ, USA). Mouse M-CSF was from R&D Systems (Minneapolis, MN, USA). MK2206 was from ApexBio (Boston, MA, USA). Calphostin C was from EMD Millipore (Billerica, MA, USA). Blebbistatin, staurosporine, and Gö6976 were from Abcam (Cambridge, MA, USA). Jasplakinolide was from Enzo Life Sciences (Farmingdale, NY, USA). A66, TGX221, IC87114, and AS252424 were from Symansis Cell Signaling Sciences (Temecula, CA, USA). LY294002, anti-S6K (2708), anti-pS6K (Thr389; 9234), anti-Akt (9272), anti-pAkt (Thr308; 4056), anti-Erk1/2 (4695), anti-pErk1/2 (Thr202/Tyr204; 4376), anti-TSC2 (4308), anti-pTSC2 (3617), anti-4EBP1 (9644), anti-p4EBP1 (Thr37/46; 2855), anti-Akt (2920), and anti-pAkt (Thr308; 2965) antibodies were from Cell Signaling Technology (Danvers, MA, USA). HRP-conjugated goat anti-rabbit IgG was from GE Healthcare (Pittsburgh, PA, USA). Anti-rabbit Alexa-488 and anti-mouse Alexa-594 antibodies were used as secondary antibodies (Thermo Fisher Scientific).
Cells
BMMs were generated from femurs of C57BL/6J mice and cultured for 6–7 d, as described previously [10]. All animal-related procedures were approved by the University of Michigan Committee on Use and Care of Animals.
MP assay and mTORC1 assay
The number of induced MPs per BMM was quantified, as described previously [7]. FDx70 (0.5 mg/ml) was added together with CXCL12 (50 nM) or M-CSF (6.9 nM or 0.14 nM). After 5 or 15 min, uningested dye was removed by gentle washing with DPBS, and cells were fixed for 30 min at 37°C with fixation buffer A (20 mM HEPES, pH 7.4, 2% paraformaldehyde, 4.5% sucrose, 70 mM NaCl, 10 mM KCl, 10 mM MgCl2, 2 mM EGTA, 70 mM lysine-HCl, 10 mM sodium periodate), followed by rinsing in DPBS and microscopic observation. More than 25 cells were observed for each assay. Merged images of phase-contrast and background-subtracted FDx70 images were generated using MetaMorph (Molecular Devices, Sunnyvale, CA, USA), and the number of induced MPs per cell was determined by counting FDx-positive vesicles. From 3 independent experiments, the number of induced MPs per cell under each condition was calculated and presented as mean and sem. One-way ANOVA and Tukey’s tests were used for statistical analysis. To measure mTORC1 and related activities, pS6K, pAkt, pERK, p4EBP1, and pTSC2 were analyzed by Western blotting. BMMs were stimulated by buffer (control), CXCL12 (50 or 200 nM), or M-CSF (6.9 or 0.14 nM) for 5 min and lysed for 10 min in ice-cold lysis buffer [40 mM HEPES, pH 7.5, 120 mM NaCl, 1 mM EDTA, 10 mM pyrophosphate, 10 mM glycerophosphate, 50 mM NaF, 1.5 mM Na3VO4, 0.3% CHAPS, and a mixture of protease inhibitors (Roche Applied Science, Indianapolis, IN, USA)]. Lysates were centrifuged for 15 min at 13,000 g, and the supernatant was mixed with 4× SDS buffer and boiled for 5 min. Two or more independent experiments were performed to confirm the results of pilot experiments.
Cell treatments
For both MP and mTORC1 assays, BMMs were cultured in DMEM (low glucose) without FBS overnight. For inhibitor treatments, cells were pretreated with LY294002 (50 μM), MK2206 (2 μM), or EIPA (25 μM) for 30 min in DMEM (low glucose). A combination of blebbistatin (75 μM for 35 min) and jasplakinolide (1 μM for 15 min) was also used. For p110 isoform inhibitor experiments, cells were pretreated for 30 min with A66 (3 μM), TGX221 (0.5 μM), AS252424 (2 µM), and/or IC87114 (2 µM) before 5 min CXCL12 stimulation [7, 22, 23], followed by observation or fixation. To inhibit PKC, cells were pretreated with staurosporine (100 μM) or Gö6976 (2 or 5 µM) for 30 min or with calphostin C (200 nM) for 50 min in a CO2 incubator before transfer into a biologic safety cabinet for light activation for another 10 min [7, 24]. For amino acid depletion assays, cells were cultured in HBSS instead of DMEM for 30 min before stimulation with CXCL12. Images were captured on a Nikon Eclipse TE-300 inverted microscope with a 60× numerical aperture 1.4 oil-immersion PlanApo objective lens (Nikon, Tokyo, Japan) and recorded on MetaMorph software using a Photometrics CoolSNAP HQ CCD camera (Photometrics, Tucson, AZ, USA).
Quantitative membrane-ruffling assay
Time-lapse images were captured every 20 s, and montage images were made using MetaMorph. After capturing time-lapse phase-contrast images, the membrane-ruffling area was defined by tracing phase-dark areas inside of the cell. Threshold binary images indicating the phase-dark areas were made with the “Binary Operations” command in MetaMorph. To quantify the area of membrane ruffling, first, a square region that included the entire cell profile throughout the image series was defined using the phase-contrast images. The square was then transferred from the phase-contrast image stack to the binary image montage (location relative to the cell was maintained), allowing measurement of the total binary area of membrane ruffling within the defined square region. The ruffling area at each time point was calculated relative to the area at the time when CXCL12 was added (t = 0 min). Student’s t test was used for statistical analysis.
Ratio imaging
The plasmids pECFP-N1, pmCitrine-C1, and pAkt-PH-mCitrine were used for the expression of CFP, YFP, and YFP-Akt-PH, respectively [11]. Plasmids were transfected into BMM using the Amaxa Mouse Macrophage Nucleofector kit (Lonza, Cologne, Germany), according to the manufacturer's protocol. As a control experiment, free mCitrine (as YFP) and free CFP were expressed in BMM. Phase-contrast, YFP, and CFP images of live BMMs were captured every 20 s for 10 min. Ratio images of YFP-Akt-PH relative to CFP were generated, as described previously [11]. The ratio image corrects for variations in optical path length as a result of cell shape. The comparison of phase-contrast and ratio images allowed us to relate the morphologic process of macropinocytosis with the timing of the YFP-Akt-PH association with the plasma membrane.
Immunofluorescence staining of Akt and pAkt
Immunofluorescence staining of Akt and pAkt was carried out by following the established method reported previously [25], with several modifications. BMMs, treated for 1 or 3 min with or without CXCL12, were fixed at room temperature for 10 min with fixation buffer B (4% paraformaldehyde, 20 mM HEPES, pH 7.4, 70 mM NaCl, 10 mM KCl, 10 mM MgCl2, 2 mM EGTA, 70 mM lysine-HCl, 10 mM sodium periodate). Cells were washed 3 times with TBS (50 mM Tris, 150 mM NaCl, pH 7.6), permeabilized in freshly prepared 0.2% saponin in TBS (w/v) for 15 min at room temperature, and then incubated in 1% BSA in TBST (w/v) for 30 min at room temperature. Anti-Akt (2920; Cell Signaling Technology) and anti-pAkt (Thr308; 2965; Cell Signaling Technology) antibodies were diluted at 1:50 in blocking buffer and incubated with the samples for 2 h at room temperature as primary antibody treatment. Samples were washed with TBST for 3 × 10 min. Anti-rabbit Alexa 488 and anti-mouse Alexa 594 antibodies were diluted at 1:200 in blocking buffer and incubated with the samples for 1.5 h at room temperature as secondary antibody treatment. Samples were washed with TBST for 3 × 5 min and with distilled water for 5 min before mounting for microscopic observation.
Quantitative pAkt/Akt assay
With the use of MetaMorph image analysis software, Akt (572–632) and pAkt (500–535) images were corrected for shade, bias, and background [26]. A binary image map was then produced from the corrected Akt (denominator) image. The corrected Akt images and binary images were combined using the “Logical AND” command (AND Akt image), and the corrected pAkt image was divided by the AND Akt image, multiplied by 100. These ratio images were analyzed to quantify the total intensity of pAkt/Akt signaling in 10 or more cells. The ratio image was thresholded to exclude background area, and cellular regions were selected manually. With the use of the “Region Measurements” command, the pAkt/Akt Integrated Intensity and Threshold Area for each cell were logged to Excel. In Excel, integrated intensities were divided by the threshold areas to yield relative intensities. Student’s t test was applied to the results of 3 independent experiments.
Online supplemental material
Five Supplemental figures support the conclusions of this paper.
RESULTS
CXCL12 elicits membrane ruffles and MPs in BMMs
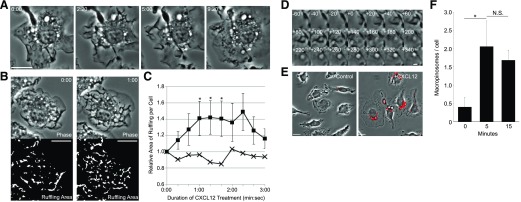
The response of BMM to CXCL12 resembled their response to M-CSF. Time-lapse microscopy of cells stimulated with CXCL12 showed vigorous membrane ruffling and MP formation (Fig. 1A). Ruffling increased immediately after CXCL12 treatment and continued for 3 min following addition of CXCL12 (Fig. 1B and C). Ruffles changed into macropinocytic cups, which closed after 60 s. By 200 s, the internalization of a phase-bright MP was complete (Fig. 1D). Quantification showed that in 5 min following CXCL12 addition, BMM formed an average of 2.06 MPs per cell. This number decreased slightly by 15 min, suggesting that macropinocytosis was induced within 5 min and that MPs began the maturation process within the following 10 min (Fig. 1E and F).
Figure 1. CXCL12 induces membrane ruffling and macropinocytosis in BMMs.
(A) CXCL12 treatment induced membrane ruffles and MPs (arrows). Times after addition of CXCL12 are indicated at top left (minutes:seconds). Original scale bar, 10 μm. (B) Quantification of membrane ruffling induced by CXCL12. The area of membrane ruffling was defined as phase-dark patches in the phase-contrast image. Time after addition of CXCL12 is indicated [upper, top right (minutes:seconds)]. Original scale bars, 10 μm. (C) Quantitative analysis of ruffling area with (n = 7; squares) and without (n = 8; crosses) CXCL12. The area of membrane ruffling was measured from the binary images (as shown in B). The ruffling areas increased significantly after CXCL12 stimulation (*P < 0.05). (D) Montage image of MP formation in the cell shown in A. MP formation began with membrane ruffling (t = −60 to +0 s). A C-shaped ruffle (t = +0 s) curved into an O-shaped cup (t = +60 s) and then pinched shut (from t = +200 s). Original scale bar, 2 μm. (E) Phase-contrast images of BMM incubated 5 min in the presence of FDx70 without (Control) or with (+CXCL12) CXCL12. The vesicles labeled with red overlay indicate FDx70-positive MPs. Original scale bars, 10 μm. (F) CXCL12 induces macropinocytosis within 5 min. BMMs were treated with CXCL12 and FDx70 for the indicated times and then were fixed and scored for FDx70-positive MPs. More than 75 cells from 3 independent experiments were observed. *P < 0.05. N.S., No significant difference.
Roles for PI3K p110 isoforms in MP formation
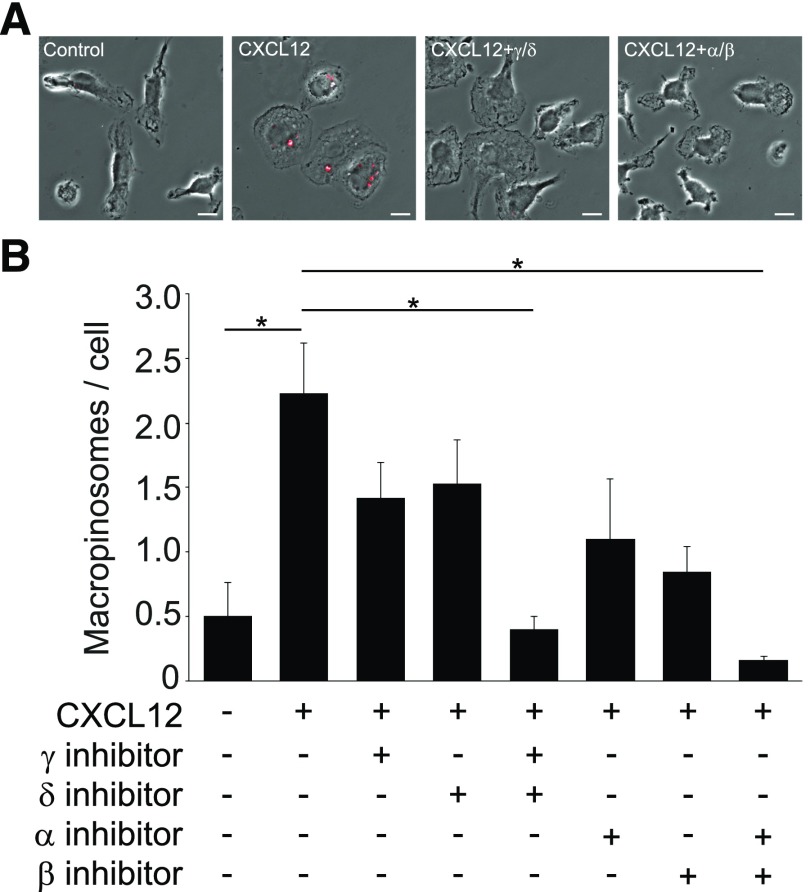
Class I PI3Ks are heterodimers consisting of a p85 regulatory subunit and a p110 catalytic subunit. p110α and p110β are expressed ubiquitously, whereas p110δ and p110γ are mostly expressed in leukocytes [27]. We investigated the involvement of the different class I PI3K isoforms in CXCL12-induced MP formation using isoform-specific inhibitors. The general PI3K inhibitor LY294002 inhibited CXCL12-induced macropinocytosis (Supplemental Fig. 1). Independent inhibition of each p110 isoform resulted in partial inhibition of MP formation (Fig. 2). Combined inhibitor treatments of A66 (p110α inhibitor)/TGX221 (p110β inhibitor) and AS252424 (p110γ inhibitor)/IC87114 (p110δ inhibitor) yielded nearly complete inhibition of macropinocytosis. These results indicate that CXCL12-induced macropinocytosis is differentially regulated by class I PI3Ks.
Figure 2. PI3K p110 isoform inhibitors inhibit macropinocytosis.
(A) Fixed-cell imaging of MP formation following treatment with inhibitors. FDx-positive vesicles (MPs) are labeled with red overlay. CXCL12 treatment induced MP formation. Compared with the +CXCL12 sample (CXCL12), cells treated with a combination of p110δ and p110γ inhibitors (CXCL12+γ/δ) or a combination of p110α and p110β inhibitors (CXCL12+α/β) contained few or no MPs. Original scale bars, 10 μm. (B) Quantification of the MP assay. Partial inhibition of pinocytosis was evident when cells were treated with the p110γ inhibitor (AS252424), p110δ inhibitor (IC87114), p110α inhibitor (A66), or p110β inhibitor (TGX221) independently. When used in combination, however, the cocktail of p110γ/δ inhibitors or p110α/β inhibitors yielded nearly complete inhibition of macropinocytosis (*P < 0.05). More than 75 cells from 3 independent experiments were observed.
p110α and p110γ inhibitors attenuate pAkt and pS6K
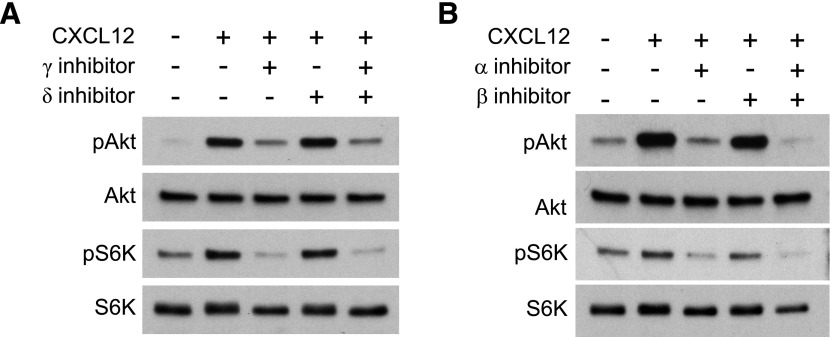
To determine which isoforms are directly involved in pAkt and pS6K in response to CXCL12, we performed Western blot analyses of BMM treated with p110 isoform-specific inhibitors. A 5 min CXCL12 treatment was sufficient to induce pAkt and pS6K (Fig. 3). Levels of pAkt and pS6K were decreased significantly by the p110γ inhibitor AS252424 and the p110α inhibitor A66 but not by p110δ inhibitor IC87114 or the p110β inhibitor TGX221 (Fig. 3). A combination of p110β and p110δ inhibitors did not affect CXCL12-induced pAkt (Supplemental Fig. 2), indicating that the p110γ and p110α isoforms perform more significant roles than the p110δ and p110β isoforms in CXCL12-induced pAkt and mTORC1 activation in macrophages.
Figure 3. p110γ and p110α inhibitors attenuated CXCL12-induced pAkt and pS6K.
(A) The p110γ inhibitor (AS252424), but not the p110δ inhibitor (IC87114), blocked pAkt and pS6K. (B) The p110α inhibitor (A66), but not the p110β inhibitor (TGX221), blocked CXCL12-induced pAkt and pS6K.
CXCL12-stimulated mTORC1 activation requires extracellular amino acids
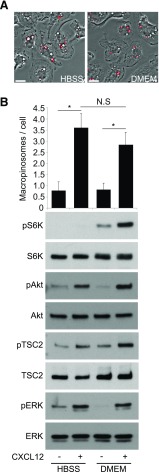
To investigate the effect of ingested amino acids by CXCL12-induced macropinocytosis on mTORC1 activation, BMMs were stimulated for 5 min with CXCL12 in amino acid-free (HBSS) or amino acid-rich (DMEM) conditions (Fig. 4). Whereas cells in the no-stimulus control groups produced few MPs, cells stimulated with CXCL12 in either HBSS or DMEM produced significantly more MPs (Fig. 4A and B). However, Western blot analysis of cell lysates from each condition showed that pAkt and pTSC2 were apparent in both HBSS and DMEM, but pS6K increased in the DMEM condition only (Fig. 4B). pERK was increased with or without amino acids, as has been reported in other cells [28–31] (Fig. 4B). Thus, CXCL12 induced macropinocytosis and pAkt and pTSC2 in the presence or absence of amino acids, yet pS6K required amino acids.
Figure 4. Depletion of extracellular amino acids diminishes CXCL12-induced mTORC1activation without inhibiting macropinocytosis.
(A) Phase-contrast images of BMM treated with CXCL12 and FDx70 for 5 min in HBSS (no amino acids) versus DMEM (physiologic levels of amino acids). Fluorescence microscopy showed many FDx70-positive MPs (red overlay) both in HBSS and in DMEM. Original scale bars, 10 μm. (B) The bar graph displays quantitative analysis of CXCL12-induced macropinocytosis. Western blot analysis showed no pS6K after CXCL12 treatment in HBSS but increased pS6K after CXCL12 treatment in DMEM. More than 75 cells from 3 independent experiments were observed. *P < 0.05. N.S., No significant difference.
Akt inhibitor blocks CXCL12-induced mTORC1 activation but not macropinocytosis
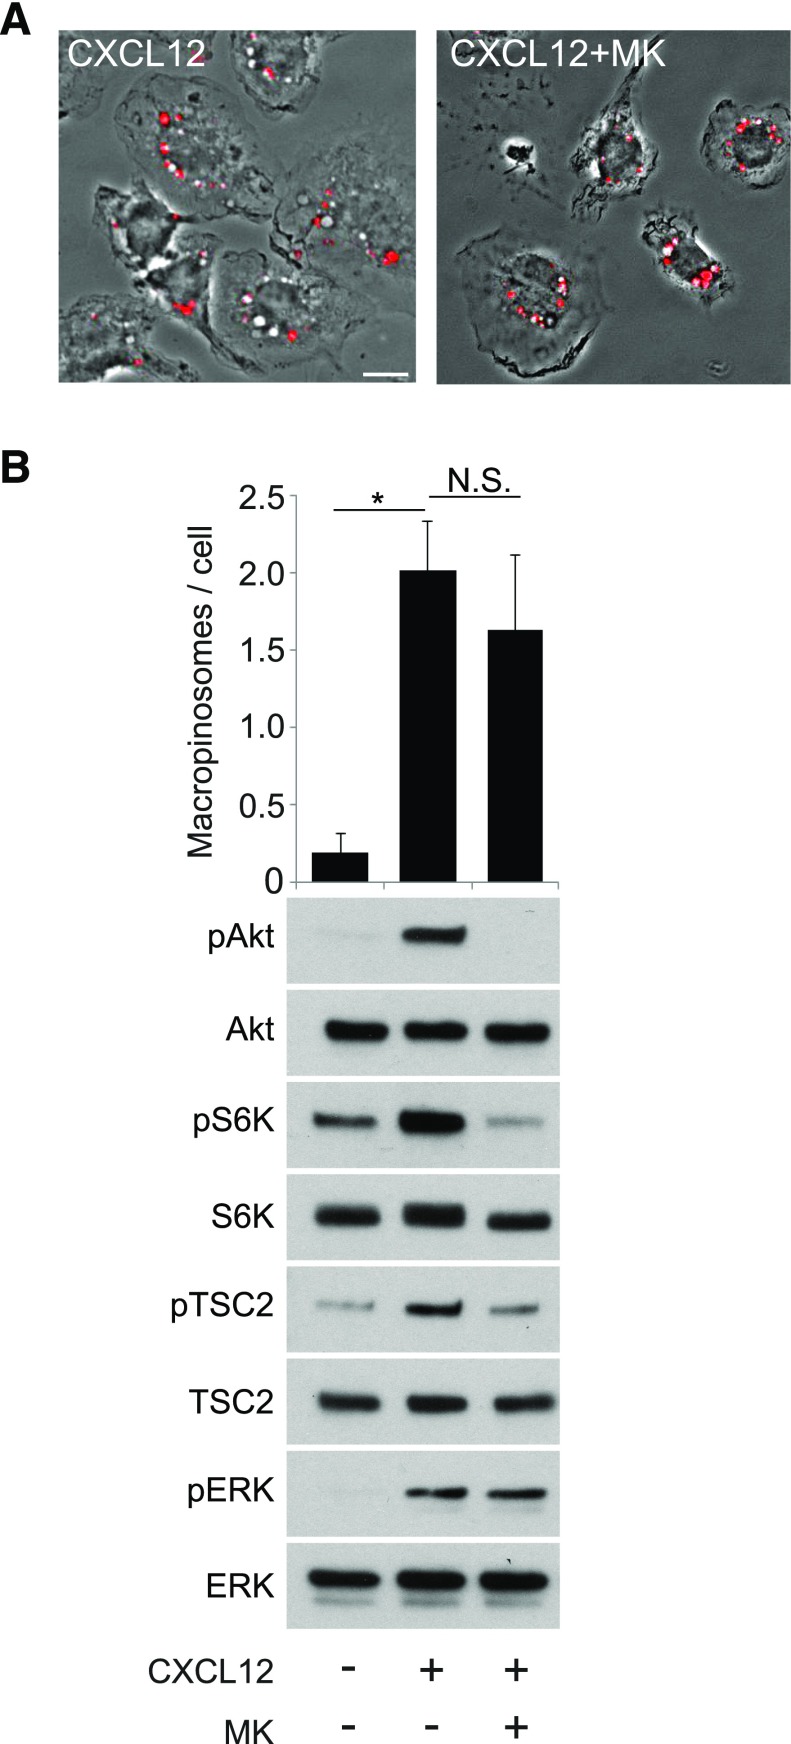
Given that p110 inhibitors block macropinocytosis (Fig. 2), we hypothesized that Akt contributes to CXCL12-induced MP formation. To test this, we measured the effects of the Akt-specific inhibitor MK2206 [32] on macropinocytosis and growth factor signaling in response to CXCL12. The inhibitor did not significantly reduce macropinocytosis (Fig. 5A and B) but reduced pAkt, pTSC2, and pS6K without affecting pERK (Fig. 5B), similar to what was observed after stimulation with M-CSF [7]. Therefore, although Akt is not required for macropinocytosis, it activates the TSC pathway in response to CXCL12 stimulation.
Figure 5. PI3K regulates CXCL12-induced macropinocytosis independent of Akt function.
(A) Phase-contrast images of BMM treated with FDx70 and CXCL12 for 5 min without inhibitor (CXCL12) or with (CXCL12+MK) the Akt inhibitor MK2206. FDx70 fluorescent images (red signal) overlay the phase-contrast images. CXCL12-induced macropinocytosis was not inhibited by MK2206. Original scale bar, 10 μm. (B, upper) The bar graph displays the quantified results of MP assays with no treatment, CXCL12 treatment, and CXCL12 treatment with MK2206. (Lower) Western blot analysis shows that MK2206 completely blocked pAkt and inhibited pTSC2 and pS6K compared with the positive stimulus condition (+CXCL12). CXCL12-induced pERK was not affected. More than 75 cells from 3 independent experiments were observed. *P < 0.05. N.S., No significant difference.
Macropinocytosis-specific inhibitors attenuate CXCL12-induced mTORC1 activation
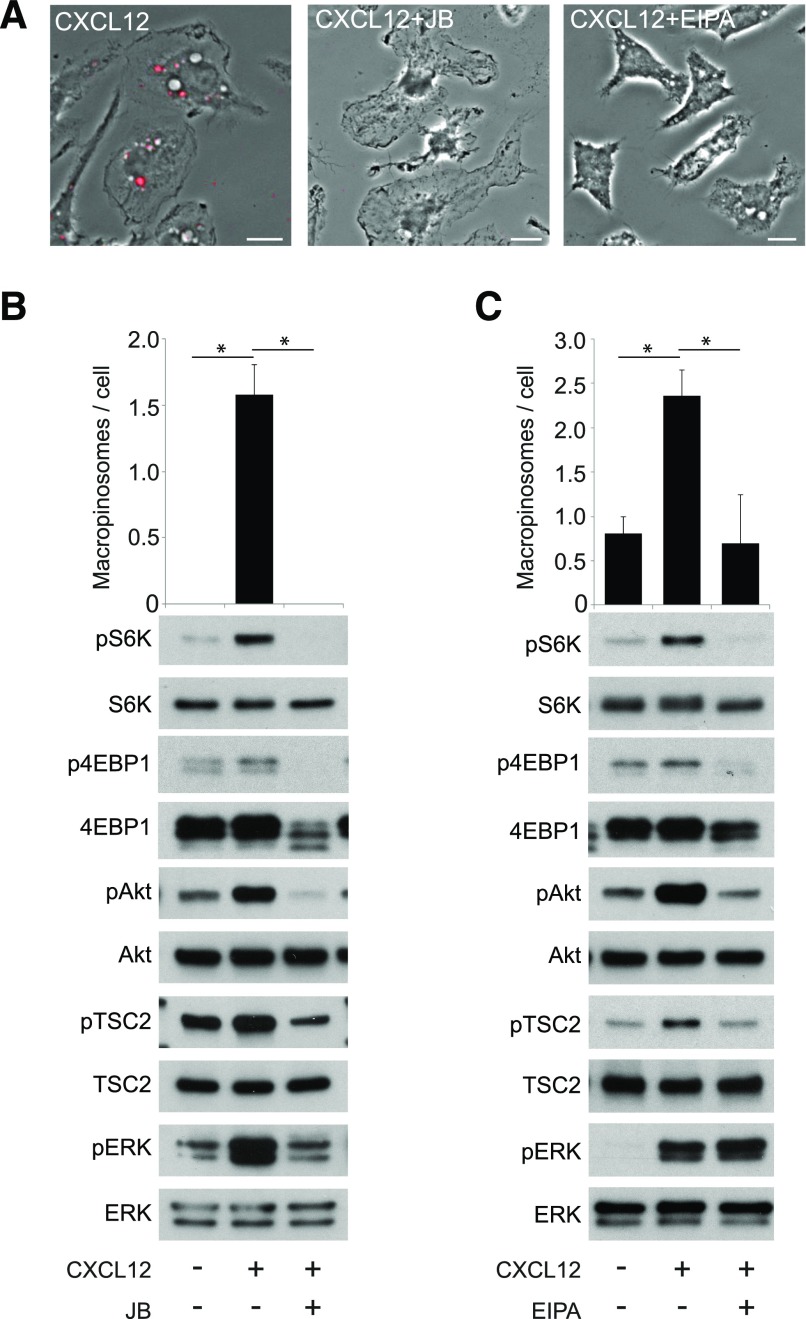
Based on the role of macropinocytosis in mTORC1 activation by M-CSF, we hypothesized that the morphologic changes triggered by CXCL12 treatment were required for mTORC1 activation but not for pAkt. To test this, we used the cytoskeleton inhibitors J/B and the macropinocytosis inhibitor EIPA to block CXCL12-induced membrane ruffling and macropinocytosis (Fig. 6). Both treatments inhibited pS6K, but in contrast to what was observed for M-CSF [7], they also attenuated CXCL12-induced pAkt and pTSC2 (Fig. 6B and C, and Supplemental Fig. 3). Additionally, whereas J/B treatments inhibited pS6K and pERK (Fig. 6B), EIPA blocked pS6K but not pERK. Although EIPA is not entirely specific for macropinocytosis and may interfere more generally with activation of Rac [33], these data suggest that CXCL12-induced ruffles and cups trigger the Akt pathway. J/B and EIPA also blocked p4EBP1, another target of mTORC1 (Fig. 6B and C). Collectively, these data strongly suggest that CXCL12-induced macropinocytosis also contributes to the cytosolic (Akt/TSC2) pathway for activation of mTORC1.
Figure 6. Inhibition of membrane ruffling and macropinocytic cup formation attenuates CXCL12-induced pAkt and mTORC1 activation.
(A) Phase-contrast images of BMM treated with FDx70 and CXCL12 for 5 min without inhibitor (CXCL12), with a combination of cytoskeleton inhibitors J/.B (CXCL12+J/B), or with macropinocytosis inhibitor EIPA (CXCL12+EIPA). FDx70 fluorescent images (red signal) overlay the phase-contrast images. Red-filled vesicles are MPs. J/B and EIPA blocked CXCL12-induced membrane ruffling and macropinocytosis. Original scale bars, 10 μm. (B) MP formation after no treatment, CXCL12, and CXCL12 with J/B. J/B significantly decreased the average number of MPs per cell. Western blot analysis shows a decrease in pAkt, pS6K, p4EBP1, pTSC2, and pERK in J/B + CXCL12-treated cells compared with the CXCL12 (no inhibitor) sample. (C) EIPA significantly decreased the average number of MPs per cell. Western blot analysis shows a decrease in pAkt, pS6K, p4EBP1, and pTSC2 in the EIPA + CXCL12 treatment compared with the CXCL12 (no inhibitor) condition. More than 75 cells from 3 independent experiments were observed. *P < 0.05.
In considering why pAkt, in response to CXCL12 (50 nM), was sensitive to inhibitors of macropinocytosis, we noticed that the magnitude of signals elicited by M-CSF (6.9 nM) was greater than that elicited by CXCL12 (50 nM; Supplemental Fig. 3A). We hypothesized that signaling by lower concentrations of M-CSF may also require structure-based signal amplification for activation of Akt. To investigate further the relationship between macropinocytosis and pAkt, we measured the effect of EIPA on signaling in response to high (6.9 nM) and low (0.14 nM) concentrations of M-CSF (Supplemental Fig. 3B). As reported previously [7], pAkt and pTSC2, in response to high concentrations of M-CSF, were not blocked by EIPA treatment. However, in response to low concentrations of M-CSF, pAkt and pS6K, but not pERK, were attenuated by EIPA. The low level of pAkt elicited by CXCL12 was not a consequence of using submaximal concentrations, as increasing the CXCL12 concentration to 200 nM did not affect pAkt levels. pAkt induced by 200 nM CXCL12 was also attenuated by EIPA (Supplemental Fig. 3A). These results indicate that maximal M-CSF concentrations trigger sufficiently strong PI3K signaling to induce cup-independent pAkt, whereas 0.14 nM M-CSF and CXCL12 require the cup structure for signal amplification.
PKC inhibitors block CXCL12-induced macropinocytosis and mTORC1 activation
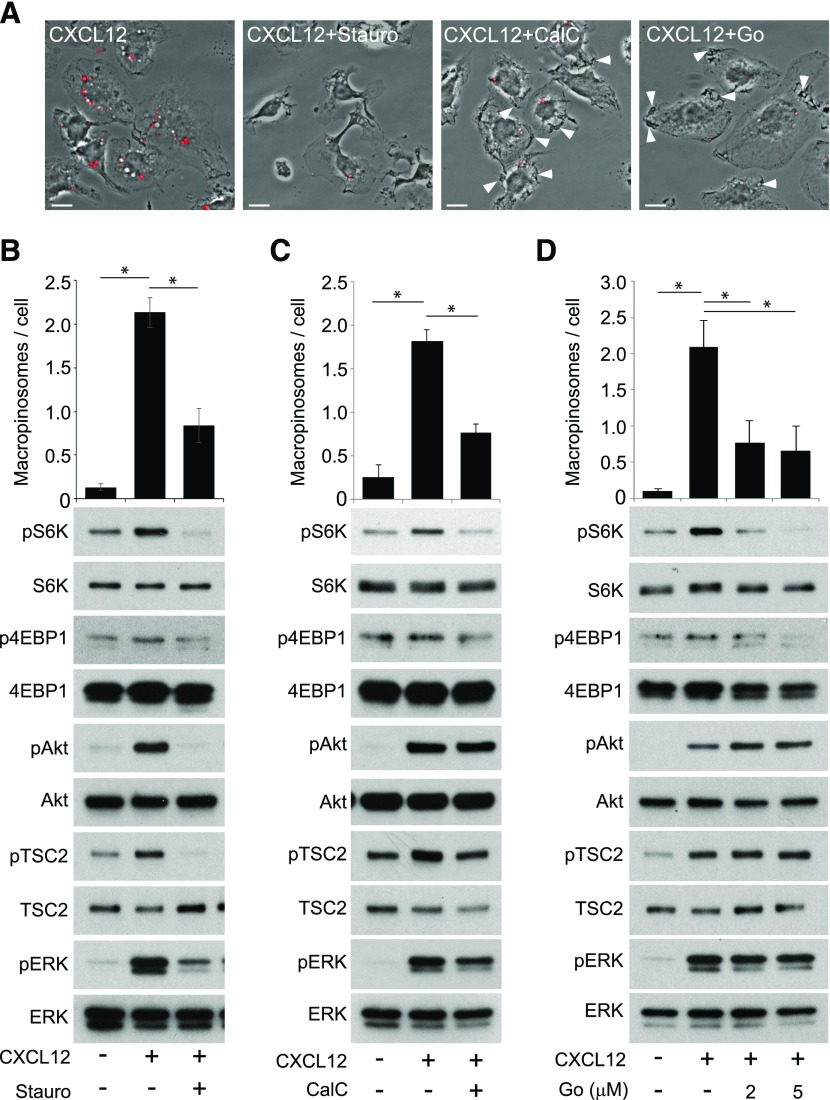
PKC is required for macropinocytosis in several cell types [34]. We investigated the role of PKCs in CXCL12-induced macropinocytosis and mTORC1 activation using the PKC inhibitors staurosporine, calphostin C, and Gö6976, which have been shown previously to inhibit macropinocytosis [7, 35, 36]. Staurosporine inhibited macropinocytosis and pAkt and pS6K (Fig. 7A and B). In calphostin C, cells induced membrane ruffles and cup-like structures, but MP closure was blocked (Fig. 7A and C), suggesting that calphostin C blocked CXCL12-induced macropinocytosis by inhibiting cup closure. Western blot analysis showed that whereas pAkt, pTSC2, and pERK levels were not reduced by calphostin C, pS6K decreased slightly (Fig. 7C). This suggests that the inhibitor reduced the vesicular pathway to mTORC1 but not the cytosolic pathway. Likewise, Gö6976 inhibited MP formation but not the formation of membrane ruffles and cup-like structures (Fig. 7A and D). Gö6976 also attenuated pS6K without inhibiting pAkt, pTSC2, or pERK (Fig. 7D). The specificity of Gö6976 for PKCα and -β [37] suggests that these PKC isoforms are necessary for macropinocytic cup closure and pS6K. Staurosporine and calphostin C weakly blocked p4EBP1, another reporter of mTORC1 activity (Fig. 7B and C), and Gö6976 completely blocked p4EBP1 (Fig. 7D). These results suggest that different PKC isoforms serve distinct roles in the mechanism of pAkt and macropinocytosis.
Figure 7. Inhibition of PKC attenuates CXCL12-induced macropinocytosis and pS6K.
(A) Phase-contrast images of BMM treated with FDx70 and CXCL12 for 5 min without inhibitors (CXCL12), with staurosporine (CXCL12+Stauro), calphostin C (CXCL12+CalC), or Gö6976 (CXCL12+Go). FDx70 fluorescent images (red signal) overlay the phase-contrast images; red-filled vesicles are MPs induced by the experimental conditions. Staurosporine blocked CXCL12-induced membrane ruffling and macropinocytosis. Calphostin C and Gö6976 blocked macropinocytosis but not macropinocytic cup formation (white arrowheads). Original scale bars, 10 μm. (B) Staurosporine significantly decreased the average number of CXCL12-induced MPs per cell and inhibited pAkt, pS6K, pTSC2, and pERK. (C) Calphostin C significantly decreased the average number of MPs per cell. Western blot analysis shows that pAkt, pTSC2, and pERK, after CXCL12 treatment, was unaffected by calphostin C, and calphostin C inhibited pS6K and induced a slight decrease in p4EBP1. (D) Gö6976 significantly decreased the average number of MPs per cell. Western blot analysis showed that pAkt, pTSC2, and pERK, after CXCL12 treatment, with and without Gö6976, were equivalent, whereas pS6K and p4EBP1 were decreased. More than 75 cells from 3 independent experiments were observed. *P < 0.05.
Akt is phosphorylated within macropinocytic cups
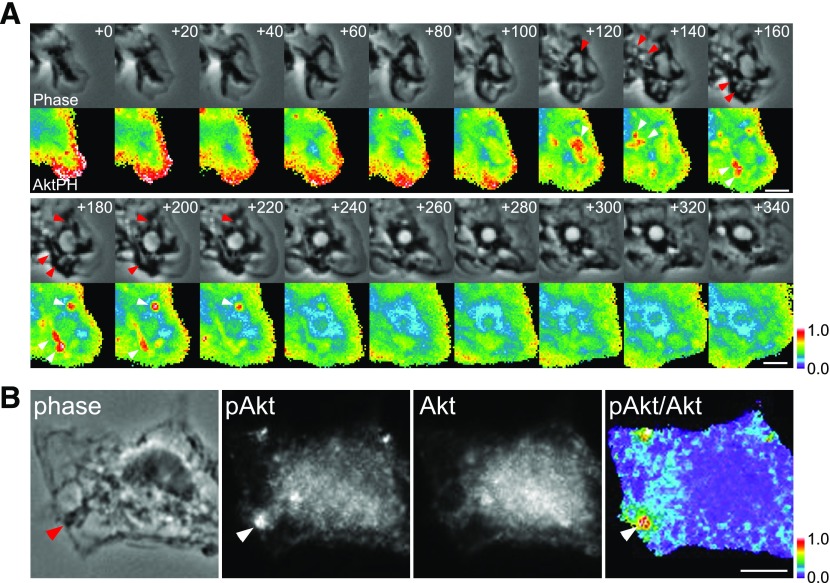
Activated class I PI3Ks generate PIP3 and PI(3,4)P2 at the plasma membrane. Akt recruited via its PH domain to these phosphoinositides is directly phosphorylated at threonine 308 by PDK1 [38, 39] within 5 min of CXCL12 treatment. By expressing a fluorescent protein-tagged PH domain of Akt in BMM, we inferred the distributions of Akt by monitoring PIP3 and PI(3,4)P2 distributions in live cells. Ratiometric imaging showed that YFP-Akt-PH was recruited to membrane ruffles shortly after addition of CXCL12 (Fig 8A; +0 to + 80 s). Once membrane ruffles changed to macropinocytic cups, YFP-Akt-PH accumulated transiently in the cup structures (Fig. 8A; +120 to +220 s), as observed previously in Dictyostelium [40], EGF-stimulated A431 cells [41], and M-CSF-stimulated BMM [11]. As a negative control, we observed cells expressing free CFP and free YFP and confirmed that the ratiometric analysis yielded uniform images (Supplemental Fig. 4). Therefore, CXCL12-activated class I PI3Ks generated PIP3 and PI(3,4)P2 in ruffles and cups, and the dynamics of Akt-PH suggested that Akt itself was recruited to and phosphorylated at ruffles and cups.
Figure 8. CXCL12-induced membrane ruffles and macropinocytic cups activate Akt.
(A) BMMs expressing YFP-Akt-PH and CFP were imaged during CXCL12-stimulated macropinocytosis, and ratio images (YFP/CFP) were processed. The numbers at the top right in each frame indicate time following addition of CXCL12 (seconds). Red and white arrowheads indicate macropinocytic cups and corresponding YFP-Akt-PH signal, respectively. YFP-Akt-PH localized at lamellipodia and membrane ruffles (t = +0 to t = +80) then accumulated in macropinocytic cups (t = +120 to t = +220 s). Color bar indicates relative value of ratio intensities. Original scale bars, 3 μm. (B) Immunofluorescent staining of pAkt (Thr308) and Akt demonstrates that Akt was phosphorylated at the cup structure (arrowheads indicate macropinocytic cup) in a cell fixed 1 min after addition of CXCL12. Comparison of the phase-contrast image (phase) and the ratio image (pAkt/Akt) displays a strong ratio value at the macropinocytic cup. Color bar indicates relative value of ratio intensities. Original scale bar, 5 μm.
To localize sites of pAkt directly, we used quantitative immunofluorescence microscopy to localize Akt and pAkt (Thr308). In control experiments, we analyzed the intensities of pAkt and Akt labeling in unstimulated cells versus CXCL12-treated macrophages (Supplemental Fig. 4). The relative intensities of pAkt to Akt signaling in the CXCL12-stimulated samples increased 6-fold relative to the negative control samples, consistent with the Western blot data showing CXCL12-induced pAkt (Supplemental Fig. 4). Comparison of the ratio and phase-contrast images allowed us to localize sites of pAkt. The relative intensities of pAkt to Akt were highest in membrane ruffles or macropinocytic cups (Fig. 8B; phase and pAkt/Akt). Comparison of phase-contrast and pAkt images also showed strong pAkt signaling in cups (Fig. 8B; phase and pAkt). The results were consistent with the ratiometric imaging of Akt-PH in live BMM. Therefore, Akt is recruited to and phosphorylated at the cup structures within 3 min of CXCL12 treatment.
DISCUSSION
With the analysis of the role of macropinocytosis in signaling by CXCL12, this study identified a novel role for macropinocytic cups in the activation of Akt and mTORC1. Previous studies determined that 2 pathways are required to activate mTORC1 in response to growth factors: a vesicular pathway mediated by macropinocytosis and a macropinocytosis-independent cytosolic pathway comprised of Akt, TSC1/2, and Rheb [7]. The present study shows that activation of mTORC1 by CXCL12 also requires macropinocytosis but that the cytosolic pathway is not independent of macropinocytosis. pAkt and pTSC2 require formation of ruffles and macropinocytic cups. This identifies a second essential role for MPs in signal transduction.
CXCL12 and M-CSF used similar signaling mechanisms for MP formation and signaling to mTORC1 in BMM. Like M-CSF, CXCL12 induced membrane ruffles within 1 min, and ruffles closed to form MPs within the next 4 min (Fig. 1). Class I PI3Ks and PKCs were necessary for MP formation (Figs. 2 and 7). Additionally, fluorescent live-cell imaging and immunofluorescent staining of cells stimulated by CXCL12 showed that Akt was recruited to and phosphorylated at membrane ruffles and macropinocytic cups (Fig. 8). However, unlike signaling to mTORC1 by M-CSF, CXCL12-induced pAkt was inhibited by the macropinocytosis-specific inhibitors EIPA and J/B (Fig. 6). Thus, MP formation and signaling to mTORC1 were identical in response to M-CSF and CXCL12, except that pAkt in response to CXCL12 was sensitive to EIPA and JB.
How might pAkt, in response to M-CSF and CXCL12, be differentially dependent on macropinocytosis? We suggest that the difference is a result of the different magnitudes of signals generated by the 2 ligands. Our previous studies of M-CSF-stimulated BMM showed that pAkt and pTSC2 were not blocked by the macropinocytosis inhibitor EIPA or by J/B [7]. In this study, we show that a lower concentration of M-CSF (0.14 nM) was sufficient to induce macropinocytosis and pAkt in BMM and that both of these activities were blocked by EIPA (Supplemental Fig. 3B), similar to what was observed in CXCL12-stimulated BMM. Interestingly, high concentrations of M-CSF (5 min, 6.9 nM) induced a stronger pAkt response than did CXCL12 (Supplemental Fig. 3A). With the increase of CXCL12 concentrations from 50 to 200 nM, concentrations well above the KD (dissociation constant) for CXCL12 binding to CXCR4 (2 nM) [42] did not increase the level of pAkt, and pAkt, in response to 50 and 200 nM CXCL12, was similarly attenuated by EIPA (Supplemental Fig. 3A). Thus, we propose that high M-CSF concentrations can induce actin-independent pAkt, whereas lower concentrations of M-CSF (0.14 nM) and CXCL12 elicit weak responses that require the cup structure for signal amplification and pAkt. The PKC inhibitor experiments support this idea. Whereas calphostin C and Gö6976 arrested macropinocytosis at the stage of macropinocytic cup closure, cup structures were entirely absent in staurosporine-treated cells (Fig. 7A). Western blot analysis showed that calphostin C and Gö6976 did not inhibit CXCL12-induced pAkt, yet staurosporine did (Fig. 7B–D). Thus, pAkt correlated with the ability to form macropinocytic cups and indicated that morphologic changes in the plasma membrane are required for signal amplification leading to pAkt.
Given that both M-CSF and CXCL12 regulate macropinocytosis to activate mTORC1, these 2 ligands may induce identical physiologic responses in the macrophage. CXCL12 and its receptor CXCR4 are overexpressed in many types of cancer [43–45]. Both M-CSF and CXCL12 elicit functions of the macrophage that promote breast cancer metastasis [46–49]. Macrophages act as tumor suppressors in a cancer-initiated inflammatory response. However, once tumors are established, macrophage function switches to tumor promotion (TAMs) [48, 49]. TAMs promote the migration and invasion of breast cancer cells via a paracrine loop between the EGF, secreted from TAMs, and M-CSF, secreted from tumor cells [50, 51]. EGF stimulation increases the invasive capability and motility of cancer cells [52]. M-CSF stimulation supports the migration of TAMs and the secretion of EGF via Wiskott-Aldrich syndrome protein [52]. It has been suggested that among M-CSF-stimulated macrophages in a progressing tumor, increased levels of CXCL12 may increase EGF secretion [46–48]. Thus, as CXCL12 can enhance effects of M-CSF in TAMs, we suggest that their common mechanism of signaling to mTORC1 via macropinocytosis may underlie that enhancement.
In summary, CXCL12-induced mTORC1 activation is regulated by macropinocytosis via 2 mechanisms (Fig. 9). First, as in the case of M-CSF, amino acid trafficking to lysosomes by macropinocytosis is required for mTORC1 activation. Second, macropinocytic cups serve as platforms for pAkt. This cup dependence of pAkt is likely a result of the low level of stimulation by CXCL12 compared with M-CSF.
Figure 9. Proposed model of CXCL12 signaling to mTORC1 in BMM.
CXCL12 activates Rac1 and class I PI3Ks in BMM, presumably via CXCR4. Rac1 stimulates membrane ruffling and macropinocytic cup formation. Class I PI3Ks also regulate MP formation and generate PIP3 and/or PI(3,4)P2 in the cup (green). Akt is then recruited to the cup structure and phosphorylated. pAkt induces pTSC2 (deactivation of TSC2). PKC function is required for cup closure. Given that PKC is regulated by DAG (blue), which is generated by PLCγ, the PLCγ/DAG pathway likely acts upstream of PKC in MP formation. Whereas the Akt/TSC pathway activates Rheb, the macropinocytic pathway conveys extracellular nutrients to the lysosome to activate Rag. Thus, these 2 pathways coordinately activate mTORC1. EIPA blocks macropinocytosis by inhibiting Rac1 function. J/B block membrane ruffling, as well as macropinocytosis. Staurosporine (Stauro), calphostin C (CalC), and Gö6976 (Go) all block MP closure by inhibiting PKC function. MK2206 (MK) inhibits Akt function but not macropinocytosis. p110 isoform-specific inhibitors block cup formation and cup closure, resulting in the attenuation of mTORC1 activity.
AUTHORSHIP
R.P. performed microscopy and biochemical assays, analyzed the data, and wrote the manuscript. I.G. supported live-cell observation. J.A.S. initiated the project. S.Y. designed the experiments, performed biochemical assays and live-cell observations, and analyzed the data. J.A.S., R.P., and S.Y. wrote the final version of the paper.
Supplementary Material
ACKNOWLEDGMENTS
This work was funded by U.S. National Institutes of Health Grant GM-110215 (to J.A.S.). The authors thank the members of the Swanson lab for assistance.
Glossary
- 4EBP1
4E-binding protein 1
- BMM
bone marrow-derived macrophage
- CFP
cyan fluorescent protein
- DAG
diacylglycerol
- DPBS
Dulbecco’s phosphate-buffered saline
- EGF
epidermal growth factor
- EIPA
5-(N-ethyl-N-isopropyl) amiloride
- J/B
jasplakinolide and blebbistatin
- MP
macropinosome
- mTORC1
mechanistic target of rapamycin complex 1
- p
phosphorylation
- PDK
phosphoinositide-dependent kinase
- PH
pleckstrin homology
- PI(3,4)P2
phosphatidylinositol (3,4)-bisphosphate
- PIP3
phosphatidylinositol (3,4,5)-trisphosphate
- PKC
protein kinase C
- PLC
phospholipase C
- TAM
tumor-associated macrophage
- TSC
tuberous sclerosis complex
- YFP
yellow fluorescent protein
Footnotes
The online version of this paper, found at www.jleukbio.org, includes supplemental information.
DISCLOSURES
The authors declare no conflicts of interest.
REFERENCES
- 1.Lewis W. H. (1931) Pinocytosis. Bull. Johns Hopkins Hosp. Bull. 49, 17–27. [Google Scholar]
- 2.Liu Z., Roche P. A. (2015) Macropinocytosis in phagocytes: regulation of MHC class-II-restricted antigen presentation in dendritic cells. Front. Physiol. 6, 1. [DOI] [PMC free article] [PubMed] [Google Scholar]
- 3.Mercer J., Greber U. F. (2013) Virus interactions with endocytic pathways in macrophages and dendritic cells. Trends Microbiol. 21, 380–388. [DOI] [PubMed] [Google Scholar]
- 4.Kerr M. C., Teasdale R. D. (2009) Defining macropinocytosis. Traffic 10, 364–371. [DOI] [PubMed] [Google Scholar]
- 5.Commisso C., Davidson S. M., Soydaner-Azeloglu R. G., Parker S. J., Kamphorst J. J., Hackett S., Grabocka E., Nofal M., Drebin J. A., Thompson C. B., Rabinowitz J. D., Metallo C. M., Vander Heiden M. G., Bar-Sagi D. (2013) Macropinocytosis of protein is an amino acid supply route in Ras-transformed cells. Nature 497, 633–637. [DOI] [PMC free article] [PubMed] [Google Scholar]
- 6.Palm W., Park Y., Wright K., Pavlova N. N., Tuveson D. A., Thompson C. B. (2015) The utilization of extracellular proteins as nutrients is suppressed by mTORC1. Cell 162, 259–270. [DOI] [PMC free article] [PubMed] [Google Scholar]
- 7.Yoshida S., Pacitto R., Yao Y., Inoki K., Swanson J. A. (2015) Growth factor signaling to mTORC1 by amino acid-laden macropinosomes. J. Cell Biol. 211, 159–172. [DOI] [PMC free article] [PubMed] [Google Scholar]
- 8.Maltese W. A., Overmeyer J. H. (2015) Non-apoptotic cell death associated with perturbations of macropinocytosis. Front. Physiol. 6, 38. [DOI] [PMC free article] [PubMed] [Google Scholar]
- 9.Swanson J. A. (2008) Shaping cups into phagosomes and macropinosomes. Nat. Rev. Mol. Cell Biol. 9, 639–649. [DOI] [PMC free article] [PubMed] [Google Scholar]
- 10.Yoshida S., Hoppe A. D., Araki N., Swanson J. A. (2009) Sequential signaling in plasma-membrane domains during macropinosome formation in macrophages. J. Cell Sci. 122, 3250–3261. [DOI] [PMC free article] [PubMed] [Google Scholar]
- 11.Yoshida S., Gaeta I., Pacitto R., Krienke L., Alge O., Gregorka B., Swanson J. A. (2015) Differential signaling during macropinocytosis in response to M-CSF and PMA in macrophages. Front. Physiol. 6, 8. [DOI] [PMC free article] [PubMed] [Google Scholar]
- 12.Racoosin E. L., Swanson J. A. (1993) Macropinosome maturation and fusion with tubular lysosomes in macrophages. J. Cell Biol. 121, 1011–1020. [DOI] [PMC free article] [PubMed] [Google Scholar]
- 13.Laplante M., Sabatini D. M. (2012) mTOR signaling in growth control and disease. Cell 149, 274–293. [DOI] [PMC free article] [PubMed] [Google Scholar]
- 14.Shimobayashi M., Hall M. N. (2014) Making new contacts: the mTOR network in metabolism and signalling crosstalk. Nat. Rev. Mol. Cell Biol. 15, 155–162. [DOI] [PubMed] [Google Scholar]
- 15.Bar-Peled L., Sabatini D. M. (2014) Regulation of mTORC1 by amino acids. Trends Cell Biol. 24, 400–406. [DOI] [PMC free article] [PubMed] [Google Scholar]
- 16.Jewell J. L., Guan K. L. (2013) Nutrient signaling to mTOR and cell growth. Trends Biochem. Sci. 38, 233–242. [DOI] [PMC free article] [PubMed] [Google Scholar]
- 17.Döring Y., Pawig L., Weber C., Noels H. (2014) The CXCL12/CXCR4 chemokine ligand/receptor axis in cardiovascular disease. Front. Physiol. 5, 212. [DOI] [PMC free article] [PubMed] [Google Scholar]
- 18.Cepeda E. B., Dediulia T., Fernando J., Bertran E., Egea G., Navarro E., Fabregat I. (2015) Mechanisms regulating cell membrane localization of the chemokine receptor CXCR4 in human hepatocarcinoma cells. Biochim. Biophys. Acta 1853, 1205–1218. [DOI] [PubMed] [Google Scholar]
- 19.Lou J., Low-Nam S. T., Kerkvliet J. G., Hoppe A. D. (2014) Delivery of CSF-1R to the lumen of macropinosomes promotes its destruction in macrophages. J. Cell Sci. 127, 5228–5239. [DOI] [PMC free article] [PubMed] [Google Scholar]
- 20.Nakase I., Kobayashi N. B., Takatani-Nakase T., Yoshida T. (2015) Active macropinocytosis induction by stimulation of epidermal growth factor receptor and oncogenic Ras expression potentiates cellular uptake efficacy of exosomes. Sci. Rep. 5, 10300. [DOI] [PMC free article] [PubMed] [Google Scholar]
- 21.Tanaka G., Nakase I., Fukuda Y., Masuda R., Oishi S., Shimura K., Kawaguchi Y., Takatani-Nakase T., Langel U., Gräslund A., Okawa K., Matsuoka M., Fujii N., Hatanaka Y., Futaki S. (2012) CXCR4 stimulates macropinocytosis: implications for cellular uptake of arginine-rich cell-penetrating peptides and HIV. Chem. Biol. 19, 1437–1446. [DOI] [PubMed] [Google Scholar]
- 22.Chen G., Chen S. M., Wang X., Ding X. F., Ding J., Meng L. H. (2012) Inhibition of chemokine (CXC motif) ligand 12/chemokine (CXC motif) receptor 4 axis (CXCL12/CXCR4)-mediated cell migration by targeting mammalian target of rapamycin (mTOR) pathway in human gastric carcinoma cells. J. Biol. Chem. 287, 12132–12141. [DOI] [PMC free article] [PubMed] [Google Scholar]
- 23.Saudemont A., Garçon F., Yadi H., Roche-Molina M., Kim N., Segonds-Pichon A., Martín-Fontecha A., Okkenhaug K., Colucci F. (2009) p110gamma and p110delta isoforms of phosphoinositide 3-kinase differentially regulate natural killer cell migration in health and disease. Proc. Natl. Acad. Sci. USA 106, 5795–5800. [DOI] [PMC free article] [PubMed] [Google Scholar]
- 24.Bruns R. F., Miller F. D., Merriman R. L., Howbert J. J., Heath W. F., Kobayashi E., Takahashi I., Tamaoki T., Nakano H. (1991) Inhibition of protein kinase C by calphostin C is light-dependent. Biochem. Biophys. Res. Commun. 176, 288–293. [DOI] [PubMed] [Google Scholar]
- 25.Jethwa N., Chung G. H., Lete M. G., Alonso A., Byrne R. D., Calleja V., Larijani B. (2015) Endomembrane PtdIns(3,4,5)P3 activates the PI3K-Akt pathway. J. Cell Sci. 128, 3456–3465. [DOI] [PubMed] [Google Scholar]
- 26.Hoppe A. D. (2012) FRET-based imaging of Rac and Cdc42 activation during Fc-receptor-mediated phagocytosis in macrophages. Methods Mol. Biol. 827, 235–251. [DOI] [PubMed] [Google Scholar]
- 27.Hawkins P. T., Anderson K. E., Davidson K., Stephens L. R. (2006) Signalling through class I PI3Ks in mammalian cells. Biochem. Soc. Trans. 34, 647–662. [DOI] [PubMed] [Google Scholar]
- 28.Delgado-Martín C., Escribano C., Pablos J. L., Riol-Blanco L., Rodríguez-Fernández J. L. (2011) Chemokine CXCL12 uses CXCR4 and a signaling core formed by bifunctional Akt, extracellular signal-regulated kinase (ERK)1/2, and mammalian target of rapamycin complex 1 (mTORC1) proteins to control chemotaxis and survival simultaneously in mature dendritic cells. J. Biol. Chem. 286, 37222–37236. [DOI] [PMC free article] [PubMed] [Google Scholar]
- 29.Ieranò C., Santagata S., Napolitano M., Guardia F., Grimaldi A., Antignani E., Botti G., Consales C., Riccio A., Nanayakkara M., Barone M. V., Caraglia M., Scala S. (2014) CXCR4 and CXCR7 transduce through mTOR in human renal cancer cells. Cell Death Dis. 5, e1310. [DOI] [PMC free article] [PubMed] [Google Scholar]
- 30.Tan C. T., Chu C. Y., Lu Y. C., Chang C. C., Lin B. R., Wu H. H., Liu H. L., Cha S. T., Prakash E., Ko J. Y., Kuo M. L. (2008) CXCL12/CXCR4 promotes laryngeal and hypopharyngeal squamous cell carcinoma metastasis through MMP-13-dependent invasion via the ERK1/2/AP-1 pathway. Carcinogenesis 29, 1519–1527. [DOI] [PubMed] [Google Scholar]
- 31.McGinn O. J., Marinov G., Sawan S., Stern P. L. (2012) CXCL12 receptor preference, signal transduction, biological response and the expression of 5T4 oncofoetal glycoprotein. J. Cell Sci. 125, 5467–5478. [DOI] [PubMed] [Google Scholar]
- 32.Hirai H., Sootome H., Nakatsuru Y., Miyama K., Taguchi S., Tsujioka K., Ueno Y., Hatch H., Majumder P. K., Pan B. S., Kotani H. (2010) MK-2206, an allosteric Akt inhibitor, enhances antitumor efficacy by standard chemotherapeutic agents or molecular targeted drugs in vitro and in vivo. Mol. Cancer Ther. 9, 1956–1967. [DOI] [PubMed] [Google Scholar]
- 33.Koivusalo M., Welch C., Hayashi H., Scott C. C., Kim M., Alexander T., Touret N., Hahn K. M., Grinstein S. (2010) Amiloride inhibits macropinocytosis by lowering submembranous pH and preventing Rac1 and Cdc42 signaling. J. Cell Biol. 188, 547–563. [DOI] [PMC free article] [PubMed] [Google Scholar]
- 34.Swanson J. A., Watts C. (1995) Macropinocytosis. Trends Cell Biol. 5, 424–428. [DOI] [PubMed] [Google Scholar]
- 35.Nanbo A., Imai M., Watanabe S., Noda T., Takahashi K., Neumann G., Halfmann P., Kawaoka Y. (2010) Ebolavirus is internalized into host cells via macropinocytosis in a viral glycoprotein-dependent manner. PLoS Pathog. 6, e1001121. [DOI] [PMC free article] [PubMed] [Google Scholar]
- 36.Liberali P., Kakkonen E., Turacchio G., Valente C., Spaar A., Perinetti G., Böckmann R. A., Corda D., Colanzi A., Marjomaki V., Luini A. (2008) The closure of Pak1-dependent macropinosomes requires the phosphorylation of CtBP1/BARS. EMBO J. 27, 970–981. [DOI] [PMC free article] [PubMed] [Google Scholar]
- 37.Martiny-Baron G., Kazanietz M. G., Mischak H., Blumberg P. M., Kochs G., Hug H., Marmé D., Schächtele C. (1993) Selective inhibition of protein kinase C isozymes by the indolocarbazole Gö 6976. J. Biol. Chem. 268, 9194–9197. [PubMed] [Google Scholar]
- 38.Vanhaesebroeck B., Alessi D. R. (2000) The PI3K-PDK1 connection: more than just a road to PKB. Biochem. J. 346, 561–576. [PMC free article] [PubMed] [Google Scholar]
- 39.Vivanco I., Sawyers C. L. (2002) The phosphatidylinositol 3-kinase AKT pathway in human cancer. Nat. Rev. Cancer 2, 489–501. [DOI] [PubMed] [Google Scholar]
- 40.Rupper A., Lee K., Knecht D., Cardelli J. (2001) Sequential activities of phosphoinositide 3-kinase, PKB/Aakt, and Rab7 during macropinosome formation in Dictyostelium. Mol. Biol. Cell 12, 2813–2824. [DOI] [PMC free article] [PubMed] [Google Scholar]
- 41.Araki N., Egami Y., Watanabe Y., Hatae T. (2007) Phosphoinositide metabolism during membrane ruffling and macropinosome formation in EGF-stimulated A431 cells. Exp. Cell Res. 313, 1496–1507. [DOI] [PubMed] [Google Scholar]
- 42.Hanes M. S., Salanga C. L., Chowdry A. B., Comerford I., McColl S. R., Kufareva I., Handel T. M. (2015) Dual targeting of the chemokine receptors CXCR4 and ACKR3 with novel engineered chemokines. J. Biol. Chem. 290, 22385–22397. [DOI] [PMC free article] [PubMed] [Google Scholar]
- 43.Chatterjee S., Behnam Azad B., Nimmagadda S. (2014) The intricate role of CXCR4 in cancer. Adv. Cancer Res. 124, 31–82. [DOI] [PMC free article] [PubMed] [Google Scholar]
- 44.Xu C., Zhao H., Chen H., Yao Q. (2015) CXCR4 in breast cancer: oncogenic role and therapeutic targeting. Drug Des. Devel. Ther. 9, 4953–4964. [DOI] [PMC free article] [PubMed] [Google Scholar]
- 45.Guo F., Wang Y., Liu J., Mok S. C., Xue F., Zhang W. (2016) CXCL12/CXCR4: a symbiotic bridge linking cancer cells and their stromal neighbors in oncogenic communication networks. Oncogene 35, 816–826. [DOI] [PubMed] [Google Scholar]
- 46.Hernandez L., Smirnova T., Kedrin D., Wyckoff J., Zhu L., Stanley E. R., Cox D., Muller W. J., Pollard J. W., Van Rooijen N., Segall J. E. (2009) The EGF/CSF-1 paracrine invasion loop can be triggered by heregulin beta1 and CXCL12. Cancer Res. 69, 3221–3227. [DOI] [PMC free article] [PubMed] [Google Scholar]
- 47.Boimel P. J., Smirnova T., Zhou Z. N., Wyckoff J., Park H., Coniglio S. J., Qian B. Z., Stanley E. R., Cox D., Pollard J. W., Muller W. J., Condeelis J., Segall J. E. (2012) Contribution of CXCL12 secretion to invasion of breast cancer cells. Breast Cancer Res. 14, R23. [DOI] [PMC free article] [PubMed] [Google Scholar]
- 48.Quail D. F., Joyce J. A. (2013) Microenvironmental regulation of tumor progression and metastasis. Nat. Med. 19, 1423–1437. [DOI] [PMC free article] [PubMed] [Google Scholar]
- 49.Noy R., Pollard J. W. (2014) Tumor-associated macrophages: from mechanisms to therapy. Immunity 41, 49–61. [DOI] [PMC free article] [PubMed] [Google Scholar]
- 50.Wyckoff J., Wang W., Lin E. Y., Wang Y., Pixley F., Stanley E. R., Graf T., Pollard J. W., Segall J., Condeelis J. (2004) A paracrine loop between tumor cells and macrophages is required for tumor cell migration in mammary tumors. Cancer Res. 64, 7022–7029. [DOI] [PubMed] [Google Scholar]
- 51.Goswami S., Sahai E., Wyckoff J. B., Cammer M., Cox D., Pixley F. J., Stanley E. R., Segall J. E., Condeelis J. S. (2005) Macrophages promote the invasion of breast carcinoma cells via a colony-stimulating factor-1/epidermal growth factor paracrine loop. Cancer Res. 65, 5278–5283. [DOI] [PubMed] [Google Scholar]
- 52.Ishihara D., Dovas A., Hernandez L., Pozzuto M., Wyckoff J., Segall J. E., Condeelis J. S., Bresnick A. R., Cox D. (2013) Wiskott-Aldrich syndrome protein regulates leukocyte-dependent breast cancer metastasis. Cell Reports 4, 429–436. [DOI] [PMC free article] [PubMed] [Google Scholar]
Associated Data
This section collects any data citations, data availability statements, or supplementary materials included in this article.


