Abstract
In order to study the molecular mechanisms of green tea polyphenols (GTPs) in treatment or prevention of breast cancer, the cytotoxic effects of GTPs on five human cell lines (MCF-7, A549, Hela, PC3, and HepG2 cells) were determined and the antitumor mechanisms of GTPs in MCF-7 cells were analyzed. The results showed that GTPs exhibited a broad spectrum of inhibition against the detected cancer cell lines, particularly the MCF-7 cells. Studies on the mechanisms revealed that the main modes of cell death induced by GTPs were cell cycle arrest and mitochondrial-mediated apoptosis. Flow cytometric analysis showed that GTPs mediated cell cycle arrest at both G1/M and G2/M transitions. GTP dose dependently led to apoptosis of MCF-7 cells via the mitochondrial pathways, as evidenced by induction of chromatin condensation, reduction of mitochondrial membrane potential (ΔΨ m), improvement in the generation of reactive oxygen species (ROS), induction of DNA fragmentation, and activations of caspase-3 and caspase-9 in the present paper.
Keywords: Green tea polyphenol (GTP), Breast cancer, MCF-7 cells, Mitochondrial-mediated apoptosis, Cell death, Cell cycle arrest
1. Introduction
In recent years, cancer (malignant tumor) has become one of the leading causes of death worldwide, accounting for 8.2 million deaths or 14.6% of all human deaths in 2012, according to the World Health Organization (WHO)’s World Cancer Report 2014 (Stewart and Wild, 2014), and greatly threatens human life and health. At present, there are over 100 different known cancers, among which breast cancer is the fifth most common cause of death due to cancer (458 000 deaths) and is the most frequent cause of death due to cancer in women in both developing and developed regions, accounting for 22.9% of all cancers in women (Boyle and Levin, 2008; Ferlay et al., 2010; Liu et al., 2015). There is no permanent treatment for cancer. Many treatment options for cancer exist, the primary ones including surgery, chemotherapy, radiation therapy, and palliative care (Hortobagyi et al., 1988; Jiang, 2014). However, most of them have doubtful efficacy, safety risks, and other serious adverse effects. Because of this, cancer prevention has become an important approach to decreasing the risk of cancer in addition to cancer therapy. Among the commonly used cancer prevention strategies, chemoprevention is considered a valid approach to reduce the incidence of cancer (Hail et al., 2008).
It is widely accepted that targeting apoptosis pathways in premalignant and malignant cells is an effective strategy for cancer prevention and treatment. Apoptosis, or programmed cell death, is a genetically regulated and organized cell death process, which plays an important role in the development and homeostasis of multicellular organisms (Pan et al., 1998; Zhang et al., 2007). Apoptosis can be induced by both external and internal stimuli such as radiation, hypoxia, viral infection, and cytotoxic agents (Cotran et al., 1999). These different apoptotic stimuli may lead to the activations of intrinsic (mitochondrial pathway) and extrinsic pathways (death receptor pathway), which are the two major pathways of apoptosis. Cell death by apoptosis can be characterized by a number of well-defined processes including a decrease in cell volume, cellular morphological change, condensation and fragmentation of nuclear chromatin, membrane blebbing, internucleosomal DNA cleavage, and activation of cysteine-aspartic proteases (caspases) (Strasser et al., 2000).
As a putative cancer chemotherapeutic agent derived from dietary constituents, GTPs have been suggested to play a significant role in the resistance of a variety of cancers including liver, breast, prostate, lung, and skin by numerous studies of cell cultures and animal models (Luo et al., 2006; Thangapazham et al., 2007; Lu et al., 2008; Pandey et al., 2010). GTPs are the major active component group of green tea, accounting for 30%‒42% of the dry weight of the solids in brewed green tea, and are mainly composed of catechins (Khan and Mukhtar, 2007). Possible mechanisms of preventing cancer using GTPs include prevention of oxidative stress, prevention of DNA damage, and modulation of carcinogen metabolism (Yang et al., 2009). Although there have been studies on the antitumor effects of GTPs against breast cancer (Pianetti et al., 2002; Thangapazham et al., 2007), the underlying molecular mechanisms for preventing breast cancer with GTPs still remain elusive; further investigation should be carried out to help to further understand the effect of GTPs on human carcinogenesis.
In this study, the antitumor effects of GTPs against five human cancer cell lines (liver cancer HepG2 cells, lung cancer A549 cells, cervical cancer Hela cells, prostate cancer PC3 cells, and breast cancer MCF-7 cells) were evaluated; and as the central objective of this research, the most sensitive cancer cell (MCF-7) was used as the test model to further study the in vitro molecular mechanisms of GTPs in treatment or prevention of breast cancer. To achieve this objective, potential mechanisms of apoptosis induced by GTP were studied by cytotoxicity assay, flow cytometry, Hoechst 33258 staining, JC-1 mitochondrial membrane potential staining, reactive oxygen species (ROS) staining, DNA ladder assay, and Western blot assay.
2. Materials and methods
2.1. Materials
GTPs were self-made with 97.6% purity according to the method of Liang et al. (1999) with some modifications. Briefly, green tea leaves (30 g) were extracted three times with 300 ml of hot water (80 °C) under stirring for 20 min each time. After filtration, the tea liquid was concentrated in a rotary evaporator to about 30%–40% soluble solid content. Chloroform was added to the concentrated liquid in a ratio of 1:1 (v/v) to remove caffeine, lipids, chlorophyll, etc. The aqueous phase was mixed with ethyl acetate at a ratio of 1:1 (v/v) to extract tea polyphenols. The ethyl acetate phase was then freeze-dried to obtain crude tea polyphenols. The crude tea polyphenols were diluted with water to 10 mg/ml. Then 20 g of AB-8 macroporous adsorption resin was added to 200 ml of the crude tea polyphenols for isolation, and the mixture was shaken for 4 h at room temperature in the dark. After that, pump filtration was performed and the solid phase was mixed with 200 ml of 80% ethanol and stirred for 2 h. Then the solution was collected by pump filtration and was extracted with ethyl acetate at a ratio of 1:1 (v/v). Finally, the ethyl acetate phase was isolated and freeze-dried to obtain tea polyphenol powder. Total tea polyphenols were determined according to the method from BS ISO 14502-1:2005 (British Standards Institution, 2005). Catechin monomers were determined using high performance liquid chromatography (HPLC) apparatus (Dionex, Sunnyvale, CA, USA) equipped with a Venusil MP-C18 column (5 µm, 250 mm×4.6 mm i.d., Agela Technologies Inc., Newark, DE, USA) and an ultraviolet (UV) detector at 280 nm. The content (mass fraction) of total catechins was about 79.70% (therein, epigallocatechin gallate (EGCG) was 45.30%, epigallocatechin (EGC) 9.50%, epicatechin (EC) 6.68%, and epicatechin gallate (ECG) 12.90%). Dulbecco’s modified Eagle’s medium (DMEM) and 1×phosphate-buffered saline (PBS, pH 7.4) were purchased from Gibco Life Technologies (Grand Island, NY, USA). Heat-inactivated fetal bovine serum (FBS) was obtained from Sijiqing Company Ltd. (Hangzhou, China). Also, 2',7'-dichlorofluorescein diacetate (DCFH-DA), a mitochondrial membrane potential assay kit with 5,5',6,6'-tetrachloro-1,1',3,3'-tetraethylbenzimidazolo-carbocyanine iodide (JC-1), an apoptotic cell Hoechst 33258 detection kit, and penicillin-streptomycin solution (100×) were obtained from Beyotime Institute of Biotechnology (Nanjing, China). 3-(4,5-Dimethylthiazol-2-yl)-2,5-diphenyltetrazolium bromide (MTT), dimethyl sulfoxide (DMSO), propidium iodide (PI), and β-actin were purchased from Sigma Company (St. Louis, MO, USA). A bicinchoninic acid (BCA) assay kit was obtained from Nanjing Jiancheng Institute of Biotechnology (Nanjing, China), and an apoptosis DNA ladder detection kit was purchased from KeyGen Biotech. Co. Ltd. (Nanjing, China). Capase-3 antibody, caspase-9 antibody, and goat anti-rabbit IgG were obtained from Cell Signaling Technology (Beverly, MA, USA). A polyvinylidene fluoride (PVDF) membrane was purchased from Millipore (Bedford, MA, USA).
2.2. Cell lines and cell culture
The human cancer cell lines used in this study, including liver cancer HepG2 cells, lung cancer A549 cells, cervical cancer Hela cells, prostate cancer PC3 cells, and breast cancer MCF-7 cells, were all purchased from the Cancer Institute of Sun Yat-Sen University (Guangzhou, China) and were cultured in DMEM supplemented with 10% (v/v) FBS and 1% (0.01 g/ml) penicillin-streptomycin solution at 37 °C in a humidified incubator under 5% CO2 atmosphere.
2.3. Determination of cell viability by MTT assay
The effect of GTPs on cell viability of the preserved cells was determined using MTT assay described by González et al. (2013) with some modifications. Briefly, the cancer cells were seeded in 96-well plates at a density of 5×10³ per well and incubated at 37 °C for 24 h. Then the supernatant was removed and the cells were treated for 24 h with medium or GTPs at different concentrations (100, 200, 300, 400, and 500 μg/ml). After that, 20 μl of MTT dissolved in PBS (5 mg/ml) was added to each well, and the cells were further incubated for 4 h. Finally, the medium containing MTT was removed and 100 μl of DMSO was added to each well. The plate was gently shaken for 10 min to dissolve the formazan crystals and the absorbance was measured at 570 nm on a Fluoroskan Ascent Microplate Fluorometer (Thermo Electron Corporation, Vantaa, Finland). The percentage viability was calculated using the following formula: percentage viability of the treated cells (%)=100%‒(mean optical density (OD) of individual teat group)/(mean OD of control group)×100%. The concentration values of GTPs needed to inhibit cell growth by 50% (IC50) were calculated from the dose-response curves for each cell line.
2.4. Treatment of MCF-7 cells with GTPs and collection of treated cells
To determine cell cycles, ROS, and mitochondrial membrane potential (ΔΨ m), and to access morphologic changes in MCF-7 cells untreated and treated with GTPs, cells were seeded in 6-well plates at a density of 2×10⁵ per well and cultured with medium or GTPs at different concentrations (200, 300, and 400 μg/ml) for 24 h. After incubation, the culture medium was collected into 5 ml polyethylene tubes and the cells were harvested into the corresponding tubes using 0.25% (2.5 g/L) trypsin. The tubes were then centrifuged at 250g for 5 min. After centrifuging, the supernatant was removed and the cells were resuspended in 1 ml of PBS. For further analysis, the cells were collected by centrifuging at 250g for 5 min.
2.5. Determination of cell cycles
The collected cells were fixed with 70% ethanol for 24 h. After that, the cells were centrifuged and stained with 50 μl RNase and 450 μl PI for 30 min in the dark at room temperature and then were analyzed using a FACSVerse flow cytometer (BD Biosciences, Franklin Lakes, NJ, USA).
2.6. Monitoring of apoptosis cells by Hoechst 33258 staining
For apoptosis studies, the collected cells were fixed with 4% formaldehyde in PBS for 10 min at 4 °C and then were washed twice with PBS and stained with 25 μl Hoechst 33258 for 10 min at room temperature in the dark. After this, the cells were washed once with distilled water and resuspended with 25 μl PBS. Finally, the cells were dropped onto a slide and dried at room temperature. Morphological changes of nuclei were observed under a Leica DMI4000B fluorescence microscope (Leica, Heerbrugg, Switzerland) equipped with a Leica DFC450C camera.
2.7. Mitochondrial membrane potential measurement
ΔΨ m was assayed using a JC-1 mitochondrial potential sensor, according to the manufacturer’s directions. Briefly, the collected cells were incubated with JC-1 for 20 min at 37 °C in the dark. After incubation, the cells were washed twice with PBS to remove the dye and then resuspended with PBS. The fluorescences of both JC-1 monomers and dimmers were collected at 530 nm emission and 490 nm excitation for green fluorescence (monomers) and 590 nm emission and 525 nm excitation for red fluorescence (aggregates). Levels of ΔΨ m were quantified using Fluoroskan Ascent Microplate Fluorometer and the results were expressed as the red/green fluorescence ratio. For qualitative analysis, the cells were imaged for red and green fluorescence using a microscope.
2.8. Measurement of intracellular ROS
Dichlorofluorescein (DCF) fluorescence was used to determine intracellular ROS generation based on the oxidation of DCFH-DA to a fluorescent DCF. The collected cells were suspended in DCFH-DA solution (10 μmol/L) and incubated for 25 min at 37 °C in the dark. After incubation, the cells were washed and resuspended with PBS. Intracellular ROS levels were monitored by measuring the fluorescence intensity of the cells by a Fluoroskan Ascent Microplate Fluorometer, with excitation and emission wavelengths of 485 and 525 nm, respectively. Qualitative analysis of ROS generation was carried out using a fluorescence microscope.
2.9. Gel electrophoresis and DNA fragmentation study
The genomic DNA in the collected cells was extracted according to the instructions in the apoptotic DNA ladder detection kit. Briefly, the collected MCF-7 cells were scraped and lysed at 37 °C for 1 h in lysis buffer (10 mmol/L Tris-HCl, 25 mmol/L ethylene diamine tetraacetic acid (EDTA), 1.0% sodium dodecyl sulfate (SDS), 20 μg/ml DNase-free RNase, pH 8.0). The cell lysates were then treated with 100 μg/ml proteinase K at 50 °C for 2 h. After that, 40 μl of the sample was mixed with 5 μl loading buffer and was resolved by electrophoresis in 1.5% agarose gel, running for about 4 h at 2–4 V/cm. Finally, the samples were visualized by UV light after staining in 0.5 μg/ml ethidium bromide.
2.10. Western blot analysis
Total cellular proteins were extracted by incubating the collected cells on ice for 10 min in RIPA buffer (150 mol/L NaCl, 50 mmol/L Tris-HCl, pH 8.0, 5 g/L sodium deoxycholate, 0.2 g/L sodium azide, 10 g/L Nonidet P-40, 2.0 μg/ml aprotinin, 1 mmol/L phenylmethylsulfonyl fluoride (PMSF)) and then they were centrifuged at 10 000g for 10 min at 4 °C. The supernatant was stored at −80 °C for use. Protein concentrations were determined by using a BCA assay kit. Equal amounts of the total proteins were loaded onto 15% separating gel with 4% stacking gel, and were electro-transferred onto a PVDF membrane. After electrophoresis, the transferred PVDF membranes were blocked with 5% (0.05 g/ml) nonfat milk in TBST buffer (20 mmol/L Tris-HCl (pH 8.0), 150 mol/L NaCl, 0.01% Tween 20) for 1 h at room temperature. Then, PVDF membranes were washed twice with TBST and probed overnight at 4 °C with primary antibodies (caspase-3 and caspase-9 1:1000 (v/v) dilution; β-actin 1:5000 (v/v) dilution) in 5% (0.05 g/ml) nonfat milk. After washing three times with TBST, the membranes were incubated with horseradish peroxidase-conjugated secondary antibody at 1:5000 (v/v) dilution in TBST for 1 h at room temperature, followed by washing with TBST three times. Peroxidase activity was visualized via enhanced chemiluminescence (Millipore, Bedford, MA, USA). Quantification of the protein with bands was performed using Image-pro plus 6.0 software, and β-actin was used to confirm the relative pixel density for each band.
2.11. Statistical analysis
All the assays were performed in triplicate. The data were expressed as mean±standard deviation (SD) and analyzed by SPSS software (Version 19.0, Chicago, USA). Values of P<0.05 were considered significant.
3. Results and discussion
3.1. Effect of GTPs on growth of cancer cells and apoptotic cell death
The antitumor activities of GTPs against MCF-7, A549, Hela, PC3, and HepG2 cells were investigated by MTT assay. As shown in Fig. 1, GTPs exhibited a broad spectrum of inhibition against the selected cancer cell lines in a dose-dependent manner. Among the treated cancer cell lines, MCF-7 cells showed the highest sensitivity to GTPs, followed by HepG2, Hela, PC3, and A549 cells based on the detected IC50 of GTPs as (291.9±18.0), (327.4±25.1), (330.5±16.8), (351.1±19.2), and (384.0±2.11) mg/ml, respectively. As the most sensitive cells to GTPs, MCF-7 cells were subsequently used as the test model to further study the in vitro molecular mechanisms of GTPs in the treatment or prevention of breast cancer in the present paper. To further determine the effect of GTPs on apoptotic cell death, the cellular nuclear morphology changes of MCF-7 cells exposed to GTPs were examined by Hoechst 33258 staining. As shown in Fig. 2, the characteristic chromatin condensation, nuclear fragmentation, and apoptotic bodies were clearly shown in GTP-treated cells, but cells without GTP treatment displayed excellent health characteristics with a large round nucleus and normal chromatin patterns. The results demonstrated that the growth inhibitory effect of GTPs is due in part to induction of apoptosis.
Fig. 1.
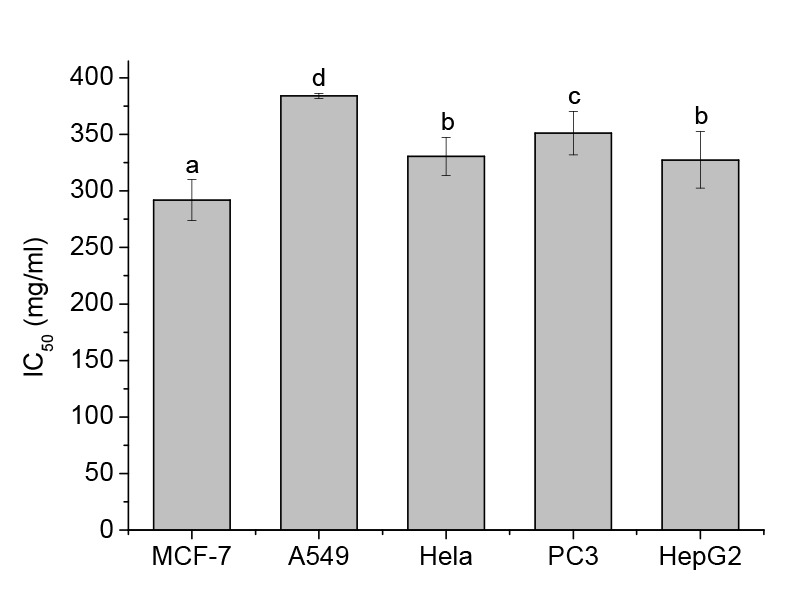
IC50 values of GTPs against the viabilities of different cells
MCF-7, A549, Hela, PC3, and HepG2 cells were treated for 24 h with medium or GTPs at different concentrations. Data are expressed as mean±SD, with n=3. Different letters above the columns indicate significant differences (P<0.05)
Fig. 2.
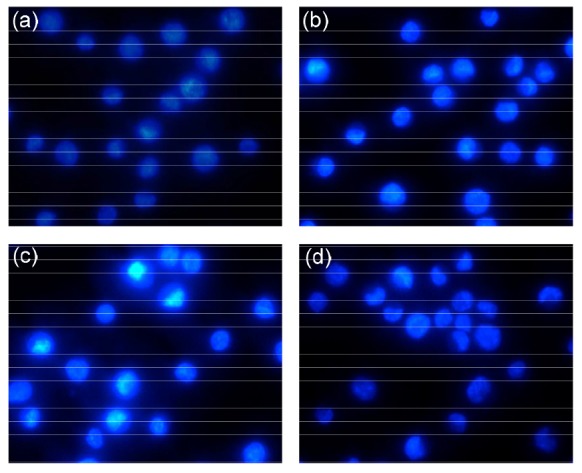
Fluorescent staining of nuclei in GTP-treated MCF-7 cells by Hoechst 33258
Cells were treated with 0 (a), 200 (b), 300 (c) and 400 μg/ml (d) of GTPs for 24 h. Original magnification: 400×
3.2. Effect of GTPs on cell cycle arrest
A cell cycle is a repeated round of cell duplication and growth. It is thought that the induction of cell cycle arrest and apoptosis was the main strategy of regulating cell proliferation (Rezaei et al., 2012). The eukaryotic cell cycle includes four distinct phases (G1, S, G2, and M). The G0 phase is a resting period in the cell cycle where cells exist in a distinct quiescent state. The G1 phase takes place in cell division, during which the cells grow in size and also synthesize mRNA and proteins required for DNA synthesis. Once the required proteins and growth are completed, the cells move into the S phase. The S phase occurs between the G1 phase and G2 phase, when DNA is replicated. The G2 phase is a period of rapid cell growth and protein synthesis, during which the cell readies itself for mitosis (M). The M phase is a cell cycle process, and at this stage the cell growth stops and cellular energy is focused on orderly division into two daughter cells (Crews and Mohan, 2000).
To investigate whether the antiproliferative properties of GTPs depend in part on cell cycle arrest, the cells were stained with DNA-binding dye (PI), and the cell cycle phase distribution of the GTP-treated MCF-7 cells was quantified by flow cytometry analysis (Table 1). As shown in Table 1, the GTP-treated cells caused a remarkable accumulation of cells in the G1/G0 phase from 47.1% to 52.3%, whereas the number of cells in the S phase decreased from 35.5% of the control group to 26.8%. The result indicated that GTPs can inhibit cell cycle arrest at the transition from the G1 to S phase in MCF-7 cells. Furthermore, at higher GTP concentrations (≥300 μg/ml), a substantial increase in the population of the G2/M phase was observed. The above results showed that GTPs can regulate both the G1/S and G2/M transition to inhibit an increase in the number of cells and DNA synthesis.
Table 1.
Effects of GTPs on cell cycles in MCF-7 cells
| GTP (μg/ml) | Cell population (%) |
||
| G1/G0 | G2/M | S | |
| 0 | 47.1±1.37a | 17.4±0.84a | 35.5±1.12a |
| 200 | 51.2±3.45b | 15.7±1.05b | 33.1±1.83b |
| 300 | 51.5±2.06c | 17.4±0.82a | 31.1±1.21c |
| 400 | 52.3±2.78d | 20.9±1.28c | 26.8±1.07d |
Values are expressed as mean±SD (n=3) and different letters within a column indicate significant difference between samples (P˂0.05)
3.3. Effect of GTPs on the mitochondrial membrane potential in MCF-7 cells
Mitochondrial membrane potential (ΔΨ m) depolarization is an important early indicator of apoptotic signaling activation. Loss of ΔΨ m can be detected by staining MCF-7 cells with a lipophilic cationic probe JC-1 (Baregamian et al., 2009). JC-1 exists as red fluorescent JC-1-aggregate under high ΔΨ m at hyperpolarized membrane potentials or as green fluorescent monomers under low ΔΨ m at depolarized membrane potentials. Thus, mitochondrial depolarization can be specifically indicated by a decrease in the red/green fluorescence intensity ratio (Radad et al., 2006; Rogalska et al., 2008). When examined by fluorescent microscopy, the untreated control cells stained with JC-1 clearly showed an intense red fluorescence and weak green fluorescence. However, ΔΨ m rapidly depolarized in the cells exposed to GTPs for 24 h, as shown by a marked increase in green fluorescence and disappearance of red fluorescence (Fig. 3a). As shown in Fig. 3b GTP-treated cells showed a significant decrease in ΔΨ m, evidenced by a reduction in red/green fluorescence intensity ratio.
Fig. 3.
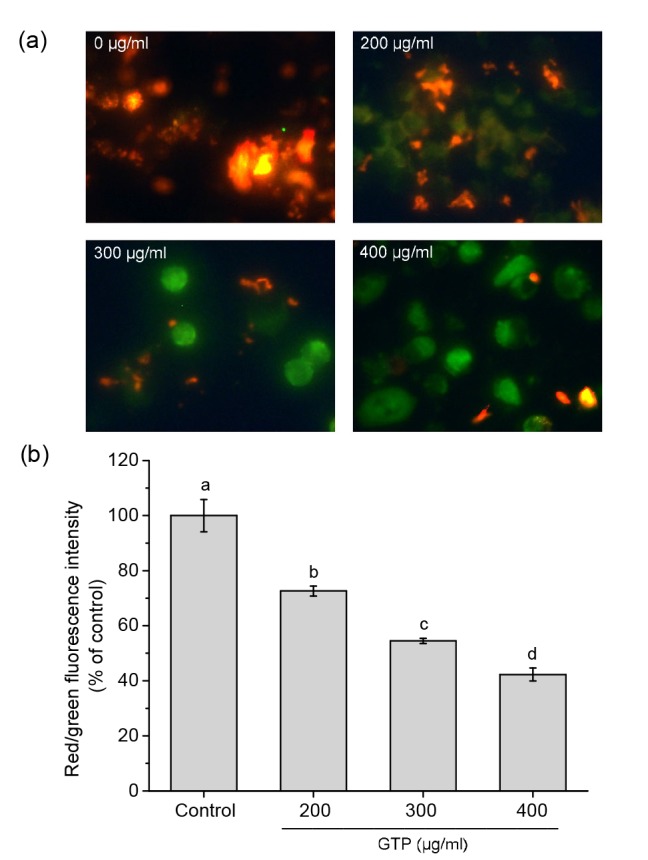
Effect of GTPs on the mitochondrial membrane potential (ΔΨ m) in MCF-7 cells
(a) Qualitative analysis of ΔΨ m using the lipophilic cationic probe JC-1 with a fluorescence microscope (magnification 400×). Cells were treated with 0, 200, 300, and 400 μg/ml of GTPs for 24 h, respectively. (b) Determination of ΔΨ m by a Fluoroskan Ascent Microplate Fluorometer. Data are expressed as mean±SD, with n=3. Different letters above the columns indicate significant differences (P<0.05) (Note: for interpretation of the references to color in this figure legend, the reader is referred to the web version of this article)
3.4. GTP-induced generation of intracellular ROS in MCF-7 cells
ROS are known as the mediators of intracellular signaling cascade. Excessive generation of ROS can lead to oxidative damage to the mitochondrial membrane and ultimately trigger a series of mitochondrial-associated events including apoptosis (Quan et al., 2010; Huang et al., 2014). DCFH-DA is a fluorogenic freely permeable tracer specific for ROS determination, which can cross over the cellular membrane and be hydrolyzed to the non-fluorescent DCFH by intracellular esterases. DCFH is consequently oxidized by ROS to a highly fluorescent substance, DCF. Thus, the fluorescent intensity of DCF is proportional to the level of ROS generated by MCF-7 cells (Zhang et al., 2007; Liu and Huang, 2015). As shown in Fig. 4a in contrast to the control (untreated) cells, the fluorescence intensity of GTP-treated cells was significantly higher; meanwhile, fluorescence intensity increased as GTP concentration increased. The levels of ROS in GTP-treated cells were significantly higher than those in the untreated cells. As shown in Fig. 4b it was found that cells treated with 400 μg/ml of GTP for 24 h significantly elevated ROS generation more than the untreated control cells (increased by 81.0%).
Fig. 4.
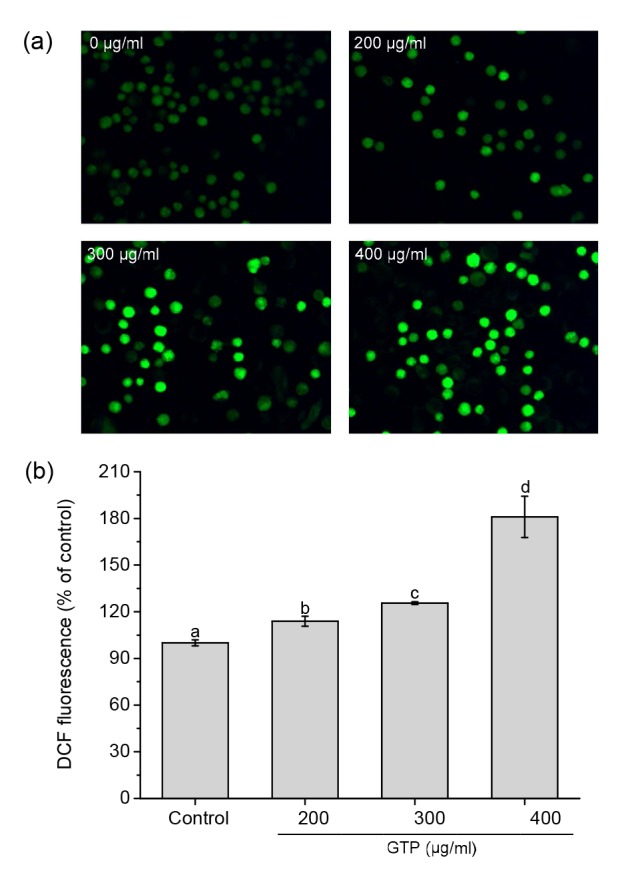
Effect of GTPs on intracellular ROS generation in MCF-7 cells
(a) Qualitative analysis of ROS generation by a fluorescence microscope (magnification 400×). Cells were treated with 0, 200, 300, and 400 μg/ml of GTPs for 24 h, respectively. (b) Determination of ROS generation by a Fluoroskan Ascent Microplate Fluorometer. Data are expressed as mean±SD, with n=3. Different letters above the columns indicate significant differences (P<0.05)
3.5. GTP-induced DNA fragmentation in MCF-7 cells
As the major biological criterion for determination of whether a cell is apoptotic, fragmentation of chromosomal DNA is believed to be a relatively late event in the apoptotic process (Zhang et al., 2007; Huang et al., 2014). When treated with anticancer agent, chromatin DNA is cleaved into multiples of approximately 180–200 base pairs (bp) internucleosomal fragments which can be detected by gel electrophoresis as a typical DNA ladder pattern (González et al., 2013; Huang et al., 2014). As shown in Fig. 5, MCF-7 cells cultured in the control group showed no obvious DNA ladders, while the MCF-7 cells treated with GTPs showed significant DNA fragmentation and the ladder gradually became clear as the concentration of GTPs increased. The result indicated that GTPs could induce apoptosis in MCF-7 cells as characterized by DNA fragmentation.
Fig. 5.
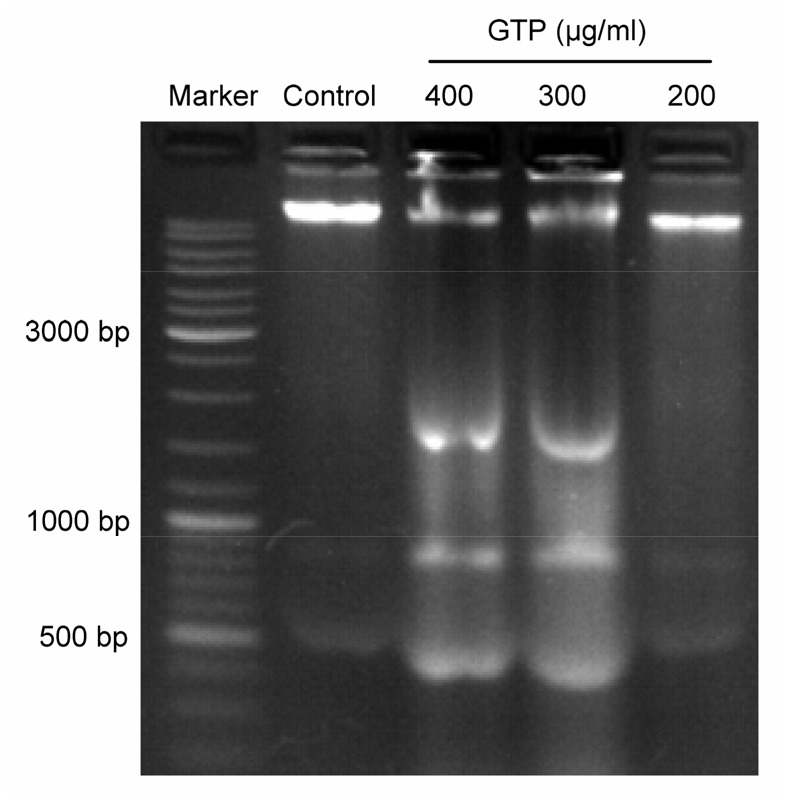
Effect of GTPs on DNA fragmentation in MCF-7 cells detected by gel electrophoresis
3.6. GTP-induced caspase-3 and caspase-9 activation in MCF-7 cells
Caspases are important mediators of cell apoptosis, which play central roles in the initiation and execution of apoptosis (Li L.L. et al., 2012; Li T. et al., 2013). Among these caspases, caspase-3 is most important, and plays a direct role in proteolytic cleavage of cellular poly (ADP-ribose) polymerase (PARP) (Chakraborty et al., 2012). In normal cells, caspase-3 is expressed as an active 35-kDa precursor, which can be proteolytically cleaved into active 17-and 19-kDa subunits when apoptosis occurs (Sun et al., 1999). Within the mitochondrial pathway of apoptosis, caspase-9 is an initiator caspase responsible for the activation of the executioner caspases, such as downstream caspase-3 (Hail et al., 2006). Upon apoptosis stimulation, full-length inactive caspase-9 (47-kDa) will be cleaved into active 35-and 37-kDa subunits (Herold et al., 2002).
To further elucidate the apoptotic pathway involved in GTP-induced apoptosis in MCF-7 cells, the expressions of caspase-3 and its upstream initiator caspase-9 were examined by Western blot analysis. As shown in Fig. 6, exposure of MCF-7 cells to GTPs resulted in a decrease in the expressions of pro-caspase-3 and pro-caspase-9. The activated cleavage fragments of caspase-3 and caspase-9 were not detected in the control cells, but appeared in GTP-treated cells. The results confirmed that caspase-3 and caspase-9 were involved in both the extrinsic and intrinsic apoptosis pathways in GTP-induced apoptosis, suggesting that GTPs could induce cell apoptosis in MCF-7 cells through the mitochondrial pathway, resulting in caspase-9 activation and downstream caspase-3 activation.
Fig. 6.
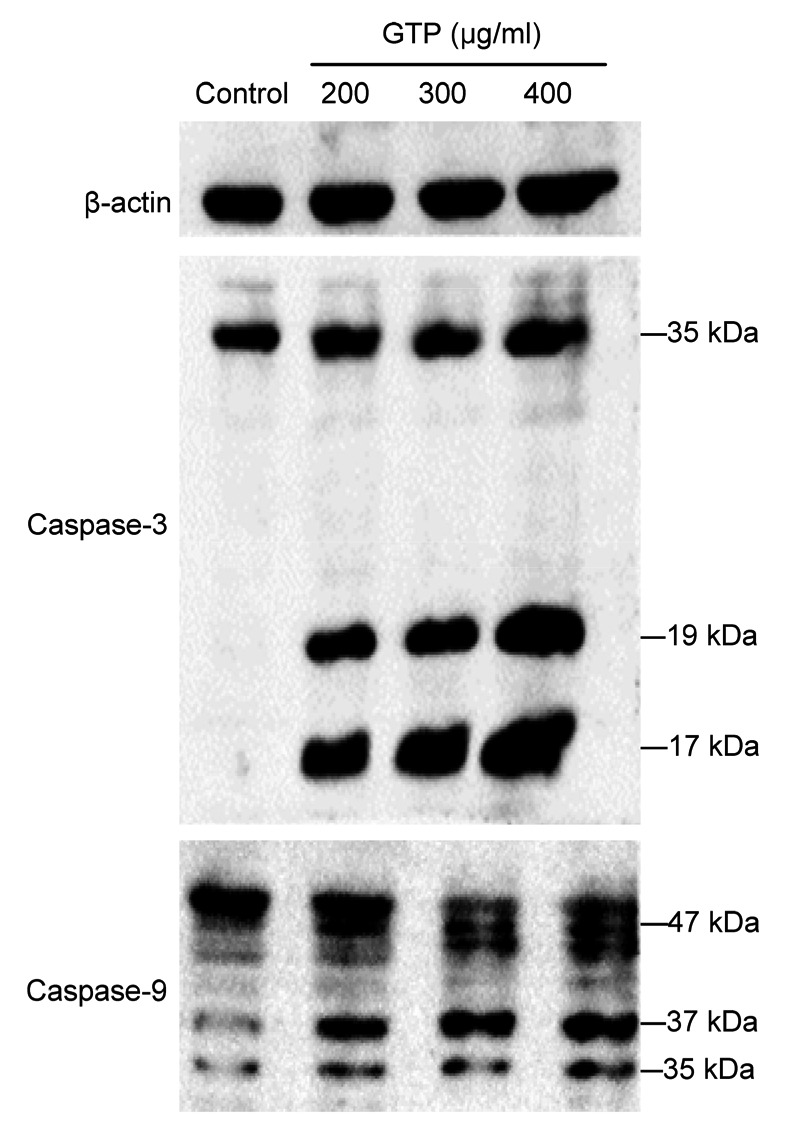
Effect of GTPs on activations of caspase-3 and caspase-9 detected by Western blot analysis
4. Conclusions
In this work, the cytotoxic effect of GTPs against five human cancer cell lines and the mechanisms of apoptosis in MCF-7 cells induced by GTPs were studied. In summary, the results showed that GTPs had broad-spectrum anti-tumor activities, especially for MCF-7 cells. Studies on the underlying mechanisms revealed that exposure of GTPs could significantly inhibit the growth of MCF-7 cells through induction of cell cycle arrest by regulating the G1/S and G2/M transition and induction of the mitochondrial-dependent pathway of apoptosis. The GTP-induced apoptosis of MCF-7 cells was involved in induction of chromatin condensation, the loss of ΔΨ m, elevation of intracellular ROS production, induction of nucleosomal DNA fragmentation, and activations of caspase-3 and caspase-9.
Footnotes
Project supported by the Research Fund for the Doctoral Program of Higher Education of China (No. 20120172110017) and the National Natural Science Foundation of China (Nos. 31471673 and 31271978)
Compliance with ethics guidelines: Shu-min LIU, Shi-yi OU, and Hui-hua HUANG declare that they have no conflict of interest.
This article does not contain any studies with human or animal subjects performed by any of the authors.
References
- 1.Baregamian N, Song J, Bailey CE, et al. Tumor necrosis factor-α and apoptosis signal-regulating kinase 1 control reactive oxygen species release, mitochondrial autophagy and c-Jun N-terminal kinase/p38 phosphorylation during necrotizing enterocolitis. Oxid Med Cell Longev. 2009;2(5):297–306. doi: 10.4161/oxim.2.5.9541. (Available from: http://dx.doi.org/10.4161/oxim.2.5.9541) [DOI] [PMC free article] [PubMed] [Google Scholar]
- 2.Boyle P, Levin B. World Cancer Report 2008. International Agency for Research on Cancer. Lyon, France: 2008. [Google Scholar]
- 3.British Standards Institution. BS ISO 14502-1:2005. Determination of substances characteristic of green and black tea. Content of total polyphenols in tea. Colorimetric method using Folin-Ciocalteu reagent. London, UK: British Standards Institution; 2005. pp. 1–6. (Available from: http://shop.bsigroup) [Google Scholar]
- 4.Chakraborty D, Bishayee K, Ghosh S, et al. [6]-Gingerol induces caspase 3 dependent apoptosis and autophagy in cancer cells: drug-DNA interaction and expression of certain signal genes in HeLa cells. Eur J Pharmacol. 2012;694(1-3):20–29. doi: 10.1016/j.ejphar.2012.08.001. (Available from: http://dx.doi.org/10.1016/j.ejphar.2012.08.001) [DOI] [PubMed] [Google Scholar]
- 5.Cotran RS, Kumar V, Collins T, et al. Robbins Pathologic Basis of Disease, 6th Ed. Philadelphia: WB Saunders; 1999. [Google Scholar]
- 6.Crews CM, Mohan R. Small-molecule inhibitors of the cell cycle. Curr Opin Chem Biol. 2000;4(1):47–53. doi: 10.1016/s1367-5931(99)00050-2. (Available from: http://dx.doi.org/10.1016/S1367-5931(99)00050-2) [DOI] [PubMed] [Google Scholar]
- 7.Ferlay J, Shin H, Bray F, et al. Estimates of worldwide burden of cancer in 2008: GLOBOCAN 2008. Int J Cancer. 2010;127(12):2893–2917. doi: 10.1002/ijc.25516. (Available from: http://dx.doi.org/10.1002/ijc.25516) [DOI] [PubMed] [Google Scholar]
- 8.González SEF, Anguiano EA, Herrera AM, et al. Cytotoxic, pro-apoptotic, pro-oxidant, and non-genotoxic activities of a novel copper(II) complex against human cervical cancer. Toxicology. 2013;314(1):155–165. doi: 10.1016/j.tox.2013.08.018. (Available from: http://dx.doi.org/10.1016/j.tox.2013.08.018) [DOI] [PubMed] [Google Scholar]
- 9.Hail NJr, Carter BZ, Konopleva M. Apoptosis effector mechanisms: a requiem performed in different keys. Apoptosis. 2006;11(6):889–904. doi: 10.1007/s10495-006-6712-8. (Available from: http://dx.doi.org/10.1007/s10495-006-6712-8) [DOI] [PubMed] [Google Scholar]
- 10.Hail NJr, Cortes M, Drake EN, et al. Cancer chemoprevention: a radical perspective. Free Radical Biol Med. 2008;45(2):97–110. doi: 10.1016/j.freeradbiomed.2008.04.004. (Available from: http://dx.doi.org/10.1016/j.freeradbiomed.2008.04.004) [DOI] [PubMed] [Google Scholar]
- 11.Herold MJ, Kuss AW, Kraus C, et al. Mitochondria-dependent caspase-9 activation is necessary for antigen receptor-mediated effector caspase activation and apoptosis in WEHI 231 lymphoma cells. J Immunol. 2002;168(8):3902–3909. doi: 10.4049/jimmunol.168.8.3902. (Available from: http://dx.doi.org/10.4049/jimmunol.168.8.3902) [DOI] [PubMed] [Google Scholar]
- 12.Hortobagyi GN, Ames FC, Buzdar AU, et al. Management of stage III primary breast cancer with primary chemotherapy, surgery, and radiation therapy. Cancer. 1988;62(12):2507–2516. doi: 10.1002/1097-0142(19881215)62:12<2507::aid-cncr2820621210>3.0.co;2-d. (Available from: http://dx.doi.org/10.1002/1097-0142(19881215)62:12<2507::AID-CNCR2820621210>3.0.CO;2-D) [DOI] [PubMed] [Google Scholar]
- 13.Huang XC, Wang M, Wang HS, et al. Synthesis and antitumor activities of novel dipeptide derivatives derived from dehydroabietic acid. Bioorg Med Chem Lett. 2014;24(6):1511–1518. doi: 10.1016/j.bmcl.2014.02.001. (Available from: http://dx.doi.org/10.1016/j.bmcl.2014.02.001) [DOI] [PubMed] [Google Scholar]
- 14.Jiang XG. Harnessing the immune system for the treatment of breast cancer. J Zhejiang Univ-Sci B (Biomed & Biotechnol) 2014;15(1):1–15. doi: 10.1631/jzus.B1300264. (Available from: http://dx.doi.org/10.1631/jzus.B1300264) [DOI] [PMC free article] [PubMed] [Google Scholar]
- 15.Khan N, Mukhtar H. Tea polyphenols for health promotion. Life Sci. 2007;81(7):519–533. doi: 10.1016/j.lfs.2007.06.011. (Available from: http://dx.doi.org/10.1016/j.lfs.2007.06.011) [DOI] [PMC free article] [PubMed] [Google Scholar]
- 16.Li LL, Cao WQ, Zheng WJ, et al. Ruthenium complexes containing 2,6-bis(benzimidazolyl)pyridine derivatives induce cancer cell apoptosis by triggering DNA damage-mediated p53 phosphorylation. Dalton Trans. 2012;41(41):12766–12772. doi: 10.1039/c2dt30665d. (Available from: http://dx.doi.org/10.1039/C2DT30665D) [DOI] [PubMed] [Google Scholar]
- 17.Li T, Zhu J, Guo L, et al. Differential effects of polyphenols-enriched extracts from hawthorn fruit peels and fleshes on cell cycle and apoptosis in human MCF-7 breast carcinoma cells. Food Chem. 2013;141(2):1008–1018. doi: 10.1016/j.foodchem.2013.04.050. (Available from: http://dx.doi.org/10.1016/j.foodchem.2013.04.050) [DOI] [PubMed] [Google Scholar]
- 18.Liang HH, Huang HH, Kwok KC. Properties of tea-polyphenol-complexed bromelain. Food Res Int. 1999;32(8):545–551. (Available from: http://dx.doi.org/10.1016/S0963-9969(99)00129-5) [Google Scholar]
- 19.Liu HX, Li XL, Dong CF. Epigenetic and metabolic regulation of breast cancer stem cells. J Zhejiang Univ-Sci B (Biomed & Biotechnol) 2015;16(1):10–17. doi: 10.1631/jzus.B1400172. (Available from: http://dx.doi.org/10.1631/jzus.B1400172) [DOI] [PMC free article] [PubMed] [Google Scholar]
- 20.Liu SM, Huang HH. Assessments of antioxidant effect of black tea extract and its rationals by erythrocyte haemolysis assay, plasma oxidation assay and cellular antioxidant activity (CAA) assay. J Funct Foods. 2015;18(Part B):1095–1105. (Available from: http://dx.doi.org/10.1016/j.jff.2014.08.023) [Google Scholar]
- 21.Lu G, Xiao H, You H, et al. Synergistic inhibition of lung tumorigenesis by a combination of green tea polyphenols and atorvastatin. Clin Cancer Res. 2008;14(15):4981–4988. doi: 10.1158/1078-0432.CCR-07-1860. (Available from: http://dx.doi.org/10.1158/1078-0432.CCR-07-1860) [DOI] [PubMed] [Google Scholar]
- 22.Luo HT, Tang LL, Tang M, et al. Phase IIa chemoprevention trial of green tea polyphenols in high-risk individuals of liver cancer: modulation of urinary excretion of green tea polyphenols and 8-hydroxydeoxyguanosine. Carcinogenesis. 2006;27(2):262–268. doi: 10.1093/carcin/bgi147. (Available from: http://dx.doi.org/10.1093/carcin/bgi147) [DOI] [PubMed] [Google Scholar]
- 23.Pan GH, O'Rourke K, Dixit VM. Caspase-9, Bcl-XL, and Apaf-1 form a ternary complex. J Biol Chem. 1998;273(10):5841–5845. doi: 10.1074/jbc.273.10.5841. (Available from: http://dx.doi.org/10.1074/jbc.273.10.5841) [DOI] [PubMed] [Google Scholar]
- 24.Pandey M, Shukla S, Gupta S. Promoter demethylation and chromatin remodeling by green tea polyphenols leads to re-expression of GSTP1 in human prostate cancer cells. Int J Cancer. 2010;126(11):2520–2533. doi: 10.1002/ijc.24988. (Available from: http://dx.doi.org/10.1002/ijc.24988) [DOI] [PMC free article] [PubMed] [Google Scholar]
- 25.Pianetti S, Guo S, Kavanagh KT, et al. Green tea polyphenol epigallocatechin-3 gallate inhibits Her-2/neu signaling, proliferation, and transformed phenotype of breast cancer cells. Cancer Res. 2002;62(3):652–655. [PubMed] [Google Scholar]
- 26.Quan ZW, Gu J, Dong P, et al. Reactive oxygen species-mediated endoplasmic reticulum stress and mitochondrial dysfunction contribute to cirsimaritin-induced apoptosis in human gallbladder carcinoma GBC-SD cells. Cancer Lett. 2010;295(2):252–259. doi: 10.1016/j.canlet.2010.03.008. (Available from: http://dx.doi.org/10.1016/j.canlet.2010.03.008) [DOI] [PubMed] [Google Scholar]
- 27.Radad K, Rausch WD, Gille G. Rotenone induces cell death in primary dopaminergic culture by increasing ROS production and inhibiting mitochondrial respiration. Neurochem Int. 2006;49(4):379–386. doi: 10.1016/j.neuint.2006.02.003. (Available from: http://dx.doi.org/10.1016/j.neuint.2006.02.003) [DOI] [PubMed] [Google Scholar]
- 28.Rezaei PF, Fouladdel S, Hassani S, et al. Induction of apoptosis and cell cycle arrest by pericarp polyphenol-rich extract of Baneh in human colon carcinoma HT29 cells. Food Chem Toxicol. 2012;50(3-4):1054–1059. doi: 10.1016/j.fct.2011.11.012. (Available from: http://dx.doi.org/10.1016/j.fct.2011.11.012) [DOI] [PubMed] [Google Scholar]
- 29.Rogalska A, Koceva-Chyła A, Jóźwiak Z. Aclarubicin-induced ROS generation and collapse of mitochondrial membrane potential in human cancer cell lines. Chem Biol Interact. 2008;176(1):58–70. doi: 10.1016/j.cbi.2008.07.002. (Available from: http://dx.doi.org/10.1016/j.cbi.2008.07.002) [DOI] [PubMed] [Google Scholar]
- 30.Stewart BW, Wild CP. World Cancer Report 2014. World Health Organization, International Agency for Research on Cancer. Lyon, France; 2014. [Google Scholar]
- 31.Strasser A, O'Connor L, Dixit VM. Apoptosis signaling. Annu Rev Biochem. 2000;69:217–245. doi: 10.1146/annurev.biochem.69.1.217. (Available from: http://dx.doi.org/10.1146/annurev.biochem.69.1.217) [DOI] [PubMed] [Google Scholar]
- 32.Sun XM, MacFarlane M, Zhuang J, et al. Distinct caspase cascades are initiated in receptor-mediated and chemical-induced apoptosis. J Biol Chem. 1999;274(8):5053–5060. doi: 10.1074/jbc.274.8.5053. (Available from: http://dx.doi.org/10.1074/jbc.274.8.5053) [DOI] [PubMed] [Google Scholar]
- 33.Thangapazham RL, Singh AK, Sharma A, et al. Green tea polyphenols and its constituent epigallocatechin gallate inhibits proliferation of human breast cancer cells in vitro and in vivo. Cancer Lett. 2007;245(1-2):232–241. doi: 10.1016/j.canlet.2006.01.027. (Available from: http://dx.doi.org/10.1016/j.canlet.2006.01.027) [DOI] [PubMed] [Google Scholar]
- 34.Yang CS, Lambert JD, Sang S. Antioxidative and anti-carcinogenic activities of tea polyphenols. Arch Toxicol. 2009;83(1):11–21. doi: 10.1007/s00204-008-0372-0. (Available from: http://dx.doi.org/10.1007/s00204-008-0372-0) [DOI] [PMC free article] [PubMed] [Google Scholar]
- 35.Zhang JY, Wu HY, Xia XK, et al. Anthracenedione derivative 1403P-3 induces apoptosis in KB and KBv200 cells via reactive oxygen species-independent mitochondrial pathway and death receptor pathway. Cancer Biol Ther. 2007;6(9):1409–1417. doi: 10.4161/cbt.6.9.4543. (Available from: http://dx.doi.org/10.4161/cbt.6.9.4543) [DOI] [PubMed] [Google Scholar]


