Abstract
Hepatocellular carcinoma (HCC) is one of the leading causes of cancer-related deaths globally. Sorafenib is the only first-line systemic drug for advanced HCC, but it has very limited survival benefits because patients treated with sorafenib either suffer from side effects or show disease progression after initial response. Thus, there is an urgent need to develop novel strategies for first-line and second-line therapies. The association between sorafenib resistance and glycolysis prompted us to screen several drugs with known antiglycolytic activity to identify those that will sensitize cells to sorafenib. We demonstrate that the combination of glycolytic inhibitor 2-deoxyglucose (2DG) and sorafenib drastically inhibits viability of sorafenib-sensitive and -resistant cells. However, the combination of other antiglycolytic drugs like lonidamine, gossypol, 3-bromopyruvate, and imatinib with sorafenib does not show synergistic effect. Cell cycle analysis revealed that the combination of 2DG and sorafenib induced cell cycle arrest at G0/G1. Mechanistic investigation suggests that the cell cycle arrest is due to depletion of cellular ATP that activates AMP-activated protein kinase (AMPK), which, in turn, inhibits mammalian target of rapamycin (mTOR) to induce cell cycle arrest. This study provides strong evidence for the therapeutic potential of the combination of sorafenib and 2DG for HCC.
Key words: Hepatocellular carcinoma (HCC), Sorafenib, Resistance, Glycolysis, 2-Deoxyglucose (2DG)
INTRODUCTION
Hepatocellular carcinoma (HCC) is one of the leading causes of cancer-related deaths globally1,2 and is the second most common cancer in men worldwide. Because of late diagnosis and lack of effective drugs for treatment, HCC is the second highest cause of death in males from cancer3. Only a small proportion of HCC patients are diagnosed at an early stage, which enables the use of curative treatments such as tumor resection or liver transplant. Unfortunately, most patients go undiagnosed until the disease has progressed to an advanced stage when none of the available treatments are effective. Sorafenib, a multikinase inhibitor, is currently the only FDA-approved drug used in treating such patients4. Unfortunately, the average overall survival of patients treated with sorafenib is only extended by 2.8 months compared to untreated patients5. Although sorafenib treatment was shown to extend the overall survival of HCC patients, only 2% of patients displayed partial response to therapy based on RECIST criteria (Response Evaluation Criteria in Solid Tumors)5. This low response rate is attributed to intrinsic resistance of HCC to sorafenib toxicity6. In view of the lack of other FDA-approved therapies for advanced-stage HCC patients, it is critical to develop novel therapeutic strategies to sensitize HCC tumors to sorafenib toxicity, which could extend the survival of HCC patients.
The mechanisms that mediate sorafenib resistance remain relatively unknown6. A handful of studies have demonstrated that a variety of mechanisms are involved in maintaining sorafenib resistance, which include CD44 overexpression1, activation of PI3K/AKT signaling7, and increased MAPK14 activity8. Another group of studies has linked sorafenib sensitivity to cellular metabolism and glycolysis9,10. These studies are interesting because sorafenib therapy has been shown to inhibit oxidative phosphorylation and enhance glycolysis in a subset of HCC cell lines2.
In order to elucidate further the most significant mechanism(s) of sorafenib resistance, our laboratory has developed sorafenib-resistant HCC cell lines. Here we demonstrate that rates of glycolysis are markedly higher in sorafenib-resistant HCC cells than parental HCC cells when treated with sorafenib. We hypothesized that high glycolytic rates are essential for cells to maintain sorafenib resistance and that suppressing glycolysis will sensitize resistant HCC cells to sorafenib toxicity. To test this hypothesis, we measured glucose consumption and lactate production in sorafenib-sensitive and -resistant cells and initially examined the combination of several antiglycolytic agents/drugs and sorafenib in our resistant cell lines. This study showed that only one antiglycolytic drug, 2-deoxyglucose (2DG), displayed synergy with sorafenib. 2DG is a structural analog of glucose, which inhibits glycolysis11,12. Here we demonstrate drastic inhibition of cell growth by combined treatment with these two drugs, elucidate the potential mechanism underlying the remarkable synergistic effect of these drugs in sorafenib-sensitive and -resistant HCC cell lines, and offer an alternate therapeutic strategy to treat HCC particularly at an advanced stage.
MATERIALS AND METHODS
Reagents and Antibodies
Sorafenib (Cat. No. S-8502) was purchased from LC Laboratories (Woburn, MA, USA). Lonidamine (Cat. No. L5658), gossypol (Cat. No. G5874), and imatinib (Cat. No. I-5577) were purchased from LKT Laboratories, Inc. (St. Paul, MN, USA). 2DG (Cat. No. D6134) and propidium iodide (PI) (Cat. No. 81845) were purchased form Sigma-Aldrich (St. Louis, MO, USA). Antibodies used for Western blotting were purchased from Cell Signaling (Danvers, MA, USA). All other reagents were of molecular biology grade.
Cell Culture
All cells were maintained in minimum essential medium (MEM) supplemented with l-glutamine (2 mM), 10% FBS, sodium pyruvate (0.11 g/L), and penicillin/streptomycin (100 U/ml). Cell medium for sorafenib-resistant cell lines was also supplemented with sorafenib (6 μM in DMSO with 0.1% final DMSO concentration). Sorafenib was withdrawn from the cell medium of resistant Huh7 cells for 5–7 days prior to performing all experiments.
Hep3B cells were obtained from the ATCC. In this article, “Huh7-S” refers to the originally sorafenib-sensitive Huh7 cells that were generously provided by Dr. James Taylor (Fox Chase Center, PA, USA). Sorafenib-resistant cells “Huh7-R-Pool” and “Huh7-R-A7” were generated in our laboratory. In order to generate Huh7-R-Pool cells, Huh7-S cells grown in MEM were pulsed with 10 μM sorafenib for 4 h every week for 6 weeks. The cells were then maintained in a low concentration of sorafenib. Medium sorafenib concentration was slowly increased to a final concentration of 6 μM after several months. Several individual clones were isolated from the Huh7-R-Pool cells. The Huh7-R-A7 cell line is one such clone.
Cell Viability and ATP Assays
Cells were seeded into Eppendorf 96-well plates (∼2,000 cells/well) and allowed to attach overnight. Cell medium was then changed for medium containing sorafenib or other therapeutics in DMSO with 1% final DMSO concentration. After 48 h of incubation, CellTiter-Glo® was added following the manufacturer’s protocol (Promega, Madison, WI, USA). The luminescent supernatant was transferred to an opaque luminometer 96-well plate prior to measuring luminescence. The same procedure was followed for the ATP measurement assay. For drug combinations, combination index (CI) was calculated using the CompuSyn software. The assays with sorafenib and 2DG were performed in triplicates and repeated twice.
Glucose Consumption and Lactate Production
Cells were seeded into six-well plates (50% confluency) and allowed to attach overnight. Cells were then treated for 48 h with phenol red-free DMEM containing therapeutics in DMSO with 1% final DMSO concentration. After 4 h, cell medium supernatant was removed and analyzed for glucose and lactate concentrations.
Medium glucose concentration was measured using a ReliOn® ULTIMA glucometer (Alameda, CA, USA). Cell medium was diluted 1:1 with PBS prior to glucose measurement to bring it within the linear range of the instrument. Glucose concentrations were compared to “fresh” medium that was not exposed to cellular metabolism. Glucose consumption was determined by subtracting the cellular glucose concentration from that of the fresh medium. Since 2DG is detected by the glucometer at the same sensitivity as d-glucose, medium containing 2DG was compared to fresh medium containing the same initial concentration of 2DG. The glucose consumption measured by these cells is equivalent to d-glucose + 2DG consumption. This method does not allow distinguishing d-glucose consumption from 2DG consumption.
Medium lactate concentrations were measured using the L-Lactate Assay kit from ScienCell (Carlsbad, CA, USA). Cell medium was diluted 1:30 with the kit assay buffer prior to measurement to bring it within the linear measurement range. The assay was conducted following the manufacturer’s recommendations.
The assays were performed in biological replicates. Two-tailed nonpaired t-test was used to determine statistical significance.
Colony Formation Assay
Cells were seeded into six-well plates (2,000–5,000 cells/well) and allowed to attach for 24–48 h. Cells were then treated with a continuous dose of therapeutics in DMSO (final concentration 1%) for 14 to 18 days. Medium was changed every 3 days. After colonies were of sufficient size, the cells were fixed with 3.7% paraformaldehyde (in PBS). Cells were then stained with a 0.05% crystal violet solution and imaged. The assay was performed in biological duplicates for each cell type and drug combination.
Cell Cycle Analysis
Cells were seeded into six-well plates (50% confluency) and allowed to attach overnight. Cells were then treated for 48 h with therapeutics in DMSO (final concentration 1%). After 48 h, cells were collected via trypsinization and fixed in 75% ethanol. After washing, cells were stained in a solution containing PI (0.5 mg/ml) and RNase A (10 mg/ml). Cells were filtered through a 70-μm cell strainer immediately prior to flow cytometry. Flow cytometry was performed at the Ohio State University Comprehensive Cancer Center Analytical Cytometry Core Facility on a BD LSR II (San Jose, CA, USA).
Western blotting
Proteins extracted from cells were immunoblotted with different antibodies following published protocol13,14. Briefly, cells were seeded into a 60-mm dish and allowed to grow overnight. Cells were then treated with drugs dissolved in DMSO (final concentration 1%) for 6 h, and an equal amount of protein lysates prepared in the lysis buffer (Cell Signaling) was resolved by sodium dodecyl sulfate-polyacrylamide gel electrophoresis and transferred onto nitrocellulose membrane. After blocking with blocking buffer (LI-COR, Lincoln, NE, USA) containing 0.1% Tween 20, the membrane was incubated with primary antibodies overnight at 4°C. Following incubation with appropriate secondary antibody (IRD-680 or IRD-800), the immunoreactive bands were visualized using LI-COR Odyssey infrared scanner (LI-COR). The blots were reprobed with β-actin to correct for differences in protein loading. Protein was estimated using a Bio-Rad protein assay kit (Cat. No. 500-0006) with bovine serum albumin as standard.
RESULTS
Establishment of Sorafenib-Resistant HCC Cell Lines
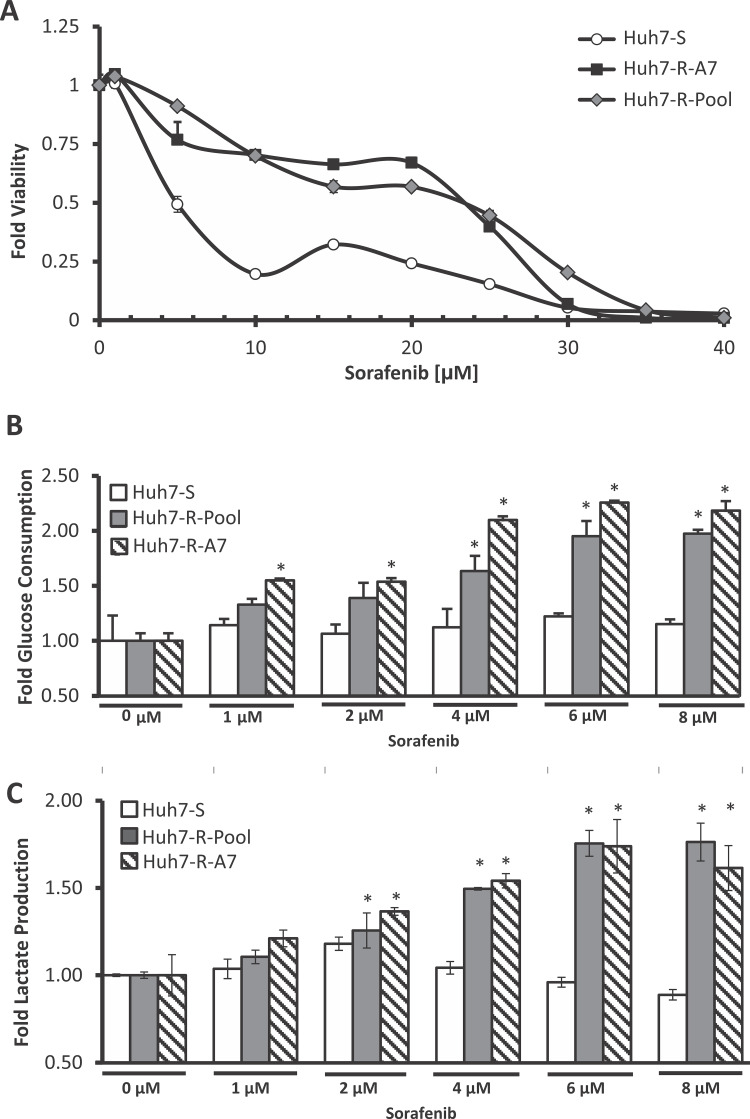
In order to study sorafenib resistance, sorafenib-resistant cell lines were generated from the human HCC cell line Huh7. In brief, Huh7-S cells were initially pulsed with a high dose of sorafenib followed by continuous exposure to increasing doses of sorafenib to induce resistance. From this pool of resistant cells (Huh7-R-Pool), individual resistant clones exhibiting high degrees of resistance were isolated. These cell lines demonstrated a remarkable resistance to sorafenib toxicity; the IC50 dose for the resistant cells was about four to five times higher than that of the parental cells (Fig. 1A).
Figure 1.
Establishment and characterization of sorafenib-resistant HCC cell lines. (A) Viability assay of Huh7-S, Huh7-R-Pool, and Huh7-R-A7 cells. Cells were treated with various concentrations of sorafenib for 48 h. Error bars represent the standard deviation of two biological replicates. (B) Glucose consumption and (C) lactate production of Huh7-S, Huh7-R-Pool, and Huh7-R-A7 cells. The error bars represent the standard deviation of two biological replicates. *p < 0.05 (t-test) compared to 0 μM treated cells of the corresponding cell line.
There have been several recent studies linking sorafenib toxicity and resistance to glycolytic flux. One study demonstrated that exposure of rat hepatocolangiocarcinoma cells to sorafenib induces increased rates of glycolysis10. Another study demonstrated that increased glycolytic utilization has a strong correlation with sorafenib resistance across several HCC cell lines9. We therefore sought to investigate the glycolytic flux of sorafenib-sensitive and -resistant cells exposed to sorafenib. Interestingly, the resistant cells demonstrated a large increase in glucose consumption and lactate production when exposed to increasing concentrations of sorafenib (Fig. 1B and C). However, parental Huh7 cells show minimal change in glucose consumption and lactate production upon sorafenib exposure. Based on these observations, we hypothesized that increased glycolytic flux is a key mechanism for the resistance of HCC cells to sorafenib-induced toxicity. Thus, combination of sorafenib with therapeutics that inhibit glycolysis could sensitize cells to sorafenib toxicity.
In Vitro Screening of Antiglycolytic Agents
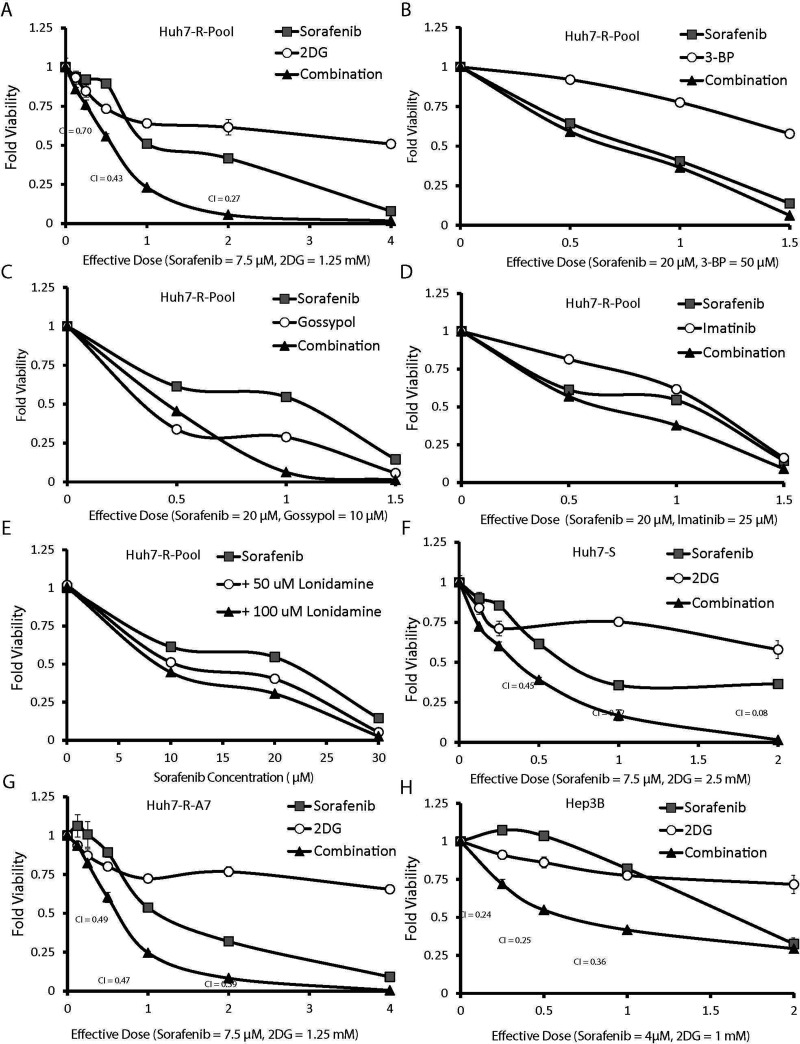
To determine if the inhibition of glycolysis could sensitize HCC cells to sorafenib toxicity, we first sought to identify therapeutics that were known to inhibit glycolysis. To accelerate the future clinical trial process of successful therapeutic combinations identified in this study, we focused on drugs that are already FDA approved or undergoing clinical trials for another indication. Table 1 contains a list of antiglycolytic drugs selected for this study. Each therapeutic was used alone and in combination with sorafenib to generate dose-dependent viability curves in Huh7-R-Pool cells (Fig. 2A–E). The degree of synergy between sorafenib and the antiglycolytic drug was quantified using the widely accepted Chou–Talalay CI method15. The CI for lonidamine could not be calculated accurately because it did not show any toxicity on its own (Fig. 2E). A combination index value of less than 1 indicates that the drugs are acting synergistically; a lower CI value indicates a greater degree of synergy. Several of the key CI values for the combination of sorafenib and 2DG were less than 1, demonstrating synergy (Fig. 2A). This initial screening demonstrated that the antiglycolytic agent (2DG) significantly potentiated sorafenib toxicity, whereas 3-bromopyruvate, gossypol, imatinib, and lonidamine showed little or no synergy (Fig. 2B–E).
Table 1.
Antiglycolytic Therapeutics Tested in This Study
| Drug Name | Antiglycolytic Mechanism | Development Stage | Clinical Use | Clinical Trial Citation |
|---|---|---|---|---|
| 2-Deoxyglucose | Glucose analog: hexokinase inhibition | Phase II | Prostate cancer | 19 |
| Gossypol | GAPDH inhibition | Phase II/III | Lung cancer | 22 |
| Imatinib | Inhibition | FDA approved | CML | 24 |
| Lonidamine | Hexokinase inhibition | Phase III | Prostate hyperplasia | – |
Figure 2.
The combination of sorafenib and 2-deoxyglucose synergistically inhibited HCC cell proliferation. (A–E) Huh7-R-Pool cells were treated with various concentrations of sorafenib and (A) 2DG, (B) 3-bromopyruvate (3-BP), (C) gossypol, (D) imatinib, and (E) lonidamine. Sorafenib and 2DG combinations were also tested in the Huh7-S (F), Huh7-R-A7 (G), and Hep3B (H) cells. The x-axis of each plot is represented in units of “effective dose.” Each effective dose corresponds to a specific concentration of sorafenib and antiglycolytic drug. Combination index (CI) values were calculated using CompuSyn software.
The synergistic combination of sorafenib and 2DG was further confirmed in the Huh7-S cells, Huh7-R-A7 cells, and another HCC cell line, Hep3B (Fig. 2F–H). Interestingly, 2DG treatment alone had very low toxicity, whereas the combination of sorafenib and 2DG drastically inhibited cell growth. These experiments demonstrate that the combination of sorafenib and 2DG is more effective than sorafenib alone.
Combination of Sorafenib and 2DG Inhibits Colony Growth
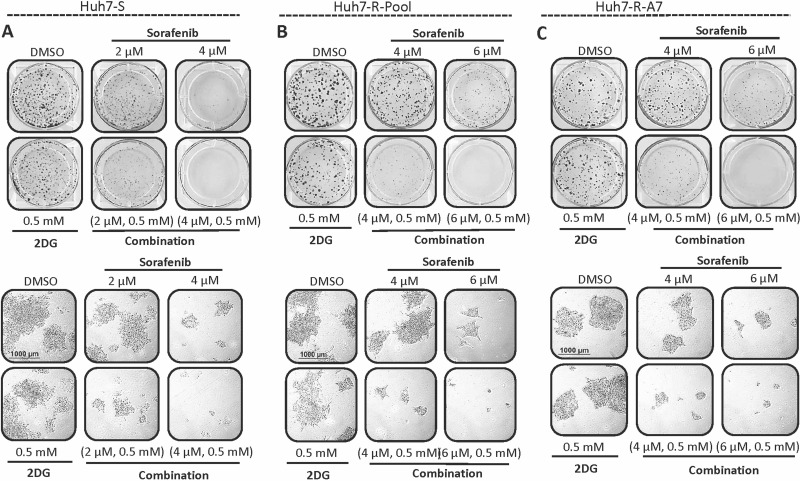
In order to further validate the synergistic combination of sorafenib and 2DG, colony formation assays were performed in parental and resistant Huh7 cell lines (Fig. 3). Treatment with sorafenib (2–4 μM) alone showed a dose-dependent inhibition of colony formation, while 2DG had little effect on colony formation in all cell lines even when used at 0.5 mM. However, the combination of 2DG and sorafenib resulted in drastic inhibition of colony formation compared to independent drug treatments. Further investigation demonstrated that the number of colonies between all treatments was similar; however, the number of cells within each colony was dramatically different. Cells treated with a combination of a high dose (4 μM) of sorafenib and 2DG formed colonies of only one to four cells. These tiny colonies are hardly visible upon visual inspection but can be seen in microscopic images (Fig. 3, bottom). These data suggest that the combination of sorafenib and 2DG primarily results in inhibition of cell growth with minimal effect on cell death.
Figure 3.
Colony formation is inhibited by the combination of sorafenib and 2 deoxyglucose (2DG). (A) Huh7-S, (B) Huh7-R-Pool, and (C) Huh7-R-A7 cells were subject to a colony formation assay following treatment with sorafenib, 2DG, or a combination of both. Plates were imaged macroscopically (top) and microscopically (bottom) after staining and fixing. Microscopic images are representative of average colony size.
Combined Treatment With 2DG and Sorafenib Inhibits Cell Cycle Progression
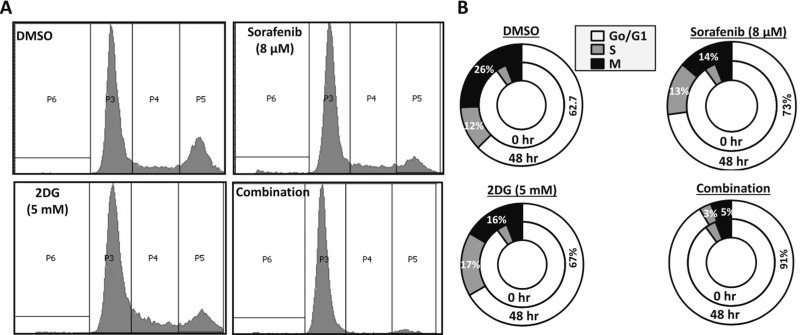
Next, we sought to investigate the mechanism driving the synergy between sorafenib and 2DG. Based on our initial findings from the colony formation assay, we hypothesized that the combination of sorafenib and 2DG is highly potent in inducing cell cycle arrest in HCC cells. To test this hypothesis, we performed cell cycle analysis of Huh7-R-Pool cells treated with sorafenib and 2DG, alone and in combination. Cells were synchronized overnight in serum-free medium and then treated with sorafenib, 2DG, or the combination of both for 48 h. After treatment, cells were stained with PI and analyzed via flow cytometry. Cells treated with the combination of sorafenib and 2DG demonstrated complete G0/G1 arrest, while treatments with individual drugs showed only minor cell cycle arrest (Fig. 4A and B). Additionally, very few apoptotic cells were observed in all of the treatment groups, which correlated with lack of PARP cleavage in any of the treatment groups (data not shown). These data further confirm that the synergistic combination of sorafenib and 2DG results in reduced HCC cell growth without significant increase in cell death.
Figure 4.
The combination of sorafenib and 2DG induces cell cycle arrest in HCC cells. (A, B) Huh7-R-Pool cells were subject to cell cycle analysis. Cells were seeded and allowed to attach overnight. Serum was then withdrawn from the medium for 24 h to allow cell synchronization. Cells were then treated with no drug (1% DMSO), sorafenib (8 μM), 2DG (5 mM), or a combination of both for 48 h. Cells were then harvested, fixed, stained with propidium iodide, and analyzed by flow cytometry. Cell cycle data shown are representative of three biological replicates.
Combined Treatment With Sorafenib and 2DG Depletes Cellular Energy
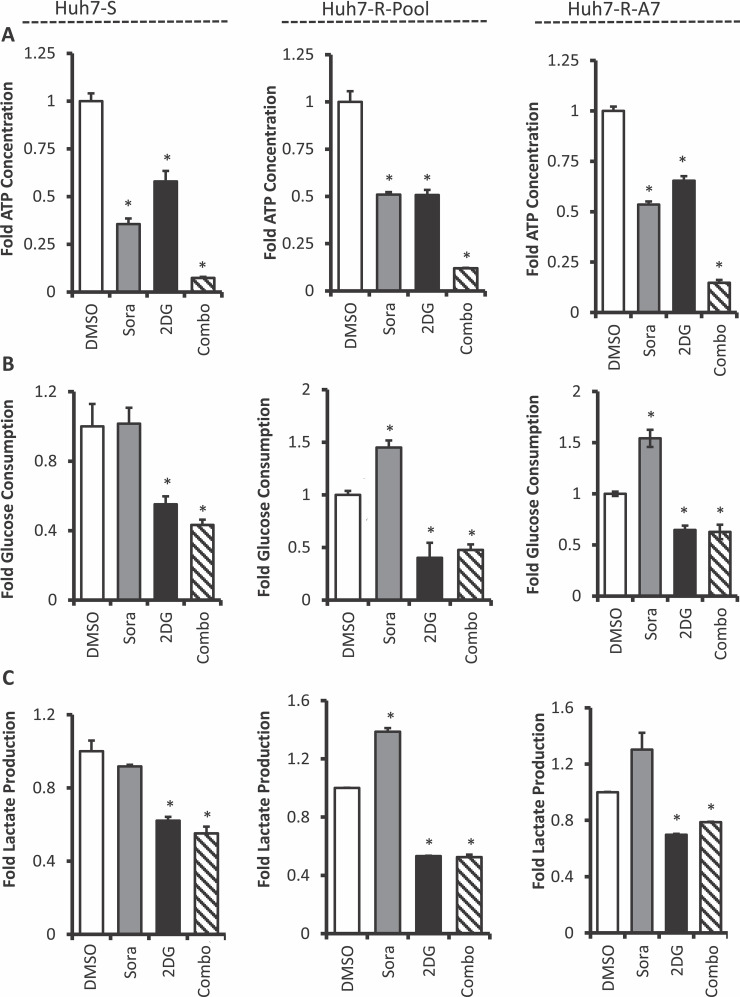
We hypothesized that combination therapy-induced cell cycle arrest was the result of cellular energy depletion leading to activation of AMPK and inhibition of mTOR16–18. To investigate this potential mechanism, ATP levels were measured in cells treated with sorafenib and 2DG alone and in combination. HCC cells treated with sorafenib or 2DG reduced cellular ATP levels at comparable levels compared to untreated cells; however, the combination of both drugs dramatically reduced ATP levels (Fig. 5A). This profound decrease in cellular ATP level was observed in both parental and sorafenib-resistant Huh7 cells. This extreme depletion of cellular energy could be the primary mechanism driving combination therapy-induced cell cycle arrest.
Figure 5.
Cellular energy is depleted upon combination therapy with sorafenib and 2-deoxyglucose. (A) Cellular ATP, (B) glucose consumption, and (C) lactate production were measured in Huh7-S, Huh7-R-Pool, and Huh7-R-A7 cells. Cells were treated with no drug (1% DMSO), sorafenib (8 μM), 2DG (5 mM), or a combination of both for 48 h prior to the measurements. Error bars represent the standard deviation of two biological replicates. *p < 0.05 (t-test) DMSO-treated cells of the corresponding cell line.
We next sought to determine how treatment with 2DG alone and in combination with sorafenib affects glycolytic flux in HCC cells. Parental and sorafenib-resistant cells were treated with sorafenib, 2DG, and a combination of both. After 48 h, the cell culture supernatant was collected and analyzed for glucose and l-lactate concentrations. The results demonstrate that treatment with 2DG alone and in combination with sorafenib significantly reduced glucose consumption and lactate production at comparable levels in Huh7-S cells and prevented sorafenib-induced increase in glucose consumption and lactate production in Huh7-R-Pool and Huh7-R-A7 cells (Fig. 5B and C). The attenuation of glycolysis and oxidative phosphorylation may be a key mechanism driving the synergistic action of sorafenib and 2DG.
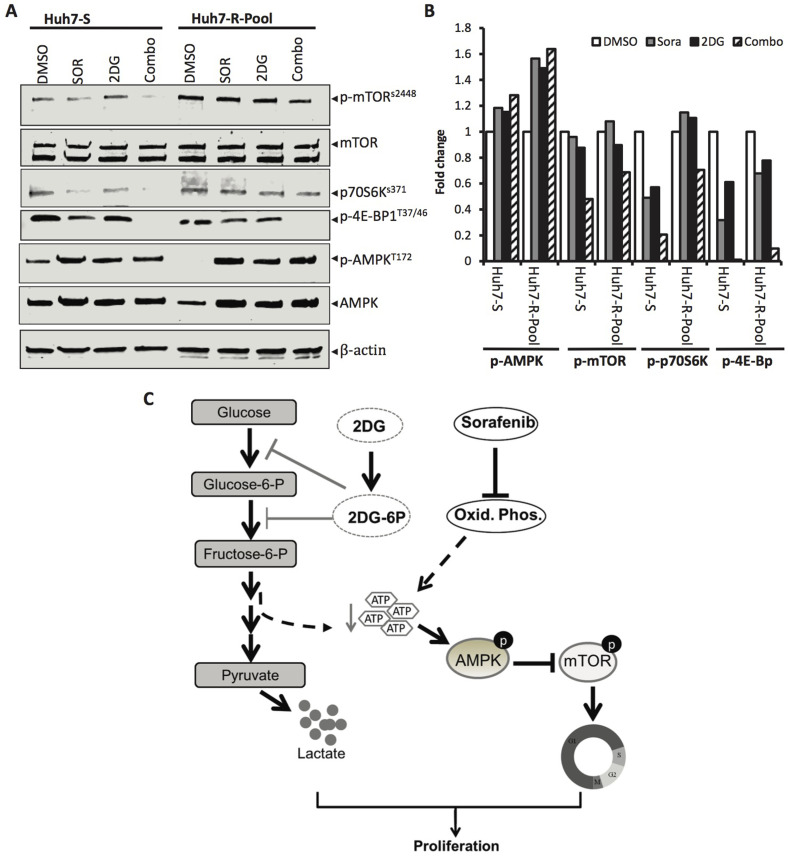
To confirm the effects of ATP depletion on AMPK and mTOR signaling, we preformed immunoblot analysis of whole-cell extracts isolated from Huh7-S and Huh7-R-Pool cells treated with sorafenib and 2DG alone or in combination. The results showed that treatment with both drugs increased phosphorylation of AMPK (Thr172) but decreased phosphorylation of mTOR (Ser2448), as well as its downstream kinases p70S6K (Thr389) and 4E-BP (Thr37/46) in Huh7-S cells (Fig. 6A and B). Although basal levels of both p-mTOR and p70S6K were higher in Huh7-R-pool, combined treatment with sorafenib and 2DG also reduced their levels, albeit to a lower extent than in Huh7-S cells (Fig. 6A and B). Notably, phosphorylation of 4E-BP (Thr37/46) was completely blocked by this drug combination in both cell types. In contrast, 2DG alone minimally affected phosphorylation of any of these kinases, whereas sorafenib alone modestly inhibited phosphorylation of these kinases in Huh7-S cells. Importantly, sorafenib treatment of Huh7-R-Pool cells did not inhibit phosphorylation of mTOR and its downstream kinases (Fig. 6A and B), reinforcing the role of increased glycolytic flux in maintaining sorafenib resistance. Collectively, these results suggest that combination of 2DG and sorafenib depleted cellular ATP levels that could increase the AMP/ATP ratio leading to activation of AMPK and thereby inhibition of mTOR.
Figure 6.
mTOR and its downstream signaling are inhibited by sorafenib and 2DG combination therapy in sorafenib-sensitive and -resistant Huh7 cells. (A) Huh7-S and Huh7-R-Pool cells were treated for 6 h with vehicle (1% DMSO), sorafenib (8 μM), 2DG (5 mM), or a combination of both, and cellular extracts were subjected to Western blot analysis for p-mTOR (S2448), total mTOR, p-p70S6K (Thr389), p-4E-BP (Thr37/46), p-AMPK (Thr172), total AMPK, and β-actin. (B) Quantification of the Western data. (C) Mechanism of synergistic growth inhibition of HCC cells by 2DG and sorafenib. (Left) Glycolysis is inhibited by glucose analog, 2-deoxyglucose (2DG). Both glucose and 2DG are phosphorylated by hexokinase to glucose-6-phosphate and 2DG 6-phosphate, respectively. However, in contrast to glucose-6-phosphate, 2DG 6-phosphate cannot be further metabolized to fructose-6-phosphate by phosphoglucose isomerase, thus blocking glycolysis, lactate, and ATP production. (Right) Sorafenib reduces oxidative phosphorylation leading to reduced ATP levels. This reduction in ATP production increases the AMP/ATP ratio and activates energy sensor AMPK, leading to inhibition of mTOR activation. Inhibition of mTOR also inhibits phosphorylation of its downstream targets 4EBP1 and p70S6K that control protein translation, thereby blocking cell cycle progression. Therefore, the inhibition of cellular ATP levels leads to reduced HCC cell proliferation.
DISCUSSION
There is an urgent need to develop novel therapeutic strategies to extend the lives of patients with advanced HCC. Currently, sorafenib is the only FDA-approved therapy for these patients. However, sorafenib extends the overall survival of HCC patients by only 2.8 months compared to untreated patients5. This lack of clinical efficacy is attributed to an intrinsic resistance of HCC to sorafenib6. In order to elucidate the mechanisms driving sorafenib resistance, we developed sorafenib-resistant HCC cell lines (Fig. 1A). Our initial studies demonstrated that sorafenib-resistant cells display increased rates of glycolytic flux compared to nonresistant parental cells when treated with sorafenib (Fig. 1B and C). Based on this observation, we hypothesized that combining sorafenib with antiglycolytic therapeutics would sensitize HCC cells to sorafenib toxicity. After screening several antiglycolytic drug combinations, the combination of sorafenib and 2DG was identified as the most synergistic therapeutic combination. The combination of 2DG and sorafenib drastically inhibited cell growth in resistant and sensitive cells (Fig. 2).
Our studies also demonstrated that the combination of 2DG and sorafenib significantly reduced colony formation (Fig. 3) and potently induced G0/G1 cell cycle arrest in sorafenib-resistant HCC cells (Fig. 4A and B). Furthermore, combination therapy did not induce apoptosis in parental or sorafenib-resistant HCC cells (data not shown). A previous study by Maher et al. showed that the treatment of osteosarcoma cells with 2DG in hypoxic conditions resulted in cell cycle arrest. The mechanism behind this growth inhibition was attributed to the inhibition of ATP and macromolecule synthesis19. Moreover, there is a strong correlation between cellular ATP levels and AMPK activation resulting in inhibition of mTOR16,18,20, a kinase that responds to altered energy levels to regulate cell cycle progression21. We hypothesized that the depletion of cellular ATP together with reduced mTOR activation could be the mechanism driving the combination therapy-induced cell cycle arrest observed in our studies. However, unlike the study by Maher et al.19, our experiments were not conducted under hypoxic conditions. We believe that sorafenib treatment mimics the effects of hypoxia by inhibiting oxidative phosphorylation and stimulating aerobic glycolysis. It has been shown that clinically relevant levels of sorafenib impair mitochondrial function in rat heart cells22. Additionally, another study demonstrated that sorafenib treatment hinders oxidative phosphorylation and increases aerobic glycolysis in human HCC cell lines2. Taken together, these data suggest that the synergy observed between sorafenib and 2DG is due to the inhibition of oxidative phosphorylation by sorafenib and the inhibition of glycolytic flux by 2DG, which ultimately results in the depletion of cellular energy (Fig. 6C). This hypothesis is supported by our observation that the combination of 2DG and sorafenib significantly depletes cellular ATP level compared to independent drug treatments and untreated cells. Additionally, we demonstrated that combination therapy with 2DG and sorafenib prevents sorafenib-induced stimulation of glycolytic flux. Combined treatment of HCC cells with sorafenib and 2DG displayed the equivalent levels of glucose consumption and lactate production compared to cells treated with 2DG alone. This suggests that 2DG treatment sets a firm limit on the rate of glycolytic flux of HCC cells. The relation between cellular ATP level and cell cycle inhibition is strengthened by the observed activation of AMPK that responds to alterations in cellular energy and inhibition of mTOR as well as its downstream kinases p70S6K and 4E-BP (Fig. 6A and B). Since these kinases are known to regulate cell cycle progression21,23, our data suggest that alteration in the activation state of these kinases as a result of changes in cellular ATP leads to the observed cell cycle arrest (Fig. 4A and B). The drastic reduction in activation of these kinases corroborated with significant inhibition of cell cycle progression following combined treatment compared to treatments with individual drugs.
Although the sorafenib-resistant cell lines are useful tools, they do not accurately model HCC tumors seen in human patients. It is unclear whether the sorafenib-induced increase of glycolytic flux observed in our in vitro studies also occurs in human patients. A recent study to explore the mechanisms of sorafenib resistance in human patients used proteomic analysis of HCC tumor before and during sorafenib therapy to show that the HCC tumor proteome exhibited a relatively higher level of glycolytic enzymes during sorafenib treatment. However, it is unclear whether these changes are due to sorafenib therapy or tumor progression24.
In conclusion, we have demonstrated that the therapeutic combination of sorafenib and 2DG demonstrates remarkable synergy in sorafenib-resistant and -sensitive HCC cell lines. The synergy of 2DG with sorafenib was much greater than other antiglycolytic therapeutics examined in this study. The mechanism driving this synergy appears to be the drastic inhibition of cell cycle progression due to reduction in cellular ATP levels leading to activation of AMPK and consequent reduction of mTOR activation. Our future studies will utilize this synergistic combination in a xenograft mouse model. Since independent sorafenib therapy has limited efficacy in human patients, this study is likely to have the potential to move to clinical trials in sorafenib-resistant HCC.
ACKNOWLEDGMENTS
This work was supported, in part, by NIH grant R01CA086978 (S.T.J. and K.G.), and Pelotonia IDEA grant (S.T.J.) and Pelotonia undergraduate Fellowship (R.R.) from the Comprehensive Cancer Center. The authors thank Dr. James Taylor (Fox Chase Cancer Center) for providing Huh7 cells and Dr. Huban Kutay for technical assistance.
Footnotes
The authors declare no conflicts of interests.
REFERENCES
- 1. Fernando J, Malfettone A, Cepeda EB, Vilarrasa-Blasi R, Bertran E, Raimondi G, Fabra A, Alvarez-Barrientos A, Fernandez-Salguero P, Fernandez-Rodriguez CM, Giannelli G, Sancho P, Fabregat I. A mesenchymal-like phenotype and expression of CD44 predict lack of apoptotic response to sorafenib in liver tumor cells. Int J Cancer 2015;136(4):E161–72. [DOI] [PubMed] [Google Scholar]
- 2. Fiume L, Manerba M, Vettraino M, Di Stefano G. Effect of sorafenib on the energy metabolism of hepatocellular carcinoma cells. Eur J Pharmacol. 2011;670(1):39–43. [DOI] [PubMed] [Google Scholar]
- 3. Jemal A, Bray F, Center MM, Ferlay J, Ward E, Forman D. Global cancer statistics. CA Cancer J Clin. 2011;61(2):69–90. [DOI] [PubMed] [Google Scholar]
- 4. Bruix J, Sherman M, American Association for the Study of Liver Diseases. Management of hepatocellular carcinoma: An update. Hepatology 2011;53(3):1020–2. [DOI] [PMC free article] [PubMed] [Google Scholar]
- 5. Llovet JM, Ricci S, Mazzaferro V, Hilgard P, Gane E, Blanc JF, de Oliveira AC, Santoro A, Raoul JL, Forner A, Schwartz M, Porta C, Zeuzem S, Bolondi L, Greten TF, Galle PR, Seitz JF, Borbath I, Häussinger D, Giannaris T. Sorafenib in advanced hepatocellular carcinoma. N Engl J Med. 2008;359(4):378–90. [DOI] [PubMed] [Google Scholar]
- 6. Villanueva A, Llovet JM. Second-line therapies in hepatocellular carcinoma: Emergence of resistance to sorafenib. Clin Cancer Res. 2012;18(7):1824–6. [DOI] [PMC free article] [PubMed] [Google Scholar]
- 7. Chen KF, Chen HL, Tai WT, Feng WC, Hsu CH, Chen PJ, Cheng AL. Activation of phosphatidylinositol 3-kinase/Akt signaling pathway mediates acquired resistance to sorafenib in hepatocellular carcinoma cells. J Pharmacol Exp Ther. 2011;337(1):155–61. [DOI] [PubMed] [Google Scholar]
- 8. Rudalska R, Dauch D, Longerich T, McJunkin K, Wuestefeld T, Kang TW, Hohmeyer A, Pesic M, Leibold J, von Thun A, Schirmacher P, Zuber J, Weiss KH, Powers S, Malek NP, Eilers M, Sipos B, Lower SW, Geffers R, Laufer S, Zender L. In vivo RNAi screening identifies a mechanism of sorafenib resistance in liver cancer. Nat Med. 2014;20(10):1138–46. [DOI] [PMC free article] [PubMed] [Google Scholar]
- 9. Shen YC, Ou DL, Hsu C, Lin KL, Chang CY, Lin CY, Liu SH, Cheng AL. Activating oxidative phosphorylation by a pyruvate dehydrogenase kinase inhibitor overcomes sorafenib resistance of hepatocellular carcinoma. Br J Cancer 2013;108(1):72–81. [DOI] [PMC free article] [PubMed] [Google Scholar]
- 10. Tesori V, Piscaglia AC, Samengo D, Barba M, Bernardini C, Scatena R, Pontoglio A, Castellini L, Spelbrink JN, Maulucci G, Puglisi MA, Pani G, Gasbarrini A. The multikinase inhibitor Sorafenib enhances glycolysis and synergizes with glycolysis blockade for cancer cell killing. Sci Rep. 2015;5:9149. [DOI] [PMC free article] [PubMed] [Google Scholar]
- 11. Pelicano H, Martin DS, Xu RH, Huang P. Glycolysis inhibition for anticancer treatment. Oncogene 2006;25(34):4633–46. [DOI] [PubMed] [Google Scholar]
- 12. Scatena R, Bottoni P, Pontoglio A, Mastrototaro L, Giardina B. Glycolytic enzyme inhibitors in cancer treatment. Expert Opin Investig Drugs 2008;17(10):1533–45. [DOI] [PubMed] [Google Scholar]
- 13. Bai S, Nasser MW, Wang B, Hsu SH, Datta J, Kutay H, Yadav A, Nuovo G, Kumar P, Ghoshal K. MicroRNA-122 inhibits tumorigenic properties of hepatocellular carcinoma cells and sensitizes these cells to sorafenib. J Biol Chem. 2009;284(46):32015–27. [DOI] [PMC free article] [PubMed] [Google Scholar]
- 14. Wang B, Hsu SH, Frankel W, Ghoshal K, Jacob ST. Stat3-mediated activation of microRNA-23a suppresses gluconeogenesis in hepatocellular carcinoma by down-regulating glucose-6-phosphatase and peroxisome proliferator-activated receptor gamma coactivator 1 alpha. Hepatology 2012;56(1):186–97. [DOI] [PMC free article] [PubMed] [Google Scholar]
- 15. Chou TC. Drug combination studies and their synergy quantification using the Chou-Talalay method. Cancer Res. 2010;70(2):440–6. [DOI] [PubMed] [Google Scholar]
- 16. Hardie DG. AMP-activated/SNF1 protein kinases: Conserved guardians of cellular energy. Nat Rev Mol Cell Biol. 2007;8(10):774–85. [DOI] [PubMed] [Google Scholar]
- 17. Hahn-Windgassen A, Nogueira V, Chen CC, Skeen JE, Sonenberg N, Hay N. Akt activates the mammalian target of rapamycin by regulating cellular ATP level and AMPK activity. J Biol Chem. 2005;280(37):32081–9. [DOI] [PubMed] [Google Scholar]
- 18. Hung CM, Garcia-Haro L, Sparks CA, Guertin DA. mTOR-dependent cell survival mechanisms. Cold Spring Harb Perspect Biol. 2012;4(12). [DOI] [PMC free article] [PubMed] [Google Scholar]
- 19. Maher JC, Krishan A, Lampidis TJ. Greater cell cycle inhibition and cytotoxicity induced by 2-deoxy-D-glucose in tumor cells treated under hypoxic vs aerobic conditions. Cancer Chemother Pharmacol. 2004;53(2):116–22. [DOI] [PubMed] [Google Scholar]
- 20. Zhou H, Shang C, Wang M, Shen T, Kong L, Yu C, Ye Z, Luo Y, Liu L, Li Y, Huang S. Ciclopirox olamine inhibits mTORC1 signaling by activation of AMPK. Biochem Pharmacol. 2016;116:39–50. [DOI] [PMC free article] [PubMed] [Google Scholar]
- 21. Fingar DC, Blenis J. Target of rapamycin (TOR): An integrator of nutrient and growth factor signals and coordinator of cell growth and cell cycle progression. Oncogene 2004;23(18):3151–71. [DOI] [PubMed] [Google Scholar]
- 22. Will Y, Dykens JA, Nadanaciva S, Hirakawa B, Jamieson J, Marroquin LD, Hynes J, Patyna S, Jessen BA. Effect of the multitargeted tyrosine kinase inhibitors imatinib dasatinib, sunitinib, and sorafenib on mitochondrial function in isolated rat heart mitochondria and H9c2 cells. Toxicol Sci. 2008;106(1):153–61. [DOI] [PubMed] [Google Scholar]
- 23. Liao G, Gao B, Gao Y, Yang X, Cheng X, Ou Y. Phycocyanin inhibits tumorigenic potential of pancreatic cancer cells: Role of apoptosis and autophagy. Sci Rep. 2016;6:34564. [DOI] [PMC free article] [PubMed] [Google Scholar]
- 24. Dazert E, Colombi M, Boldanova T, Moes S, Adametz D, Quagliata L, Roth V, Terracciano L, Heim MH, Jenoe P, Hall MN. Quantitative proteomics and phosphoproteomics on serial tumor biopsies from a sorafenib-treated HCC patient. Proc Natl Acad Sci USA 2016;113(5):1381–6. [DOI] [PMC free article] [PubMed] [Google Scholar]


