Abstract
mTORC1 signaling has been shown to promote limb skeletal growth through stimulation of protein synthesis in chondrocytes. However, potential roles of mTORC1 in prechondrogenic mesenchyme have not been explored. In this study, we first deleted Raptor, a unique and essential component of mTORC1, in prechondrogenic limb mesenchymal cells. Deletion of Raptor reduced the size of limb bud cells, resulting in overall diminution of the limb bud without affecting skeletal patterning. We then examined the potential role of mTORC1 in chondrogenic differentiation in vitro. Both pharmacological and genetic disruption of mTORC1 significantly suppressed the number and size of cartilage nodules in micromass cultures of limb bud mesenchymal cells. Similarly, inhibition of mTORC1 signaling in chondrogenic ATDC5 cells greatly impaired cartilage nodule formation, and decreased the expression of the master transcriptional factor Sox9, along with the cartilage matrix genes Acan and Col2a1. Thus, we have identified an important role for mTORC1 signaling in promoting limb mesenchymal cell growth and chondrogenesis during embryonic development.
Keywords: mTORC1, Raptor, chondrogenesis, cell size
Introduction
Chondrocytes, the cells responsible for generating cartilages, are important cellular components of mammalian limb skeleton (Long and Ornitz, 2013). Formation of chondrocytes from mesenchymal progenitors, known as chondrogenesis, occurs in both physiological and pathological conditions, such as endochondral bone development, fracture healing, and heterotopic bone formation (Long and Ornitz, 2013). In all cases, chondrogenesis begins with condensation of mesenchymal progenitors caused by increased cell-cell contact (Woods et al., 2007). Subsequently, cells in the center of mesenchymal condensation differentiate into chondrocytes, which express cartilage-specific matrix genes, including collagen II and aggrecan. Previous studies have identified important roles of extracellular signaling pathways and transcriptional factors in chondrogenesis (Long and Ornitz, 2013). In particular, Sox9, a HMG-box-containing transcriptional factor, was found to be essential for chondrogenesis to proceed after the condensation stage, although it is dispensable for initiation of mesenchymal condensation (Barna and Niswander, 2007; Lim et al., 2015). Following chondrogenesis, chondrocytes within the cartilage template undergo an initial proliferation phase and then a maturation process to become hypertrophic chondrocytes. The hypertrophic cartilage is eventually removed and replaced by bone during endochondral bone development (Long and Ornitz, 2013).
Mechanistic target of rapamycin (mTOR), an evolutionarily conserved serine/threonine kinase, functions as a signal integrator for multiple signals, including growth factors, nutrients, and energy (Laplante and Sabatini, 2012; Sengupta et al., 2010b). By doing so, it regulates a variety of cellular processes, such as cell metabolism, growth, differentiation, and survival (Laplante and Sabatini, 2012; Sengupta et al., 2010b). mTOR is present in two functionally distinct protein complexes: mTOR complex 1 (mTORC1) and complex 2 (mTORC2) as a catalytic subunit (Laplante and Sabatini, 2012; Sengupta et al., 2010b). mTORC1 and mTORC2 can be distinguished by their unique components. For example, Raptor and Rictor are only present in mTORC1 and mTORC2, respectively. Ablation of Raptor or Rictor leads to the disruption of mTORC1 or mTORC2 activity both in cell cultures and in animals, indicating that Raptor and Rictor protein are essential for the activity of their respective complexes (Bentzinger et al., 2008; Guertin et al., 2006). Moreover, the complexes have their different downstream effectors (Laplante and Sabatini, 2012; Sengupta et al., 2010b). The two best characterized targets of mTORC1 are p70 S6 kinase (p70S6K) and eukaryotic translation initiation factor 4E binding protein (4EBP1) (Laplante and Sabatini, 2012; Sengupta et al., 2010b).
mTOR pathways have been shown to play important roles in mammalian limb development. Conditional deletion of mTOR with Prx1-Cre caused severely diminished limbs (Chen and Long, 2014). Moreover, deletion of Raptor by the same Cre line largely recapitulated phenotypes exhibited by mTOR knockout mice (Chen and Long, 2014), whereas similar ablation of Rictor only mildly affected limb growth (Chen et al., 2015), indicating that mTORC1 is the major mechanism by which mTOR kinase regulates embryonic limb development. Mechanistically, mTORC1 pathway promotes embryonic skeletal growth through regulating chondrocyte size, hypertrophy, and matrix production (Chen and Long, 2014). However, it still needs to be determined whether mTORC1 controls limb mesenchymal cell growth and chondrogenic differentiation (chondrogenesis).
In this study, by employing both genetic and pharmacological approaches to disrupt mTORC1 signaling, we provided direct evidence that mTORC1 promotes limb bud cell growth and chondrogenesis.
Materials and Methods
Mouse strains
Mouse strains used in this study, including Prx1-Cre and Raptorf/f, have been described previously (Logan et al., 2002; Sengupta et al., 2010a) and were purchased from Jackson Laboratory (Bar Harbor, ME). Production of RapCKO (Prx1Cre; Raptorf/f) is as previously described (Chen and Long, 2014). For timed pregnancies, matings were set up in the late afternoon and mice were checked for vaginal plugs early next morning. The noon of the day when a vaginal plug appeared was designated as embryonic day (E) 0.5. Animal studies were approved by the Animal Studies Committee at Washington University.
H&E staining and whole-mount in situ hybridization
For histology-based analyses, embryonic limbs were dissected out in PBS, fixed in 10% formalin overnight at room temperature, and then processed for paraffin embedding prior to sectioning at 6 μm thickness. H&E staining was performed on paraffin sections following the standard protocols. Whole-mount in situ hybridization was performed as described previously (Lim et al., 2015).
Micromass culture of limb bud mesenchymal cells
Limb bud micromass cultures were performed as previously described (Lim et al., 2015). Briefly, limb buds were dissected out from E11.5 mouse embryos, dissociated into single cells, and reconstituted at a density of 2 × 10⁷ cells/ml. 20 μl cells were spotted onto each well of a 12-well plate, and then allowed to attach for 30 minutes before being cultured in standard medium (DMEM containing 10% FBS and 1% penicillin/streptomycin). Cells were then cultured for 6 days with media changed every other day prior to Alcian blue staining. For rapamycin experiments, cells were first cultured in standard media for 2 days, and then cultured in standard media containing either DMSO or 20 nM rapamcyin for additional 4 days.
ATDC5 cell culture
ATDC5 cells (RIKEN BRC) were maintained in culture medium (DMEM, 5% fetal bovine serum, 1% penicillin/streptomycin). For chondrogenic induction, confluent ATDC5 cells were cultured in differentiation medium supplemented with 50 μg/ml ascorbic acid (Sigma) and 1% ITS premix (Gibco) in the presence of either vehicle (DMSO) or 20 nM rapamycin for indicated times. Media were changed every other day.
Flow cytometry to measure relative cell size
For cell size analysis, E11.5 limb buds were dissociated into single cell suspension, and then stained with propidium iodide (PI) solution. The mean forward scatter height (FSC-H) of 20,000 single live cells was determined by flow cytometry. Histogram plots were created using FlowJo software.
Quantitative RT-PCR (qPCR)
Total RNA was extracted from cells using the Qiagen RNeasy kit (Qiagen) following the manufacturer’s instructions. 1 μg RNA was reverse transcribed to cDNA using an iScript cDNA synthesis kit (Bio-Rad) according to the manufacturer’s instructions. Quantitative RT-PCR was performed with universal SYBR green supermix (Bio-Rad). The following qPCR primers were used in this study: Col2a1 (F: ACTGGTAAGTGGGGCAAGAC, R:CCACACCAAATTCCTGTTCA), Acan (F:CGTGTTTCCAAGGAAAAGGA, R:TGTGCTCGATCAAAGTCCAG), Sox9 (F:AGGAAGCTGGCAGACCAGTA, R:CGTTCTTCACCGACTTCCTC), and Actb (F: GTGACGTTGACATCCGTAAAGA, R: GCCGGACTCATCGTACTCC). The expression levels of Col2a1, Acan, and Sox9 were normalized to Actb.
Alcian Blue Staining
ATDC5 cells or micromass cultures were rinsed with PBS, fixed in Kahle’s fixative for 10 minutes, and then incubated with Alcian blue staining solution (1.0% Alcian blue in 0.1N HCl) for 1 hour at room temperature. Excess stain was washed off with double distilled water.
Statistical Analysis
All quantitative data were presented as mean±standard deviation (S.D.) with a minimum of three independent samples. Statistical significance was determined by two-tailed Student’s t-test. P-values less than 0.05 were considered statistically significant.
Results
Deletion of Raptor in prechondrogeic limb mesenchyme reduces cell size
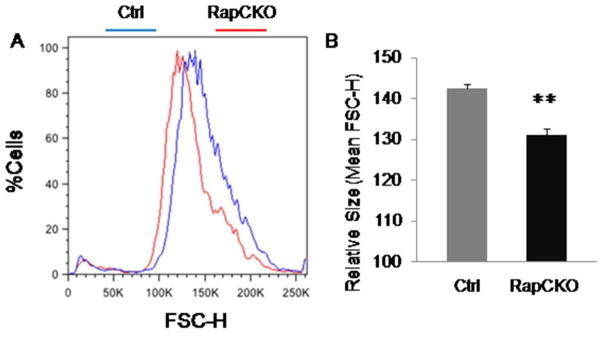
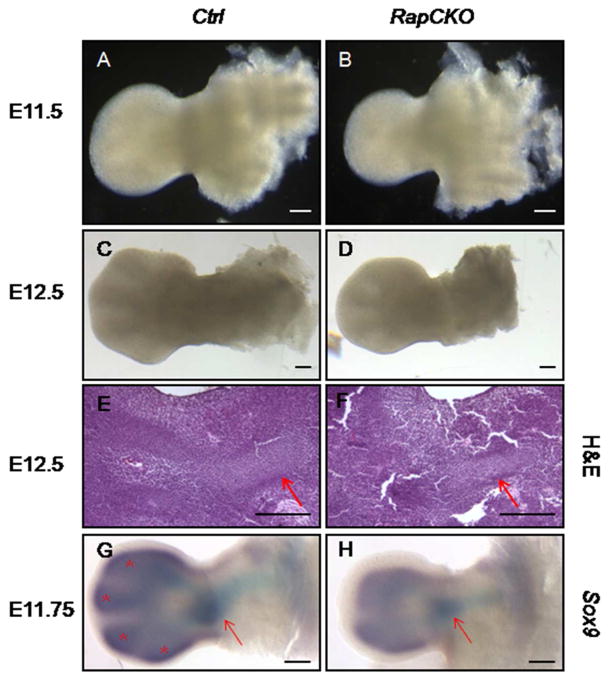
The mTORC1 pathway is known to be an important regulator of cell size (Fingar et al., 2002). We previously demonstrated that mTORC1 signaling increases the size of chondrocyte, but did not investigate the effect of mTORC1 on the prechondrogenic mesenchymal cells (Chen and Long, 2014). Here, we first compared the size of mesenchymal cells isolated from the limb buds of wild-type versus Prx1-Cre; Raptorf/f (RapCKO) littermate embryos at E11.5 prior to overt chondrogenesis. Flow cytometry of viable limb bud cells revealed a clear leftward shift in the forward scatter height (FSC-H) histogram for the RapCKO cells relative to the control cells, indicating a decrease in cell size of the mutant cells (Fig. 1A). Quantification confirmed that the mean FSC-H value of the mutant cells was decreased by ~8.8% (P<0.001) compared to the control (Fig. 1B). Consistent with the smaller cell size, the limbs of the RapCKO embryos at E11.5 and E12.5 were smaller than those of the control littermates (Fig. 2A–D). At E12.5, the digit arrays exhibited a normal configuration in the RapCKO embryo despite the smaller size. Histological sections confirmed that a smaller humerus was present in the mutant limb (Fig. 2E, F). In keeping with the morphology, whole-mount in situ hybridization in E11.75 embryos detected Sox9 expression in the presumptive humerus of the mutant limb bud, albeit within a smaller domain than normal (Fig. 2G, H). However, in the distal limb mesenchyme, discrete Sox9-expressing domains demarcating digit primordia, as evident in the control embryo at E11.75 (denoted by asterisks), were yet to appear in the RapCKO embryo; this could indicate a delay in chondrogenesis or merely a size reduction of the domains beyond the detection limit (Fig. 2G, H). Overall, mTORC1 signaling in the limb mesenchyme is required for the normal size of both individual cells and the whole limb primordium, but appears to be dispensable for skeletal patterning during embryogenesis.
Figure 1. Deletion of Raptor in prechondrogeic limb mesenchyme caused decreased size of limb bud cells.
Limb bud cells were isolated from E11.5 RapCKO embryos and their littermate controls, and then labeled with propidium iodide before FACS analysis. The Relative size of limb bud cells was determined using the parameter mean FSC-H. (A) Overlays of representative FSC-H histograms of RapCKO and control limb bud cells. (B) Mean FSC-H values (± S.D.) of RapCKO and control cells. n=3 for RapCKO embryos; n=4 for control embryos. **: P<0.001.
Figure 2. Genetic deletion of Raptor in prechondrogenic limb mesenchyme led to reduced size of limb buds in vivo.
(A–B) Representative images of forelimb buds from E11.5 wild-type (Ctrl, A) versus RapCKO (B) littermates. (C–D) Representative images of forelimb buds from E12.5 wild-type (Ctrl, C) versus RapCKO (D) littermates. (E–F) H&E staining on paraffin sections of forelimb buds from E12.5 wild-type (Ctrl, E) and RapCKO (F) embryos. Red arrows pointed to humerus primordia. (G–H) Whole-mount in situ hybridization analysis of Sox9 on forelimb buds from E11.75 wild-type (Ctrl, H) and RapCKO (I) embryos. Red arrows pointed to presumptive humerus. Astrisks indicated Sox9 expression in mesenchymal condensations of distal digits. Scale bar: 2 mm.
mTORC1 signaling promotes chondrogenesis in cell cultures
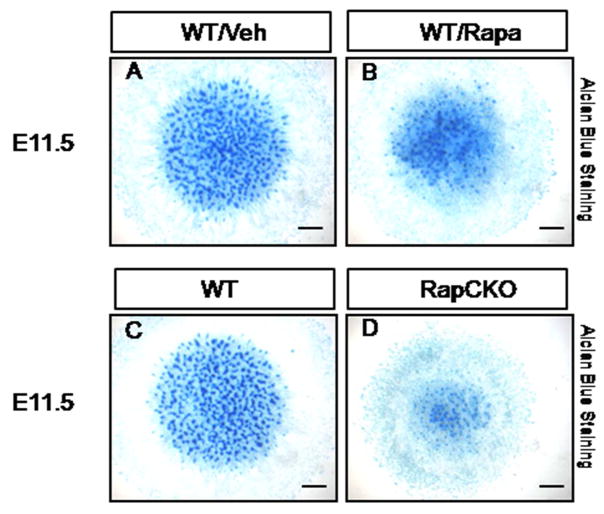
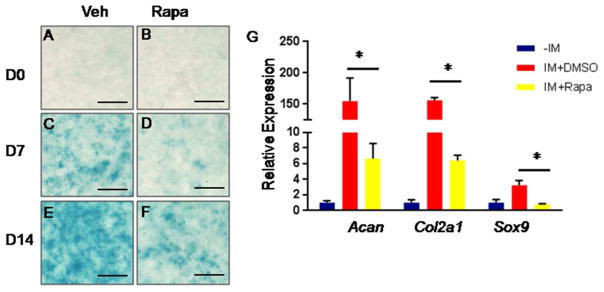
We next test directly whether mTORC1 signaling regulates chondrogenesis. We first performed micromass culture with primary embryonic cells. When cultured at high density, mouse limb bud mesenchymal cells undergo cellular condensation and subsequent differentiation into chondrocytes to form cartilage nodules, mimicking chondrogenesis in vivo (Dong et al., 2010; Lim et al., 2015). We treated micromass cultures prepared from E11.5 embryos with either vehicle or rapamcyin, a pharmacological inhibitor of mTORC1 signaling. Alcian blue staining detected cartilage nodules in both vehicle- and rapamycin-treated micromass cultures by day 6 in culture (Fig. 3A). However, the number and size of cartilage nodules were significantly reduced in rapamycin-treated cultures (Fig. 3B). Moreover, when micromass cultures were performed with limb bud cells from E11.5 RapCKO versus littermate control embryos, few cartilage nodules were detected in the mutant cells (Fig. 3C, D). Finally, we examined the role of mTORC1 in chondrogenesis from ATDC5 cells, a commonly used mouse cell line derived from teratocarcinoma (Atsumi et al., 1990; Shukunami et al., 1996). The vehicle-treated ATDC5 cells as expectedly formed cartilage nodules progressively from day 7 to 14 in culture. Rapamycin however markedly reduced the number of nodules at both time points (Fig. 4A–F). Molecular analyses with qPCR confirmed that rapamycin greatly suppressed the induction of the cartialge matrix genes Acan and Col2a1 after 7 days of chondrogenic culture (Fig. 4G). Importantly, Sox9, a master regulator of chondrogenesis normally induced by the chondrogenic conditions, was no longer up-regulated in the presence of rapamycin (Fig. 4G). Thus, the studies in vitro support the conclusion that mTORC1 signaling promotes chondrogenesis.
Figure 3. Disruption of mTORC1 signaling decreased chondrogenesis in primary limb bud micromass cultures.
(A–B) Alcian blue staining of wild-type limb bud micromass cultures after 4 days of culture in the absence (Veh, A) or the presence of 20 nM Rapamycin (Rapa, B). (C–D) Alcian blue staining of limb bud micromass cultures from E11.5 wild-type (C) and RapCKO (D) littermates. Scale bar: 2 mm.
Figure 4. Pharmacological inhibition of mTORC1 signaling attenuated chondrogenic differentiation of ATDC5 cells.
(A–F) Alcian blue staining of ATDC5 cells before (A, B) or after 7 (C, D) and 14 (E, F) days of chondrogenic differentitaton in the absence (Veh, A, C, E) or the presence of 20 nM rapamycin (Rapa, B, D, F). Scale bar: 1 mm. (G) qPCR analyses of Acan, Col2a1, and Sox9 expression in ATDC5 cells before chondrogenic induction (−IM) or after 7 days of culture in chondrogenic media (IM) supplemented without (IM+DMSO) or with 20 nM rapamycin (IM+Rapa). n=3, *: P<0.05.
Discussion
Although prior studies have identified multiple signaling pathways and transcriptional factors regulating proliferation and survival of mesenchymal progenitors as well as their differentiation into chondrogenic lineage (Long and Ornitz, 2013), such knowledge is still incomplete. In particular, the mechanism by which mesenchymal progenitors sense and integrate environmental cues to adjust their growth and chondrogenic differentiation is still not clear. In this study, we demonstrated that the nutrient-sensing mTORC1 pathway is important for limb bud cell growth and chondrogenic differentiation. There remains a pressing need for therapeutically modifying chondrogenesis in a number of disease conditions. In some instances, enhancing chondrogenesis is desirable, such as repairing cartilage damage in osteoarthritis, while in other situations inhibiting chondrogenesis is preferred, such as eliminating heterotopic bone formation. Therefore, gaining a comprehensive understanding of molecular mechanism underlying chondrogenesis is crucial for developing effective treatments for these diseases.
The present study, for the first time to our knowledge, provided the genetic evidence for an important role of mTORC1 signaling in promoting cell growth and chondrogenesis during early limb development. However, the authors should point out that reduction of cell size in RapCKO limb bud cells may be caused by the delay of the chondrogenesis. But since the majority of limb bud cells in E11.5 are uncommitted mesenchymal cells, the reduction of cell size in RapCKO likely reflects the important role of mTORC1 in regulating limb bud cell growth. The role of mTORC1 signaling in promoting chondrogenesis during early limb development was supported by both in vitro and in vivo data, however, excessive mTORC1 signaling is problematic for cartilage homeostasis (Zhang et al., 2015). For example, in OA cartilages mTORC1 signaling was reported to be hyper-activated, leading to autophagy suppression, subsequently chondrocyte apoptosis and cartilage degradation (Zhang et al., 2015). Surprisingly, inducible cartilage-specific deletion of mTOR in five weeks old mice did not cause any defect in articular cartilage, instead protecting mice from surgically induced osteoarthritis (Zhang et al., 2015). Furthermore, rapamycin treatment of OA chondrocytes increased the expression of anabolic genes including Col2a1 and Acan (Zhang et al., 2015). The previous and the present study together indicate that mTORC1 signaling is differentially required in chondrocyte development versus homeostasis, and that different levels of mTORC1 activity could cause opposite outcomes.
Rapamycin treatment inhibited the induction of Sox9 expression in ATDC5 cells, indicating that mTORC1 signaling may promotes chondrogenesis in part through regulating Sox9 expression. However, how mTORC1 exactly regulates chondrogenesis is still uncertain. Eukaryotic translation initiation factor 4E (eIF4E)-binding protein 1 (4E-BP1) and S6 kinase 1 (S6K1) are two best known targets of mTORC1 pathway. It will be interesting to determine whether 4E-BP1 or S6K1 or both is the downstream mediator of mTORC1 in chondrogenesis.
Supplementary Material
Acknowledgments
Grant Support: Contract grant sponsor: Jiangsu Provincial Special Program of Medical Science, Contract grant number: BL2012004; Contract grant sponsor: The Priority Academic Program Development of Jiangsu High Education Institutions (PAPD); Contract grant sponsor: US National Institute of Health; Contract grant number: AR060456.
This work is supported by the Jiangsu Provincial Special Program of Medical Science (BL2012004), the project funded by the Priority Academic Program Development of Jiangsu High Education Institutions (PAPD), and the NIH grant AR060456 (FL).
References
- Atsumi T, Miwa Y, Kimata K, Ikawa Y. A chondrogenic cell line derived from a differentiating culture of AT805 teratocarcinoma cells. Cell differentiation and development: the official journal of the International Society of Developmental Biologists. 1990;30(2):109–116. doi: 10.1016/0922-3371(90)90079-c. [DOI] [PubMed] [Google Scholar]
- Barna M, Niswander L. Visualization of cartilage formation: insight into cellular properties of skeletal progenitors and chondrodysplasia syndromes. Developmental cell. 2007;12(6):931–941. doi: 10.1016/j.devcel.2007.04.016. [DOI] [PubMed] [Google Scholar]
- Bentzinger CF, Romanino K, Cloetta D, Lin S, Mascarenhas JB, Oliveri F, Xia J, Casanova E, Costa CF, Brink M, Zorzato F, Hall MN, Ruegg MA. Skeletal muscle-specific ablation of raptor, but not of rictor, causes metabolic changes and results in muscle dystrophy. Cell metabolism. 2008;8(5):411–424. doi: 10.1016/j.cmet.2008.10.002. [DOI] [PubMed] [Google Scholar]
- Chen J, Holguin N, Shi Y, Silva MJ, Long F. mTORC2 signaling promotes skeletal growth and bone formation in mice. Journal of bone and mineral research: the official journal of the American Society for Bone and Mineral Research. 2015;30(2):369–378. doi: 10.1002/jbmr.2348. [DOI] [PMC free article] [PubMed] [Google Scholar]
- Chen J, Long F. mTORC1 signaling controls mammalian skeletal growth through stimulation of protein synthesis. Development. 2014;141(14):2848–2854. doi: 10.1242/dev.108811. [DOI] [PMC free article] [PubMed] [Google Scholar]
- Dong Y, Jesse AM, Kohn A, Gunnell LM, Honjo T, Zuscik MJ, O’Keefe RJ, Hilton MJ. RBPjkappa-dependent Notch signaling regulates mesenchymal progenitor cell proliferation and differentiation during skeletal development. Development. 2010;137(9):1461–1471. doi: 10.1242/dev.042911. [DOI] [PMC free article] [PubMed] [Google Scholar]
- Fingar DC, Salama S, Tsou C, Harlow E, Blenis J. Mammalian cell size is controlled by mTOR and its downstream targets S6K1 and 4EBP1/eIF4E. Genes & development. 2002;16(12):1472–1487. doi: 10.1101/gad.995802. [DOI] [PMC free article] [PubMed] [Google Scholar]
- Guertin DA, Stevens DM, Thoreen CC, Burds AA, Kalaany NY, Moffat J, Brown M, Fitzgerald KJ, Sabatini DM. Ablation in mice of the mTORC components raptor, rictor, or mLST8 reveals that mTORC2 is required for signaling to Akt-FOXO and PKCalpha, but not S6K1. Developmental cell. 2006;11(6):859–871. doi: 10.1016/j.devcel.2006.10.007. [DOI] [PubMed] [Google Scholar]
- Laplante M, Sabatini DM. mTOR signaling in growth control and disease. Cell. 2012;149(2):274–293. doi: 10.1016/j.cell.2012.03.017. [DOI] [PMC free article] [PubMed] [Google Scholar]
- Lim J, Tu X, Choi K, Akiyama H, Mishina Y, Long F. BMP-Smad4 signaling is required for precartilaginous mesenchymal condensation independent of Sox9 in the mouse. Developmental biology. 2015;400(1):132–138. doi: 10.1016/j.ydbio.2015.01.022. [DOI] [PMC free article] [PubMed] [Google Scholar]
- Logan M, Martin JF, Nagy A, Lobe C, Olson EN, Tabin CJ. Expression of Cre Recombinase in the developing mouse limb bud driven by a Prxl enhancer. Genesis. 2002;33(2):77–80. doi: 10.1002/gene.10092. [DOI] [PubMed] [Google Scholar]
- Long F, Ornitz DM. Development of the endochondral skeleton. Cold Spring Harbor perspectives in biology. 2013;5(1):a008334. doi: 10.1101/cshperspect.a008334. [DOI] [PMC free article] [PubMed] [Google Scholar]
- Sengupta S, Peterson TR, Laplante M, Oh S, Sabatini DM. mTORC1 controls fasting-induced ketogenesis and its modulation by ageing. Nature. 2010a;468(7327):1100–1104. doi: 10.1038/nature09584. [DOI] [PubMed] [Google Scholar]
- Sengupta S, Peterson TR, Sabatini DM. Regulation of the mTOR complex 1 pathway by nutrients, growth factors, and stress. Molecular cell. 2010b;40(2):310–322. doi: 10.1016/j.molcel.2010.09.026. [DOI] [PMC free article] [PubMed] [Google Scholar]
- Shukunami C, Shigeno C, Atsumi T, Ishizeki K, Suzuki F, Hiraki Y. Chondrogenic differentiation of clonal mouse embryonic cell line ATDC5 in vitro: differentiation-dependent gene expression of parathyroid hormone (PTH)/PTH-related peptide receptor. The Journal of cell biology. 1996;133(2):457–468. doi: 10.1083/jcb.133.2.457. [DOI] [PMC free article] [PubMed] [Google Scholar]
- Woods A, Wang G, Dupuis H, Shao Z, Beier F. Rac1 signaling stimulates N-cadherin expression, mesenchymal condensation, and chondrogenesis. The Journal of biological chemistry. 2007;282(32):23500–23508. doi: 10.1074/jbc.M700680200. [DOI] [PubMed] [Google Scholar]
- Zhang Y, Vasheghani F, Li YH, Blati M, Simeone K, Fahmi H, Lussier B, Roughley P, Lagares D, Pelletier JP, Martel-Pelletier J, Kapoor M. Cartilage-specific deletion of mTOR upregulates autophagy and protects mice from osteoarthritis. Annals of the rheumatic diseases. 2015;74(7):1432–1440. doi: 10.1136/annrheumdis-2013-204599. [DOI] [PubMed] [Google Scholar]
Associated Data
This section collects any data citations, data availability statements, or supplementary materials included in this article.


