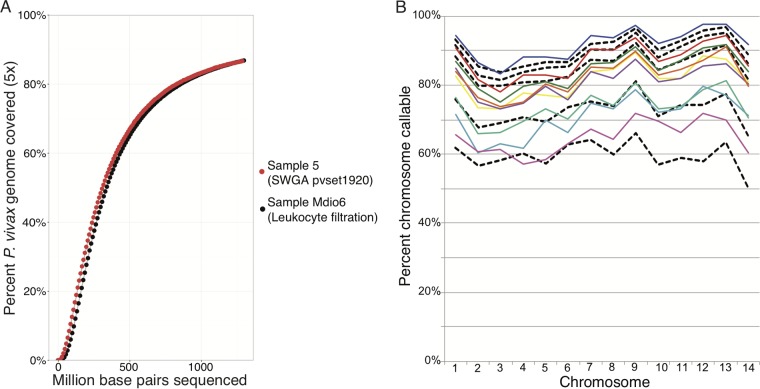
FIG 4 .
Comparison of P. vivax genome coverage generated from samples treated with SWGA and with leukocyte filtration. (A) P. vivax genome coverage (5×) is shown relative to total sequencing depth (in millions of base pairs sequenced) for a sample amplified with pvset1920 (sample 5) and for a leukocyte-filtered sample (Mdio6). Both samples were sequenced on an Illumina HiSeq. (B) The percentages of the 14 chromosomes that were callable (covered by ≥5 reads) for samples that underwent SWGA (colored lines) or leukocyte filtration (black dashed lines) were compared between multiple samples.

