

Abstract
This study aimed to assess the prevalence of tooth wear in different age groups of the Dutch adult population and to determine this tooth wear distribution by gender, socioeconomic class, and type of teeth. Results were compared with the outcomes of a previous study in a comparable population. As part of a comprehensive investigation of the oral health of the general Dutch adult population in 2013, tooth wear was assessed among 1,125 subjects in the city of ‘s-Hertogenbosch. The data collected were subjected to stratified analysis by 5 age groups (25-34, 35-44, 45-54, 55-64, and 65-74 years), gender, socioeconomic class, and type of teeth. Tooth wear was assessed using a 5-point ordinal occlusal/incisal grading scale. The number of teeth affected was higher in older age groups. Men showed more tooth wear than women, and subjects with low socioeconomic status (low SES) showed on average higher scores than those with high SES. Tooth wear prevalence found in this study was higher in all age groups than in the previous study. The present study found prevalences of 13% for mild tooth wear and 80% for moderate tooth wear, leading to the conclusion that these are common conditions in the Dutch adult population. Severe tooth wear (prevalence 6%) may however be characterized as rare. A tendency was found for there to be more tooth wear in older age groups, in men as compared with women, in persons with lower SES, and in the present survey as compared with the previous one.
Key Words: Adult population, Gender, Prevalence, Socioeconomic status, Tooth wear
Tooth wear is a multifactorial condition, leading to the loss of dental hard tissue (enamel and dentin) [Shellis and Addy, 2014]. It can be divided into mechanical wear (attrition and abrasion) and chemical wear (erosion). Attrition is mechanical wear as a result of function and/or parafunction (bruxism), due to tooth-tooth contact. Abrasion is mechanical wear as a result of other factors, such as oral hygiene procedures and habits like nail-biting or pen-biting. Erosion is chemical wear, not caused by caries, as a result of extrinsic or intrinsic acids [Lussi and Carvalho, 2014; Wetselaar and Lobbezoo, 2015]. Both in vitro and in vivo observations show that individual wear mechanisms rarely act in isolation [Shellis and Addy, 2014]. It has recently been stated that erosion is playing an increasingly important role in tooth wear [Johansson et al., 2012], due to the growing consumption of acidic drinks and food. Nevertheless, both mechanical and chemical wear should be taken into account when studying tooth wear.
It is important to distinguish between the qualifying and quantifying aspects of the assessment of tooth wear. Many grading scales are available for the clinical quantification of hard tissue loss [Ganss and Lussi, 2014]. Unfortunately, some grading scales incorporate information about the etiology, such as attrition, abrasion, and erosion. As a result, the quantifying and qualifying aspects of the assessment process may be confused. A list of clinical appearances that can be used to qualify tooth wear - that is, to indicate which types of tooth wear are present - has been proposed by Gandara and Truelove [1999].
Large-scale cross-sectional surveys of oral health among Dutch adults were performed in 2007 and in 2013, where tooth wear was one of the factors assessed. Both the 2007 survey [Schuller et al., 2009] and the 2013 survey [Schuller et al., 2014] made use of a grading scale that is suitable for quantifying all types of tooth wear, though it may be noted that different scales were used in the two surveys.
The results of the various studies in this field are difficult to compare because of the large number of different grading scales in use [Margaritis and Nunn, 2014]. Moreover, most studies have been performed on children, adolescents, and young adults [Jaeggi and Lussi, 2014]. According to the last-mentioned authors, it is nevertheless true that tooth wear is a common condition and there is evidence that its prevalence is growing steadily, especially in younger age groups. They go on to cite reports that males show more tooth wear than females, and that there is a tendency for older people to show more lesions.
The aim of the present study was to assess the prevalence of tooth wear in the Dutch adult population in different age groups, for both genders, in different socioeconomic classes, and for different types of teeth. These results were compared with the outcomes of the above-mentioned 2007 study.
Materials and Methods
Study Sample and Recruitment
Data were collected from April 2013 to November 2013 as part of a large survey of oral health and preventive behavior among Dutch adults (divided for the purpose of the study into 5 age groups: 25-34, 35-44, 45-54, 55-64, and 65-74 years). The survey was performed in ‘s-Hertogenbosch, a medium-sized city in the southern Netherlands that can be considered to be representative of the general Dutch population in terms of sociodemographic indicators [Truin et al., 1987]. Health insurance companies were asked [under the authority of the National Health Care Institute (Zorginstituut Nederland)] to provide the names and addresses of their clients. A total of 87,075 names and addresses was provided. A stratified sample of 6,904 people (including edentulous individuals) was selected. All those eligible to participate in the study were invited to visit a mobile dental examination facility temporarily located in their city of residence. Eighty-two percent of those invited to participate (5,661 individuals) stated that they did not wish to take part (51% of this group were male, 36% had higher education, 77% indicated that they did not have enough time or interest to participate, and 10% were afraid of dental treatment). Individuals without any teeth at all (n = 118) were the only ones excluded from the study. This left a study population of 1,125 adults (56% of whom were female). This study was judged by the Central Committee on Research Involving Human Subjects not to fall under the provisions of the Medical Research Involving Human Subjects Act. It was furthermore decided that the study met all requirements of the Personal Data Protection Act (Approval No. m1501261).
Procedure
All participants filled in a questionnaire giving details of their sociodemographic and dental status, and their dietary and oral hygiene behavior, and underwent an oral health assessment in a dental chair, performed with the aid of halogen light, a mirror, a blunt probe, and compressed air. To make the examination less demanding for the participants, tooth wear was scored only on all elements of the first quadrant (the molars, premolars, cuspids, and incisors on the right side of the maxilla) and the third quadrant (all teeth on the left side of the mandible), or only in the second quadrants (all teeth on the left side of the maxilla) and the fourth quadrant (all teeth on the right side of the mandible). The first and third quadrants were examined in participants whose serial number (assigned at random to each participant) was odd, while participants with an even serial number had their second and fourth quadrants examined. Wisdom teeth were excluded from the survey. The examinations were performed by experienced, calibrated dentists, and internal validity was assessed by performing a second measurement on 133 participants (8.3%) [Schuller et al., 2014].
Grading
The above-mentioned 2007 study was performed in a comparable population sample, also in ‘s-Hertogenbosch [Schuller et al., 2009]. A 5-point ordinal occlusal/incisal grading scale was used there (0 = no loss of enamel surface characteristics; 1 = loss of enamel surface characteristics; 2 = loss of enamel, exposing dentin over less than one third of the surface; 3 = loss of enamel, exposing dentin over more than one third of the surface; 4 = complete loss of enamel) [Smith and Knight, 1984]. In the present survey, tooth wear was measured on another 5-point ordinal occlusal/incisal grading scale (0 = no wear; 1 = wear confined to enamel; 2 = wear into dentin <1/3 of crown height; 3 = wear into dentin >1/3 but <2/3 of crown height; 4 = wear into dentin >2/3 of crown height [Lobbezoo and Naeije, 2011]; fig. 1). These grades were given the following descriptive names: grade 1 = mild, grade 2 = moderate, grade 3 = severe, and grade 4 = extreme. In order to be able to compare the results of these two surveys, all tooth wear grades were converted into a ‘skeleton index’, as proposed by Van‘t Spijker et al. [2009]. The results of this conversion are as follows: skeleton index 0 (2013 grade 0 = 2007 grade 0); skeleton index 1 (2013 grade 1 = 2007 grade 1); skeleton index 2 (2013 grade 2 = 2007 grades 2 and 3); skeleton index 3 (2013 grade 3 = 2007 grade 4); skeleton index 4 (2013 grade 4 = not scored in 2007). No data on tooth wear in premolars were available for 2007.
Fig. 1.
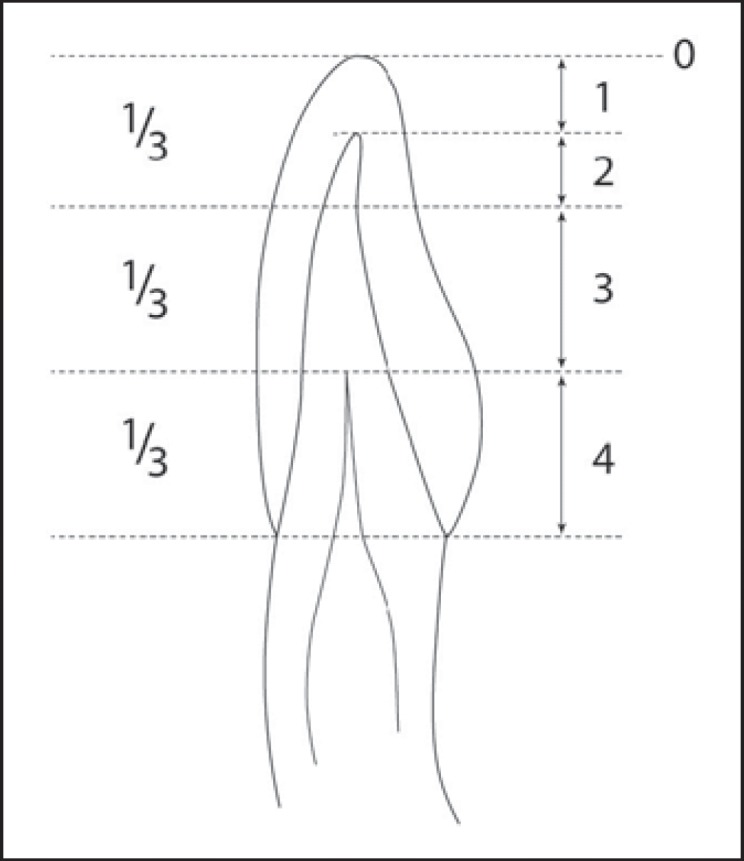
Schematic representation of the occlusal/incisal tooth wear grading system according to Lobbezoo and Naeije [2001].
Statistical Analysis
In both surveys (2007 and 2013), participants were stratified in 2 groups on the basis of socioeconomic status (high-SES and low-SES) and in 5 age groups (25-34, 35-44, 45-54, 55-64, and 65-74 years). Education level was used as a proxy for SES and was divided into ‘low’ (up to secondary vocational education) and ‘high’ (higher than secondary vocational education).
The tooth wear score for each participant was determined as the highest wear grade found in the two quadrants examined. Kruskal-Wallis tests were used to compare the mean tooth wear scores in different age groups, while Mann-Whitney U tests were used to identify possible differences in mean tooth wear scores between genders, socioeconomic statuses, tooth types, and the two surveys considered here. All analyses were performed using IBM SPSS Statistics 22.0 software (IBM Corp., Armonk, N.Y., USA).
Results
Response Rates
In 2013, a total of 1,125 respondents from the original stratified sample of 6,904 persons invited to participate in the survey filled in the questionnaire and underwent the clinical examination; this corresponds to a response rate of 16.3%. The response rate in 2007 was 15.5% (1,018 out of an initial sample of 6,560). Female respondents made up 56.4% of the study population in 2013, and 56.0% in 2007. The percentages of respondents with low SES in the age groups 25-34, 35-44, 45-54, 55-64, and 65-74 years were 27, 38, 47, 58, and 54%, respectively, in 2013, and 38, 52, 46, 61, and 70% in 2007.
Age
Mean tooth wear scores increased with age, from 1.67 in the youngest age group (25-34) to 2.07 in the oldest age group (65-74; table 1). The mean score for the entire population was 1.90 (table 1). Higher individual scores were found in older age groups (χ2 = 152.0, p < 0.001). Further analysis of the data showed that this observation applied to all types of teeth: molars (χ2 = 12.57, p = 0.014), premolars (χ2 = 87.34, p < 0.001), cuspids (χ2 = 140.39, p < 0.001), and incisors (χ2 = 131.37, p < 0.001).
Table 1.
Mean tooth wear scores and percentages of highest tooth wear scores observed in different age groups and SES groups (Mann-Whitney U tests)
| Age group | n | Mean ± SD | Z | p | Highest individual score |
|||
|---|---|---|---|---|---|---|---|---|
| grade 0 | grade 1 | grade 2 | grade 3 | |||||
| 25 – 34 years | ||||||||
| Total | 217 | 1.67 ± 0.55 | 0.70 | 0.48 | 5 (2%) | 66 (31%) | 142 (65%) | 4 (2%) |
| Low SES | 59 | 1.62 ± 0.61 | 3 (5.1%) | 18 (30.5%) | 37 (62.7%) | 1 (1.7%) | ||
| High SES | 158 | 1.69 ± 0.53 | 2 (1.3%) | 48 (30.4%) | 105 (66.5%) | 3 (1.9%) | ||
| 35 – 44 years | ||||||||
| Total | 234 | 1.79 ± 0.46 | 0.37 | 0.71 | 4 (2%) | 45 (19%) | 182 (78%) | 3 (1%) |
| Low SES | 88 | 1.78 ± 0.49 | 3 (3.4%) | 13 (14.8%) | 72 (81.8%) | 0 (0%) | ||
| High SES | 146 | 1.79 ± 0.47 | 1 (0.7%) | 32 (21.9%) | 110 (75.3%) | 3 (2.1%) | ||
| 45 – 54 years | ||||||||
| Total | 249 | 1.97 ± 0.39 | 0.29 | 0.74 | 2 (<1%) | 17 (7%) | 219 (88%) | 11 (4%) |
| Low SES | 116 | 1.97 ± 0.36 | 0 (0%) | 9 (7.8%) | 101 (87.1) | 6 (5.2%) | ||
| High SES | 133 | 1.95 ± 0.40 | 2 (1.5%) | 8 (6.0%) | 118 (88.7%) | 5 (3.8%) | ||
| 55 – 64 years | ||||||||
| Total | 272 | 2.02 ± 0.35 | 1.67 | 0.10 | 2 (<1%) | 8 (3%) | 241 (89%) | 21 (8%) |
| Low SES | 157 | 2.07 ± 0.30 | 0 (0%) | 2 (1.3%) | 142 (90.4%) | 13 (8.3%) | ||
| High SES | 115 | 1.98 ± 0.44 | 2 (1.7%) | 6 (5.2%) | 99 (86.1%) | 8 (7.0%) | ||
| 65 – 74 years | ||||||||
| Total | 153 | 2.07 ± 2.07 | 1.25 | 0.21 | 3 (2%) | 6 (4%) | 126 (82%) | 18 (12%) |
| Low SES | 83 | 2.10 ± 0.43 | 0 (0%) | 4 (4.8%) | 67 (80.7%) | 12 (14.5%) | ||
| High SES | 70 | 1.97 ± 0.54 | 3 (4.3%) | 2 (2.9%) | 59 (84.3%) | 6 (8.6%) | ||
| All | ||||||||
| Total | 1,125 | 1.90 ± 0.47 | 3.52 | <0.001 | 16 (1%) | 142 (13%) | 910 (80%) | 57 (6%) |
| Low SES | 503 | 1.95 ± 0.45 | 6 (1.2%) | 46 (9.1%) | 419 (83.3%) | 32 (6.4%) | ||
| High SES | 622 | 1.85 ± 0.49 | 10 (1.6%) | 96 (15.4%) | 491 (78.9%) | 25 (4.0%) | ||
Gender
The mean tooth wear scores were 2.00 for men and 1.81 for women (Z = 7.20, p < 0.001; table 2). A similar difference was found in all age groups; only in the 45- to 54-year age group was this difference not significant. The higher tooth wear scores in men were observed in all types of teeth (molars: Z = 2.76, p = 0.006; premolars: Z = 4.54, p < 0.001; cuspids: Z = 9.91, p < 0.001; incisors: Z = 7.15, p < 0.001).
Table 2.
Mean tooth wear scores and percentages of highest individual scores, by age group and gender (Mann-Whitney U tests)
| Age group | n | Mean ± SD | Z | p | Highest individual score |
|||||||||||
|---|---|---|---|---|---|---|---|---|---|---|---|---|---|---|---|---|
| grade 0 | grade 1 | grade 2 | grade 3 | |||||||||||||
| 25 – 34 years | ||||||||||||||||
| Male | 71 | 1.85 ± 0.40 | 0 (0%) | 12 (17%) | 58 (82%) | 1 (1%) | ||||||||||
| Female | 146 | 1.58 ± 0.60 | 5 (3%) | 54 (37%) | 84 (58%) | 3 (2%) | ||||||||||
| Total | 217 | 1.67 ± 0.55 | 3.34 | 0.001 | 5 (2%) | 66 (30%) | 142 (66%) | 4 (2%) | ||||||||
| 35 – 44 years | ||||||||||||||||
| Male | 90 | 1.91 ± 0.41 | 2 (2%) | 6 (7%) | 80 (89%) | 2 (2%) | ||||||||||
| Female | 144 | 1.71 ± 0.50 | 2 (2%) | 39 (27%) | 102 (71%) | 1 (<1%) | ||||||||||
| Total | 234 | 1.79 ± 0.48 | 3.57 | <0.001 | 4 (2%) | 45 (19%) | 182 (78%) | 3 (1%) | ||||||||
| 45 – 54 years | ||||||||||||||||
| Male | 118 | 1.96 ± 0.44 | 2 (2%) | 8 (7%) | 101 (85%) | 7 (6%) | ||||||||||
| Female | 131 | 1.97 ± 0.29 | 0 (0%) | 9 (7%) | 118 (90%) | 4 (3%) | ||||||||||
| Total | 249 | 1.96 ± 0.38 | 0.24 | 0.81 | 2 (1%) | 17 (7%) | 219 (88%) | 11 (4%) | ||||||||
| 55 – 64 years | ||||||||||||||||
| Male | 131 | 2.11 ± 0.34 | 0 (0%) | 1 (1%) | 114 (87%) | 16 (12%) | ||||||||||
| Female | 141 | 1.96 ± 0.38 | 2 (1%) | 7 (5%) | 127 (90%) | 5 (4%) | ||||||||||
| Total | 272 | 2.03 ± 0.37 | 3.50 | <0.001 | 2 (<1%) | 8 (3%) | 241 (89%) | 21 (8%) | ||||||||
| 65 – 74 years | ||||||||||||||||
| Male | 81 | 2.12 ± 0.60 | 3 (4%) | 1 (1%) | 60 (74%) | 17 (21%) | ||||||||||
| Female | 72 | 1.94 ± 0.29 | 0 (0%) | 5 (7%) | 56 (92%) | 1 (1%) | ||||||||||
| Total | 153 | 2.04 ± 0.49 | 3.21 | 0.001 | 3 (2%) | 6 (4%) | 126 (82%) | 18 (12%) | ||||||||
| All | ||||||||||||||||
| Male | 491 | 2.00 ± 0.45 | 6 (1%) | 24 (6%) | 348 (84%) | 36 (9%) | ||||||||||
| Female | 634 | 1.81 ± 0.48 | 8 (2%) | 98 (18%) | 412 (78%) | 13 (2%) | ||||||||||
| Total | 1,125 | 1.89 ± 0.47 | 7.20 | <0.001 | 16 (1%) | 142 (13%) | 910 (81%) | 57 (5%) | ||||||||
Socioeconomic Status
There is a tendency for low-SES participants to have higher mean tooth wear scores, especially in the age groups 55-65 and 65-74 years; in the youngest age group (25-34 years), low-SES participants actually show slightly lower tooth wear (table 1). However, this difference was only statistically significant for the study population as a whole (Z = 3.52, p < 0.001). Further analysis of the data revealed that the difference between SES groups could be observed in molars (Z = 2.47, p = 0.014), cuspids (Z = 4.65, p < 0.001), and incisors (Z = 2.60, p = 0.001). No significant differences were found in premolars (Z = 0.93, p = 0.35).
Comparison between the 2007 and 2013 Surveys
Tooth wear data from the 2007 and 2013 surveys are presented in table 3. It will be seen that mean tooth wear scores were higher in 2013 than in 2007 for all types of teeth. This difference was found in molars (Z = 9.89, p < 0.001), cuspids (Z = 19.25, p < 0.001), and incisors (Z = 14.25, p = 0.007), and in all age groups.
Table 3.
Comparison of mean tooth wear scores in 2007 and 2013, by age group and tooth type (Mann-Whitney U tests)
| Age group | Molars |
Cuspids |
Incisors |
|||||||||
|---|---|---|---|---|---|---|---|---|---|---|---|---|
| 2007 | 2013 | Z | p | 2007 | 2013 | Z | p | 2007 | 2013 | Z | p | |
| 25 – 34 years | 1.22 (n = 183) | 1.30 (n = 217) | 3.13 | 0.002 | 1.14 (n = 184) | 1.47 (n = 214) | 7.26 | <0.001 | 1.14 (n = 170) | 1.26 (n = 217) | 2.79 | 0.005 |
| 35 – 44 years | 1.13 (n = 227) | 1.32 (n = 234) | 5.34 | <0.001 | 1.20 (n = 241) | 1.59 (n = 230) | 8.89 | <0.001 | 1.27 (n = 216) | 1.56 (n = 233) | 6.98 | <0.001 |
| 45 – 54 years | 1.05 (n = 239) | 1.46 (n = 249) | 7.87 | <0.001 | 1.27 (n = 291) | 1.72 (n = 239) | 10.44 | <0.001 | 1.35 (n = 267) | 1.73 (n = 243) | 9.18 | <0.001 |
| 55 – 64 years | 1.06 (n = 126) | 1.34 (n = 272) | 4.06 | <0.001 | 1.43 (n = 186) | 1.86 (n = 266) | 9.12 | <0.001 | 1.54 (n = 182) | 1.84 (n = 267) | 6.61 | <0.001 |
| 65 – 74 years | 1.11 (n = 55) | 1.15 (n = 153) | 0.52 | 0.60 | 1.42 (n = 100) | 1.82 (n = 135) | 6.37 | <0.001 | 1.60 (n = 95) | 1.81 (n = 156) | 3.70 | <0.001 |
| Total | 1.12 (n = 830) | 1.33 (n = 1,125) | 9.89 | <0.001 | 1.28 (n = 1,002) | 1.69 (n = 1,084) | 19.25 | <0.001 | 1.35 (n = 930) | 1.64 (n = 1,116) | 14.25 | 0.007 |
Differences in tooth wear scores for premolars are not presented in this table, because this type of tooth wear was not scored in the 2007 survey.
Discussion
The aim of the present study was to assess the prevalence of tooth wear in the Dutch adult population as a function of various factors. More tooth wear was found in older age groups than in younger age groups (for all types of teeth); men showed more tooth wear than women (again, for all types of teeth), and low-SES participants showed higher tooth wear scores than high-SES participants, especially above the age of 55 (for all types of teeth, except premolars). In addition, mild and moderate tooth wear turned out to be common conditions, with prevalences of 13 and 80%, respectively, while severe tooth wear (with a prevalence of 6%) was rare. Comparison of the outcomes of the 2007 and 2013 surveys, which were performed in similar populations, showed higher scores in all age groups for molars, cuspids, and incisors in 2013.
One limitation of these two surveys is that all participants were recruited from a single Dutch city (‘s-Hertogenbosch), which may restrict the external validity of the tooth wear prevalence data obtained. However, ‘s-Hertogenbosch was found to be representative of the Netherlands as a whole in 1987 [Truin et al., 1987]. Since the demographics of the city (such as age distribution, percentage of migrants, and percentage composition of households) are still comparable with those for the Netherlands as a whole [as may be seen by consulting Statline (Statistics Netherlands) and Eurostat], it is reasonable to assume that ‘s-Hertogenbosch is still quite representative of the country as a whole. Of course, it remains true that there may be some regional differences concerning such matters as SES, levels of oral health, and accessibility of oral health professionals.
There are only relatively few epidemiological studies on tooth wear that examine tooth wear in older age groups, while also considering the influence of gender and SES. These include a survey in Sweden (Hugoson et al. [1988], 585 participants, 7 age groups, Hugoson index used to measure tooth wear, influence of SES not determined), 4 surveys in the UK (Donachie and Walls [1995], 586 participants, 4 age groups, using the tooth wear index TWI; Smith and Robb [1996], 1,007 participants, 6 age groups, TWI, influence of SES not determined; Kelly et al. [2000], 6,024 participants, 7 age groups, modified O'Brien index [O'Brien, 1994]; Steele et al. [2011], 6,469 participants, 7 age groups, modified O'Brien index), an Israeli survey (Vered et al. [2014], 500 participants, 5 age groups, scored using the basic erosive wear examination BEWE), a Japanese survey (Kitasako et al. [2015], 1,108 participants, 6 age groups, combination of TWI and Fares index [Fares et al., 2009], influence of SES not determined), and a survey in the USA (Okunseri et al. [2015], 3,773 participants, 6 age groups, modified TWI). Factors determining the choice of grading scale, the effect of gender and SES on observed tooth wear, and observed prevalence over time will be discussed below.
As mentioned above, many different grading scales have been used in the various studies of tooth wear, which renders an unequivocal comparison of these studies difficult [Margaritis and Nunn, 2014]. Each of these grading systems has its own advantages, disadvantages, and limitations. There is a strong need for a merged, widely used grading system. A group of experts [Bartlett et al., 2008] recently designed the BEWE, which has the potential to become such a widely used grading system. However, it was decided not to use the BEWE in the present survey, because we wanted to assess tooth wear as a whole and not only erosive tooth wear. Furthermore, it was decided to gather separate information on different types of teeth (molars, premolars, cuspids, and incisors) and not to sum the scores over each sextant as is done in the BEWE. In addition, it may be impossible to calculate the BEWE in elderly people because of missing teeth in one or more sextants. Finally, the Lobbezoo and Naeije grading scale is widely used in the Netherlands, and the clinicians who performed the examination in our 2013 survey were already familiar with it, so this is the one we ultimately decided to use.
The 2007 survey in ‘s-Hertogenbosch used the tooth wear index (TWI), a scale that grades the amount of surface area in the horizontal plane involved in the wear. This allows the grading of wear in the early stages, but grading of loss of clinical crown height (in the vertical plane) is essential for further differentiation of the ongoing progress of tooth surface loss. This has already been mentioned by other investigators studying tooth wear in elderly people [Donachie and Walls, 1995, 1996] and was the reason why the scale used in the 2013 survey also grades tooth surface loss in a vertical direction [Lobbezoo and Naeije, 2001]. This allows more stages of clinical crown height loss to be differentiated, which was deemed essential since it was expected that tooth wear would be severer in the older age groups.
No matter what grading scale was used, all studies concluded that tooth wear increases with age. Since tooth wear is an irreversible process, this finding was to be expected and is in line with a review of the prevalence of tooth wear in adults [Van‘t Spijker et al., 2009].
It was also a common finding in all studies that men show more tooth wear than women; no explanation for this has yet been given in the literature. There is no evidence that the tooth structure differs between men and women, or that there are any differences in the composition of saliva. Concerning the diet, there is evidence that men consume more acidic drinks than females, both in adolescents [Hasselkvist et al., 2016], and in adults [Heuer et al., 2015], resulting in more (chemical) tooth wear. In addition, it might be hypothesized that men's masticatory muscles exert higher forces (for a review, see Van der Glas et al. [1996]), leading to more mechanical tooth wear.
Studies that considered the effect of SES on tooth wear showed equivocal findings. Some reported higher tooth wear scores in low-SES groups [Donachie and Walls, 1995; Okunseri et al., 2015], which is largely in line with the present findings, while others reported no difference [Kelly at al., 2000; Steele et al., 2011; Vered et al., 2014]. It could be hypothesized that people belonging to the lower-SES groups know less about the health aspects of their diet [Sichert-Hellert et al., 2011] and may therefore tend to eat more erosive food.
Striking variations were reported in the observed prevalence of tooth wear found in different studies. Some researchers came to the conclusion that as many as 75% [Kitasako et al., 2015], or at least half of the population studied [Vered et al., 2014], did not show erosive tooth wear, while others stated that mild and moderate tooth wears are common conditions but that severe tooth wear is rare [Hugoson et al., 1988; Smith and Robb, 1996; Kelly et al., 2000; Steele et al., 2011; Okunseri et al., 2015]. This latter view is in line with the present study as well as with that expressed in a recent review, in which the authors concluded that tooth wear is a common clinical finding [Van‘t Spijker et al., 2009]. The observed differences in the prevalence of tooth wear can perhaps be explained by the distinction drawn between erosive (chemical) tooth wear and mechanical tooth wear, in addition to the fact that the reliance on dentin exposure to indicate the extent or severity of tooth wear is not reliable [Holbrook and Ganss, 2008] together with the difficulty of diagnosing exposed dentin [Ganss et al., 2006].
A further aim of this study was to estimate the variation of the prevalence of tooth wear with time, which was done by comparing the results of the 2007 and 2013 surveys. This led to the conclusion that mean tooth wear scores increased between 2007 and 2013 for all types of teeth that were included in both surveys. In fact, the present study may have underestimated this increase, since the percentage of individuals with low SES was lower in 2013 than in 2007, and the present study indicates a slight negative correlation of SES with tooth wear.
To our knowledge, the only comparison of the prevalence of tooth wear in a comparable survey over a considerable time span was performed in the UK. A 2009 survey [Steele and O'Sullivan, 2011] reported a higher prevalence of tooth wear than a 1998 survey [Kelly et al., 2000]. The prevalence of any wear had increased to 77% in 2009, and that of moderate tooth wear to 15%, while severe wear remained rare (2% in 2009) [Kelly et al., 2000; Steele and O'Sullivan, 2011]. The two Dutch surveys of 2007 and 2013 represent the second time that such a comparison has been made. The prevalence of mild tooth wear found here had increased to 13% and that of moderate tooth wear to 80%, while severe tooth wear remained rare (6%). It is difficult to compare the UK surveys with the Dutch ones, since the UK studies only recorded the observed wear of the 6 upper front teeth and the most affected surface of each of the 6 lower anterior teeth, while the Dutch surveys examined the occlusal/incisal surfaces of a variety of different types of teeth.
The two Dutch surveys showed that tooth wear in molars, cuspids and incisors had increased between 2007 and 2013 in all age groups. It can be hypothesized that the overall higher tooth wear scores were due to greater chemical wear [Johansson et al., 2012]. Unfortunately, the oral health survey of which the tooth wear study formed a part did not allow the collection of detailed information on the diet of the participants or the possibility that some of them might be suffering from gastroesophageal reflux disease. Hence, it was impossible to ascertain whether these extrinsic or intrinsic causes or erosive tooth wear played a role in determining the findings of this survey. The same is true of possible etiological factors for mechanical tooth wear, like parafunctional activities.
Prevalence data show that mild and moderate tooth wear is a common condition in the Dutch adult population, while severe or extreme tooth wear is rare. The prevalence of tooth wear in the Dutch adult population has increased between 2007 and 2013. More tooth wear was found in older age groups (for all types of teeth), and in men as compared with women (for all types of teeth). Persons with lower SES showed more tooth wear than those with a high SES.
Author Contributions
P.W., E.J.H.V., F.L., and A.A.S. conceived and designed the study. E.J.H.V. and A.A.S. performed the clinical examination. P.W., E.J.H.V., C.M.V., and A.A.S. analyzed the data. P.W. and E.J.H.V. wrote the paper. C.M.V., F.L., and A.A.S. subjected the main intellectual content of the manuscript to critical review. All authors read and approved the final manuscript.
Disclosure Statement
The authors declare no conflicts of interest.
Acknowledgments
This research was financed by the Dutch National Health Care Institute (ZIN).
References
- 1.Bartlett D, Ganss C, Lussi A. Basic Erosive Wear Examination (BEWE): a new scoring system for scientific and clinical needs. Clin Oral Invest. 2008;12(suppl 1):S65–S68. doi: 10.1007/s00784-007-0181-5. [DOI] [PMC free article] [PubMed] [Google Scholar]
- 2.Donachie MA, Walls AW. Assessment of tooth wear in an ageing population. J Dent. 1995;23:157–164. doi: 10.1016/0300-5712(95)93573-k. [DOI] [PubMed] [Google Scholar]
- 3.Donachie MA, Walls AW. The tooth wear index: a flawed epidemiological tool in an ageing population group. Community Dent Oral Epidemiol. 1996;24:152–158. doi: 10.1111/j.1600-0528.1996.tb00833.x. [DOI] [PubMed] [Google Scholar]
- 4.Fares J, Shirodaria S, Chiu K, Ahmad N, Sherriff M, Bartlett D. A new index of tooth wear. Reproducibility and application to a sample of 18- to 30-year-old university students. Caries Res. 2009;43:119–125. doi: 10.1159/000209344. [DOI] [PubMed] [Google Scholar]
- 5.Gandara BK, Truelove EL. Diagnosis and management of dental erosion. J Contemp Dent Pract. 1999;1:16–23. [PubMed] [Google Scholar]
- 6.Ganss C, Klimek J, Lussi A. Accuracy and consistency of the visual diagnosis of exposed dentine on worn occlusal/incisal surfaces. Caries Res. 2006;403:208–212. doi: 10.1159/000092227. [DOI] [PubMed] [Google Scholar]
- 7.Ganss C, Lussi A. Diagnosis of erosive tooth wear. Monogr Oral Sci. 2014;25:22–31. doi: 10.1159/000359935. [DOI] [PubMed] [Google Scholar]
- 8.Hasselkvist A, Johansson A, Johansson AK. A 4 year prospective longitudinal study of progression of dental erosion associated to lifestyle in 13-14 year-old Swedish adolescents. J Dent. 2016;47:55–62. doi: 10.1016/j.jdent.2016.02.002. [DOI] [PubMed] [Google Scholar]
- 9.Heuer T, Krems C, Moon K, Brombach C, Hoffmann I. Food consumption of adults in Germany: results of the German National Nutrition Survey II based on diet history interviews. Br J Nutr. 2015;113 doi: 10.1017/S0007114515000744. [DOI] [PMC free article] [PubMed] [Google Scholar]
- 10.Holbrook WP, Ganss C. Is diagnosing exposed dentine a suitable tool for grading erosive loss? Clin Oral Investig. 2008;12(suppl 1):S33–S39. doi: 10.1007/s00784-007-0174-4. [DOI] [PMC free article] [PubMed] [Google Scholar]
- 11.Hugoson A, Bergendal T, Ekfeldt A, Helkimo M. Prevalence and severity of incisal and occlusal tooth wear in an adult Swedish population. Acta Odontol Scand. 1988;46:255–265. doi: 10.3109/00016358809004775. [DOI] [PubMed] [Google Scholar]
- 12.Jaeggi T, Lussi A. Prevalence, incidence and distribution of erosion. Monogr Oral Sci. 2014;25:55–73. doi: 10.1159/000360973. [DOI] [PubMed] [Google Scholar]
- 13.Johansson AK, Omar R, Carlsson GE, Johansson A. Dental erosion and its growing importance in clinical practice: from past to present. Int J Dent. 2012;2012:632907. doi: 10.1155/2012/632907. [DOI] [PMC free article] [PubMed] [Google Scholar]
- 14.Kelly M, Steele J, Nuttall N, Bradnock G, Morris J, Nunn J, Pine C, Pitts N, Treasure E, White D. Adult Dental Health Survey - Oral Health in the United Kingdom 1998. London: Stationery Office; 2000. [Google Scholar]
- 15.Kitasako Y, Sasaki Y, Takagaki T, Sadr A, Tagami J. Age-specific prevalence of erosive tooth wear by acidic diet and gastroesophageal reflux in Japan. J Dent. 2015;43:418–423. doi: 10.1016/j.jdent.2015.02.004. [DOI] [PubMed] [Google Scholar]
- 16.Lobbezoo F, Naeije M. A reliability study of clinical tooth wear measurements. J Prosthet Dent. 2001;86:597–602. doi: 10.1067/mpr.2001.118892. [DOI] [PubMed] [Google Scholar]
- 17.Lussi A, Carvalho TS. Erosive tooth wear: a multifactorial condition of growing concern and increasing knowledge. Monogr Oral Sci. 2014;25:1–15. doi: 10.1159/000360380. [DOI] [PubMed] [Google Scholar]
- 18.Margaritis V, Nunn J. Challenges in assessing erosive tooth wear. Monogr Oral Sci. 2014;25:46–54. doi: 10.1159/000359937. [DOI] [PubMed] [Google Scholar]
- 19.O'Brien M. Children's dental health in the United Kingdom 1993. Office of Population Censuses and Surveys. London: Social Survey Division, HMSO; 1994. [Google Scholar]
- 20.Okunseri C, Wong MC, Yau DT, McGrath C, Szabo A. The relationship between consumption of beverages and tooth wear among adults in the United States. J Public Health Dent. 2015;75:274–281. doi: 10.1111/jphd.12096. [DOI] [PubMed] [Google Scholar]
- 21.Schuller AA, et al., editors. Oral Health of Adults in the Netherlands 2007. Leiden: TNO; 2009. [Google Scholar]
- 22.Schuller AA, van Kempen I, Vermaire JH, Poorterman JHG, Verlinden A, Hofstetter H, Verrips GHW. A Survey on Oral Health and Dental Preventive Behavior in Adults in the Netherlands in 2013. Leiden: TNO; 2014. Gebit Fit? [Google Scholar]
- 23.Shellis RP, Addy M. The interactions between attrition, abrasion and erosion in tooth wear. Monogr Oral Sci. 2014;25:32–45. doi: 10.1159/000359936. [DOI] [PubMed] [Google Scholar]
- 24.Sichert-Hellert W, Beghin L, De Henauw S, Grammatikaki E, Hallström L, Manios Y, Mesana MI, Molnár D, Dietrich S, Piccinelli R, Plada M, Sjöström M, Moreno LA, Kersting M, HELENA Study Group Nutritional knowledge in European adolescents: results from the HELENA (Healthy Lifestyle in Europe by Nutrition in Adolescence) study. Public Health Nutr. 2011;14:2083–2091. doi: 10.1017/S1368980011001352. [DOI] [PubMed] [Google Scholar]
- 25.Smith BG, Knight JK. An index for measuring the wear of teeth. Br Dent J. 1984;156:435–438. doi: 10.1038/sj.bdj.4805394. [DOI] [PubMed] [Google Scholar]
- 26.Smith BG, Robb ND. The prevalence of tooth wear in 1,007 dental patients. J Oral Rehabil. 1996;23:232–239. doi: 10.1111/j.1365-2842.1996.tb00846.x. [DOI] [PubMed] [Google Scholar]
- 27.Steele J, O'Sullivan I. Adult Dental Health Survey 2009. The NHS Information Centre for Health and Social Care. Part of the Government Statistical Service. 2011 Published March. [Google Scholar]
- 28.Truin GJ, Burgersdijk RCW, Groeneveld A, Heling GWJ, van‘t Hof MA, Kalsbeek H, Visser RSH. Introduction, Material and Methods. Nijmegen: Catholic University Nijmegen/Leiden, NIPG-TNO; 1987. National Epidemiologic Research Dentistry. 1. [Google Scholar]
- 29.Van der Glas HW, Lobbezoo F, van der Bilt A, Bosman F. Influence of the thickness of soft tissues overlying human masseter and temporalis muscles on the electromyographic maximal voluntary contraction level. Eur J Oral Sci. 1996;104:87–95. doi: 10.1111/j.1600-0722.1996.tb00051.x. [DOI] [PubMed] [Google Scholar]
- 30.Van't Spijker A, Rodriguez JM, Kreulen CM, Bronkhorst EM, Bartlett DW, Creugers NH. Prevalence of tooth wear in adults. Int J Prosthodont. 2009;22:35–42. [PubMed] [Google Scholar]
- 31.Vered Y, Lussi A, Zini A, Gleitman J, Sgan-Cohen HD. Dental erosive wear assessment among adolescents and adults utilizing the basic erosive wear examination (BEWE) scoring system. Clin Oral Investig. 2014;18:1985–1990. doi: 10.1007/s00784-013-1175-0. [DOI] [PubMed] [Google Scholar]
- 32.Wetselaar P, Lobbezoo F. The Tooth Wear Evaluation System: a modular clinical guideline for the diagnosis and management planning of worn dentitions. J Oral Rehabil. 2016;43:69–80. doi: 10.1111/joor.12340. [DOI] [PubMed] [Google Scholar]