

Abstract
Long-term potentiation (LTP) is an activity-dependent and persistent increase in synaptic transmission. Currently available techniques to measure LTP are time-intensive and require highly specialized expertise and equipment, and thus are not well suited for screening of multiple candidate treatments, even in animal models. To expand and facilitate the analysis of LTP, here we use a flow cytometry-based method to track chemically induced LTP by detecting surface AMPA receptors in isolated synaptosomes: fluorescence analysis of single-synapse long-term potentiation (FASS-LTP). First, we demonstrate that FASS-LTP is simple, sensitive, and models electrically induced LTP recorded in intact circuitries. Second, we conducted FASS-LTP analysis in two well-characterized Alzheimer's disease (AD) mouse models (3xTg and Tg2576) and, importantly, in cryopreserved human AD brain samples. By profiling hundreds of synaptosomes, our data provide the first direct evidence to support the idea that synapses from AD brain are intrinsically defective in LTP. Third, we used FASS-LTP for drug evaluation in human synaptosomes. Testing a panel of modulators of cAMP and cGMP signaling pathways, FASS-LTP identified vardenafil and Bay-73–6691 (phosphodiesterase-5 and -9 inhibitors, respectively) as potent enhancers of LTP in synaptosomes from AD cases. These results indicate that our approach could provide the basis for protocols to study LTP in both healthy and diseased human brains, a previously unattainable goal.
SIGNIFICANCE STATEMENT Learning and memory depend on the ability of synapses to strengthen in response to activity. Long-term potentiation (LTP) is a rapid and persistent increase in synaptic transmission that is thought to be affected in Alzheimer's disease (AD). However, direct evidence of LTP deficits in human AD brain has been elusive, primarily due to methodological limitations. Here, we analyze LTP in isolated synapses from AD brain using a novel approach that allows testing LTP in cryopreserved brain. Our analysis of hundreds of synapses supports the idea that AD-diseased synapses are intrinsically defective in LTP. Further, we identified pharmacological agents that rescue LTP in AD, thus opening up a new avenue for drug screening and evaluation of strategies for alleviating memory impairments.
Keywords: Alzheimer's disease, flow cytometry, GluA1, LTP, phosphodiesterase inhibitors, synaptosomes
Introduction
Learning and memory problems are increasingly prevalent with age, ranging from complaints in mild episodic memory to more severe and widespread cognitive dysfunction with Alzheimer's disease (AD) and other neurodegenerative diseases (Yankner et al., 2008; Negash et al., 2011). It is generally believed that memory problems with age and AD arise from synaptic dysfunction and declines in synaptic plasticity, particularly in the hippocampus (Selkoe, 2002; Morrison and Baxter, 2012). One of the most widely used models for studying molecular mechanisms of hippocampal synaptic plasticity is long-term potentiation (LTP), a rapid and remarkably persistent increase in synaptic transmission elicited by brief patterns of afferent activity (Bliss and Collingridge, 1993). A growing body of experimental data supports that LTP is causally linked to synaptic processes underlying memory (Morris et al., 1986; Roman et al., 1987; Whitlock et al., 2006; Nabavi et al., 2014), thus underscoring the potential value of rapid and sensitive methods to monitor LTP.
LTP has been studied for decades both in vivo and in vitro, primarily in the hippocampus (Huganir and Nicoll, 2013). A number of induction protocols can be used to generate hippocampal LTP; most commonly, a train of electrical stimulation bursts separated by the period of the theta wave is used to initiate NMDA-dependent LTP in intact neural circuitries. However, current electrophysiological approaches are not appropriate for analyzing synapses in isolation (e.g., in the absence of glia) and thus cannot be used to study neuron-specific mechanisms or for screening pharmaceuticals, as obtaining complete pharmacological profiles or testing multiple preparations in intact neural circuitries is limited by drug diffusion and response sampling times. An alternative to current model systems for studying LTP may be to use synaptosomal preparations, which contain presynaptic terminals attached to postsynaptic structures and have been widely used to study synaptic mechanisms by biochemical, structural, and functional analysis (Sandoval et al., 1978; Daniel et al., 2012; Wilhelm et al., 2014). Indeed, to focus on neuron-specific mechanisms, we have recently presented a preliminary description of an approach to study LTP in isolated synaptosomes, termed fluorescence analysis of single-synapse long-term potentiation (FASS-LTP) (Prieto et al., 2015). Here we extensively characterize and scale up this novel method, which is based on protocols using chemical stimulation to induce LTP.
FASS-LTP focuses on the insertion of AMPA glutamate receptors (AMPAR) into the postsynaptic surface, the essential event for the potentiation of synaptic transmission (Muller et al., 1988; Manabe et al., 1992; Shi et al., 1999; Hayashi et al., 2000; Zhang et al., 2015). To induce LTP in isolated synaptosomes, we use chemical stimulation (cLTP), a procedure widely used to study LTP in neuronal cultures (Lu et al., 2001; Park et al., 2004, 2006; Fortin et al., 2010) and hippocampal slices (Musleh et al., 1997). Following cLTP, the activity-dependent increase in surface GluA1-containing AMPARs is tracked by flow cytometry in isolated synaptosomes. Overall, the technique consists of cLTP stimulation directly in synaptosomal fractions, immunofluorescence labeling, and flow cytometry analysis. This report provides a detailed characterization of FASS-LTP, which was tested in brain samples from rats, mice, and, importantly, humans. We demonstrate that FASS-LTP has several unique strengths: synapses are examined directly, multiple samples are tested in parallel, and a minimal amount of tissue is needed for each assay. Further, we provide evidence that FASS-LTP can serve as an efficient method for drug screening and for studying synaptic plasticity in the AD-diseased brain from both animal models and humans.
Materials and Methods
Animals.
Male C57BL/6J mice (3–8 months old) were used in most experiments. In some experiments, we used male B6129SF2/J (nontransgenic) and 3xTg mice, and 8-week-old male Sprague Dawley rats (8 weeks old). Both mice and rats were housed with food and water ad libitum. Lights were maintained on a 12:12 light/dark cycle. All procedures used in the present study followed the Principles of Laboratory Animal Care from the National Institutes of Health and were approved by the University of California, Irvine, Institutional Animal Care and Use Committee.
Human brain specimens.
Parietal cortex (Brodmann area A7) samples with a postmortem interval (PMI) < 8.4 h were obtained at autopsy from the Alzheimer's Disease Research Center at University of California-Irvine. Each diagnosis was established clinically and histopathologically. The mean postmortem delay (hours, mean ± SEM) was 5.4 ± 0.7 for controls and 5.7 ± 0.2 for AD (p = 0.713). Age (years, mean ± SEM) for controls was 96.2 ± 1.7, and for AD was 84.8 ± 6.6 (p = 0.158) (unpaired Student's t test with Welch's correction). Unfixed fresh samples (0.3–5 g) were minced in 0.32 m sucrose the day of autopsy, slowly frozen, and stored at −80°C until homogenization. Samples were rapidly thawed in a warm bath. The crude synaptosomal pellet (P2) was prepared by homogenization in 10 volumes of 0.32 m sucrose containing protease and phosphatase inhibitors. The homogenate was first centrifuged at 1000 × g for 10 min; the resulting supernatant was centrifuged at 10,000 × g for 20 min to obtain the crude synaptosomal pellet (P2). Samples were obtained and handled according to University of California-Irvine Institutional Review Board and Environment, Health and Safety regulations.
Antibodies and chemicals.
Antibodies were from Cell Signaling Technology: ERK1/2 (catalog #9102 RRID:AB_330744), GluA1 (13185); from Millipore: GluA1 (ABN241), GluA2-AlexaFluor-488 (catalog #MAB397A4, RRID:AB_10917113), PSD95 (mouse, catalog #MAB1598 RRID:AB_94278), TrkB (catalog #07–225 RRID:AB_310445), Synapsin-I (catalog #AB1543 RRID:AB_2200400), Synaptophysin (catalog #MAB5258 RRID:AB_2313839); from University of California-Davis/National Institutes of Health NeuroMab Facility: Neurexin-1β (catalog #75–216, RRID:AB_2155531), VGluT1 (catalog #75–066 RRID:AB_2187693); from Abcam: histone-H3 (trimethyl K4, catalog #ab8580 RRID:AB_306649), PSD95 (rabbit, catalog #ab18258 RRID:AB_444362); from Invitrogen: Secondary antibodies, AlexaFluor-488 (anti-rabbit, catalog #A-11034 RRID:AB_2576217), AlexaFluor-488 (anti-mouse, catalog #A-11029 RRID:AB_2534088), AlexaFluor-647 (anti-rabbit, catalog #A-21245 RRID:AB_2535813), AlexaFluor-647 (anti-mouse, catalog #A-21236 RRID:AB_2535805); from Sigma-Aldrich: β-actin (catalog #A2066 RRID:AB_476693); from GeneTex: GAPDH (catalog #GTX100118 RRID:AB_1080976), p84 (catalog #GTX70220 RRID:AB_372637); from Pierce: Secondary HRP (anti-mouse, catalog #31438 RRID:AB_228217), secondary HRP (anti-rabbit, catalog #31460 RRID:AB_228341); from Alomone Labs: GluN2B (catalog #AGC-003 RRID:AB_2040028); and calcein acetoxymethyl ester (calcein AM; ultrapure grade, Affymetrix, eBioscience, #65-0853-39). Chemicals were from Sigma-Aldrich: 4-aminopyridine (4-AP), AP5, glycine, DMSO, KN-62, and anisomycin; from R&D Systems: TrkB-Fc.
FASS-LTP.
(1) Synaptosome isolation: Fresh crude synaptosome P2 fractions were obtained from whole mouse hippocampus using our long-standing protocol (Sandoval et al., 1978). All the steps for synaptosome P2 fraction isolation were performed at 4°C; sucrose buffer, grinder, pestle, and Microfuge tubes were all precooled on ice. Hippocampi were rapidly dissected form a single mouse and homogenized in 320 mm sucrose (1.5 ml) containing HEPES [10 mm] and protease/phosphatase inhibitors mixture (Pierce), pH 7.4. Homogenization consisted of 6–8 manual strokes in a Glass-Teflon grinder, clearance (between plunger and glass): 0.15–0.25 mm. Plunger was gently rotated during strokes while the grinder was kept on ice. The homogenate was centrifuged at 1200 × g for 10 min. Supernatant (S1, containing mitochondria and synaptosomes) was transferred into two clean Microfuge tubes and centrifuged at 12,000 × g for 20 min. Supernatants (S2) were carefully removed using a plastic tip and vacuum. Pellets (P2, corresponding to the crude synaptosome fraction) were resuspended by gently pipetting up and down (10–20 times) in 1.5 ml of extracellular (tube 1) or cLTP (tube 2) solutions. Extracellular solution contains the following (in mm): 120 NaCl, 3 KCl, 2 CaCl2, 2 MgCl2, 15 glucose, 15 HEPES, pH 7.4; whereas cLTP solution is Mg2+-free and contains the following (in mm): 125 NaCl, 2 CaCl2, 5 KCl, 10 HEPES, 30 glucose, pH 7.4 (Park et al., 2006). Synaptosome P2 fractions were filtered with a 40 μm pore cell strainer (BD Biosciences) and incubated in a cell culture dish (30 mm) with agitation at room temperature for 10–15 min for recovery. Similarly, cryopreserved (−80°C) P2 fraction from human brain was rapidly thawed in a warm bath, filtered (40 μm pore) and incubated in a cell culture dish (30 mm) with agitation at room temperature for 10 min. A P2 fraction aliquot was used to determine protein concentration (BCA assay using BSA as a standard). To prevent synaptosome damage, Finntip pipette tips (Thermo) were used to handle human, mouse, and rat synaptosome samples.
(2) Stimulation: After recovery, 180 μl synaptosomes (50–200 μg protein, BCA assay) maintained in cLTP solution were transferred to cytometry tubes. As control, an equal volume (180 μl) of synaptosome maintained in external solution was also transferred to a cytometry tube. Synaptosomes in external solution were used to determine basal levels of potentiated synaptosomes (see below). All cytometry tubes were prewarmed in a 37°C bath (5 min) before stimulation. External, glycine, and KCl solutions were also prewarmed at 37°C. Next, 20 μl of external solution was added to control synaptosomes (in external solution), whereas 20 μl of glycine ([5 mm] in cLTP solution freshly supplemented with 0.01 mm strychnine and 0.2 mm bicuculline methiodide) was added to synaptosomes in cLTP solution (final [glycine] = 0.01 μm) (Chen et al., 2011). Glycine was incubated for 15 min to prime synaptic NMDAR. After glycine treatment, synaptosomes were depolarized with 100 μl of a [high] KCl solution consisting of the following (in mm): 50 NaCl, 2 CaCl2, 100 KCl, 10 HEPES, 30 glucose, 0.5 glycine 0.001 strychnine, 0.02 bicuculline methiodide, pH 7.4 (final [KCl] = 37 mm), and incubated for 30 min; 100 μl of external solution was added to control synaptosomes. KCl is used to depolarize and induce the release of endogenous glutamate from presynaptic terminals (Bradford, 1970; Nicholls and Sihra, 1986). Because the presynaptic active zone is adjacent to postsynaptic density (PSD), this protocol activates synaptic NMDARs preferentially. After KCl incubation, stimulation was stopped by sequential addition of 0.5 ml of ice-cold 0.1 mm EDTA-PBS, pH 7.4, and 4 ml of ice-cold blocking buffer (5% FBS in PBS). Tubes were chilled on ice and immediately centrifuged at 2500 × g for 6 min at 4°C (9000 rpm, Sorvall RT6000B). After centrifugation, the pellet was resuspended by gentle finger agitation (no vortex) and kept on ice. To test NMDAR dependence (see Fig. 4C), P2 pellets were resuspended in external or cLTP solutions containing AP5 (100 μm) or DMSO (control), maintained at room temperature for 15 min, and prewarmed at 37°C (5 min) before stimulation with 20 μl of 5 mm glycine (0.01 mm strychnine, 0.2 mm bicuculline methiodide). Glycine solution also contained either 100 μm AP5 or DMSO. To test different KCl concentrations (see Fig. 4B), after glycine incubation (15 min), synaptosomes were treated with 50, 100, and 200 μl of [high] KCl solution. Final concentrations of each ion were obtained, and the corresponding membrane potentials (Vm) were calculated based on Goldman-Hodgkin-Katz equation (below), using the calculator at http://www.physiologyweb.com/calculators/ghk_equation_calculator.html. Vm values were −49, −41, and −31 mV using 50, 100, and 200 μl [high] KCl solution, respectively, as follows:
 |
Constants: R = 8.314 J.K−1.mol−1, T = 310.15 K, F = 96485 C.mol−1, pK = 1.0, pNa = 0.05, pCl = 0.45, [K+]i = 140 mm, [Na+]i = 7 mm, [Cl−]i = 7 mm.
Figure 4.

FASS-LTP reproduces essential properties of electrically induced LTP. A, Time course showing percentage GluA1+Nrx1β+ events following cLTP (gly15′+KCl: 52 mm KCl added 15 min after 200 μm glycine, arrow). cLTP responses were evaluated at 15, 25, 45, and 75 min, and values were normalized to basal state. To evaluate basal GluA1+Nrx1β+ levels, synaptosomes were maintained in external solution (with Mg2+) and treated with equivalent volumes of external solution instead of glycine or KCl solutions; a control sample (basal) was included for each time point. Basal levels are denoted as time 0′. Overall data are presented as mean ± SEM. *p < 0.05 versus basal (ANOVA, Tukey post hoc test). **p < 0.01 versus basal (ANOVA, Tukey post hoc test). n = 14 independent experiments (14 mice, 5–8 months). Alternative stimulation protocols tested included the following: gly only (200 μm glycine; n = 6), KCl only (52 mm KCl; n = 5), and gly+KCl cotreatment (cotreatment using 200 μm glycine and 52 mm KCl; n = 3). n = number of independent experiments (no. of mice). gly15′+KCl versus gly only, p = 0.0027 (two-way ANOVA, effect of stimulation protocol, F(1,78) = 9.62); gly15′+KCl versus KCl only (25, 45, and 75 min), p = 0.0002 (two-way ANOVA, effect of stimulation protocol, F(1,41) = 17.44); gly15′+KCl vs gly+KCl cotreatment (25, 45, and 75 min), p = 0.0003 (two-way ANOVA, effect of stimulation protocol, F(1,36) = 15.94). B, GluA1+Nrx1β+ levels following cLTP (45 min) using 24, 37, and 52 mm KCl. Membrane potentials (Vm) were obtained by the Goldman-Hodgkin-Katz equation. Representative upper-right quadrants from GluA1-Nrx1β plots show percentage GluA1+Nrx1β+ events (top). *p < 0.05 versus basal (ANOVA, Tukey post hoc test). **p < 0.01 versus basal (ANOVA, Tukey post hoc test). n = 8 independent experiments (8 mice, 3–6 months). C, AP5 (100 μm, 20 min pretreatment) blocks synaptosome cLTP response (45 min, 37 mm KCl). Boxplots (percentiles: box, 25th-75th; whiskers, 10th-90th). **p < 0.01 versus basal (ANOVA, Kruskal–Wallis post hoc test). n = 7 independent experiments (7 mice, 3–6 months). D, Synaptosome cLTP response was inhibited by TrkB-Fc (2 μg/ml, n = 7), K252a (200 nm, n = 7), KN-62 (10 μm, n = 7), anisomycin (40 μm, n = 11), H-89 (5 μm, n = 9), and SQ22536 (200 μm, n = 5). Synaptosomes were preincubated for 10 min with inhibitors or appropriate vehicle before cLTP (75 min, 37 mm KCl). Data are mean ± SEM. **p < 0.01 versus basal (ANOVA, Tukey post hoc test).
(3) Immunolabeling: Primary antibody solution (400 μl) was added to the resuspended pellet and incubated for 30 min on ice with agitation. Primary antibody solution contained rabbit anti-GluA1 (Molnár et al., 1993; Richmond et al., 1996) (ABN241) and mouse anti-Nrx1β (University of California-Davis/National Institutes of Health NeuroMab Facility, 75–216) antibodies, both at 2.5 μg/ml in blocking buffer (5% FBS in PBS). Similar results are obtained with rabbit anti-GluA1 (Cell Signaling Technology, #13185; 1:400). After incubation, synaptosomes were washed (2 times) with 4 ml of ice-cold blocking buffer and centrifuged (2500 × g/5 min/4°C). Supernatant was discarded and pellet gently resuspended as previously described. Secondary antibody solution (400 μl) was added to each tube and incubated for 30 min on ice with agitation and protected from light. After incubation, synaptosomes were washed as previously described. Secondary antibody solution contained anti-rabbit-Alexa-488 and anti-mouse-Alexa 647 antibodies (Invitrogen), both at 2.5 μl/ml. Endogenous/nonspecific background fluorescence for each marker was determined using secondary antibody staining only in a tube containing synaptosomes maintained in external solution (37°C, 45 min); no differences in background fluorescence were found when comparing synaptosomes in external solution (basal state) or following cLTP stimulation. After the last wash, the pellet was resuspended as previously described and 400 μl of 2% PFA in PBS was added to each tube. Samples were protected from light, maintained at 4°C, and run on a flow cytometer within 48 h.
(4) Flow cytometry: Samples were acquired using BD FACSCalibur flow cytometer (BD Biosciences) equipped with argon 488 nm and helium-neon 635 nm lasers. Relative size and granularity were determined by forward scatter (FSC) and side scatter (SSC) properties. FSC, SSC, and fluorescence (FL1 [530 ± 15 nm] and FL4 [650 ± 25 nm]) signals were collected using log amplification. FSC-SSC plots were used to select particles matching the size of synaptosomes (0.75–3.0 μm) using calibrated beads (Polysciences) (see Fig. 1A,B), as previously described (Fein et al., 2008). Identical FSC settings were used for acquiring data on bead standards and samples. Small fragments and debris were excluded by establishing an FSC-H threshold (gain = 325). Settings for fluorescence amplification on FL1 and FL4 photomultiplier tube detectors were based on the emission detected on size-based gated particles. Alexa-488 and Alexa-647 fluorochromes were detected by the FL1 and FL4 detectors, respectively. Synaptosome integrity was assessed with calcein AM using the FL1 detector (to detect the fluorescent molecule calcein). A total of 10,000 size-gated particles were collected and analyzed for each sample; event rate: ∼500/s. Analysis was performed using the CellQuest Pro software (BD Biosciences). Gates are set based on standard immunostaining protocols for flow cytometry (Baumgarth and Roederer, 2000; Hulspas et al., 2009; Menon et al., 2014). Briefly, we use staining controls to discriminate background fluorescence due to both sample itself and unspecific binding of fluorescence-labeled antibodies. These controls are synaptosomes incubated only with secondary antibodies (no primary antibodies). The presence of doublets and multiplets (clumps) was assessed by FSC-H versus FSC-A plots (Doublet discrimination) using a BD FACSAria Fusion cytometer and Flow Jo software (LLC). Briefly, the amount of light scattered in the forward direction (FSC) is processed as a voltage pulse, which is defined by its area (A), height (H), and width (W). Disproportions between height, width, and area are used to identify doublets and clumps. P2 fraction-derived events exhibited a single-particle profile in both basal and cLTP conditions, as assessed in FSC-H versus FSC-A bivariate plot (data not shown).
Figure 1.
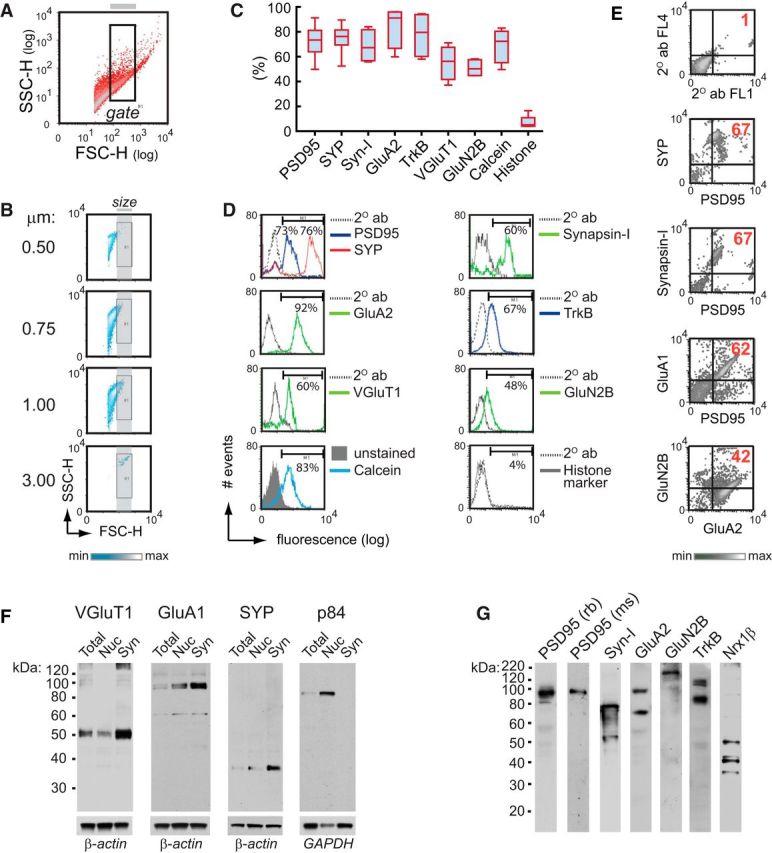
Flow cytometry-based identification of synaptosomes by size. A, FSC-SSC density plot shows the size-complexity profile of particles in the synaptosomal P2 fraction isolated from fresh mouse hippocampus; the gate (inside rectangle) selects putative synaptosomes according to their size (0.75 μm < gated particles ≤ 3.0 μm), relative to calibrated beads (0.5, 0.75, 1.0, and 3.0 μm), shown in B. Size-gated events exhibited a single-particle profile, as determined by Doublet discrimination analysis (see Materials and Methods). C, Detection of synaptic, nuclear, and viability markers in size-gated particles from the P2 fraction. Boxplots percentiles: box, 25th-75th; whiskers, 10th-90th. Synaptic markers: postsynaptic density protein 95 (PSD95, n = 17), synaptophysin (SYP, n = 7), synapsin-I (n = 4), AMPA glutamate receptor subunit 2 (GluA2, n = 4), tropomyosin receptor kinase B (TrkB, n = 4), vesicular glutamate transporter 1 (VGluT1, n = 4), NMDA glutamate receptor subunit 2B (GluN2B, n = 4); nuclear marker: histone-H3 (n = 5); viability marker: calcein (n = 4); n = number of independent experiments (number of mice). D, Representative histograms of data presented in C. Thresholds for endogenous/nonspecific fluorescence for each marker were set using a proper secondary antibody (dotted line) or unstained samples (control for calcein staining). PSD95, SYP, synapsin-I, VGluT1, and histone-H3 were detected by intracellular staining, whereas GluA2, TrkB, and GluN2B were detected following a surface (extracellular) staining protocol. E, In size-gated particles, representative two-parameter density plots for SYP-PSD95(intracellular) (using a rabbit anti-PSD95 antibody to prevent cross-reactivity), synapsin-I-PSD95(intracellular), GluA1-PSD95(intracellular) (using a mouse anti-PSD95 antibody to prevent cross-reactivity), and GluA2-GluN2B(extracellular). Numbers indicate percentage of events at the top right quadrant, which contains double-positive particles. Top, Representative plot shows how thresholds for endogenous/nonspecific fluorescence for each marker are set by staining with secondary antibodies only (2° abs for fluorescence-1 and -4 channels, FL1 and FL4, respectively). F, The 20 μg of lysates from total homogenate, nuclear (Nuc, P1), and crude synaptosomal (Syn, P2) fractions was resolved by SDS-PAGE and immunoblotted. Compared with the nuclear fraction, the synaptosomal fraction contained higher levels of VGluT1 (∼52 kDa), GluA1 (∼100 kDa), and synaptophysin (∼38 kDa), but no detectable signal of the nuclear matrix protein p84 (∼84 kDa). GAPDH and β-actin were used as loading controls. G, Synaptosomal fractions were also tested for PSD95 (∼95 kDa), synapsin-I (syn-I, ∼77 kDa), GluA2 (∼100 kDa; secondary band at ∼70 kDa), GluN2B (∼166 kDa), TrkB (∼120 kDa; secondary band at ∼90 kDA, which is likely a TrkB truncated form), and Nrx1β (∼50 kDa; secondary bands at ∼41 and ∼35 kDa, which are likely splice variants).
Intracellular immunolabeling.
This was performed using 50–100 μg P2 fractions ([protein] by BCA assay). Samples were fixed with 4% PFA for 20 min at room temperature, chilled on ice, and permeabilized by adding ice-cold 100% methanol slowly, while gently vortexing, to a final concentration of 90% methanol and incubating 15 min on ice. Samples were washed with ice-cold PBS, blocked with 200 μl of Blocking/Perm buffer (5% FBS, 0.2% Tween 20 in PBS) for 10 min and stained by adding 200 μl of primary antibody (RT, 30 min on agitation). Samples were washed (2 times) with ice-cold Blocking/Perm buffer, and pellets were resuspended in 400 μl 2% PFA. Most primary antibodies were at 2.5 μg/ml in 400 μl blocking Blocking/Perm buffer; synapsin-I antibody was at 1 μg/ml. Endogenous/nonspecific background fluorescence was determined by using secondary-conjugated antibodies.
Electrophysiology.
Acute hippocampal slices were prepared from 8-week-old male Sprague Dawley rats (Harlan Laboratories) for extracellular field recordings. Rats were decapitated and the brain quickly submerged in ice-cold, oxygenated, high magnesium ACSF containing the following (in mm): 124 NaCl, 3 KCl, 1.25 KH2PO4, 5 MgSO4, 26 NaHC03, and 10 dextrose. A McIlwain tissue chopper was used to prepare 400-μm-thick slices from the middle third of the hippocampal septotemporal axis. Slices were then transferred to an interface recording chamber maintained at 31 ± 1°C (95% O2/5% CO2) and continuously perfused with preheated oxygenated ACSF containing the following (in mm): 124 NaCl, 3 KCl, 1.25 KH2PO4, 1.5 MgSO4, 26 NaHCO3, 2.5 CaCl2, and 10 dextrose at a rate of 60–70 ml/h. Recordings began ≥1.5 h after transfer to the chamber. Field EPSPs (fEPSPs) were evoked in CA1a and CA1c stratum radiatum using a bipolar stimulating electrode (twisted nichrome wire, 65 μm) and recorded in CA1b stratum radiatum using a glass electrode (2 m NaCl, 2–3 mΩ). Before theta burst stimulation (TBS, 10 bursts of 4 pulses at 100 Hz, 200 ms between bursts) test pulses at 0.05 Hz were delivered at a baseline stimulation intensity that yielded response amplitudes ∼50% of the maximum spike-free fEPSP. For induction of LTP, a high-intensity TBS protocol was used consisting of four trains separated by 15 s as follows: one train was delivered at both polarities of each stimulating electrode. Stimulation intensity was increased to near-spike threshold only during TBS and then returned to baseline intensity. In all instances, initial slopes and amplitudes were measured from digitized fEPSPs (NACGather 2.0, Theta Burst). Slices were collected 30–60 min after TBS for FASS-LTP preparation. CA1 area (∼0.4 mm2) surrounding the recording electrode was punched out by using a biopsy punch sampler (size: 2.0 mm; Harris Uni-Cores, Electron Microscopy Sciences, #69036–20) and a cutting mat (Electron Microscopy Sciences, #69037–23). P2 fraction isolation, GluA1 and Nrx1β immunolabeling, and flow cytometry analysis were performed immediately, as described above (see FASS-LTP immunolabeling).
Biochemistry.
Total homogenates, P1 and P2 fractions, were obtained from whole mouse hippocampus and lysed in RIPA buffer (RIPA/Nonidet P-40 buffer containing protease and phosphatase inhibitor mixtures [Pierce, Thermo Fisher Scientific]) by vortex 10 s at high speed. Protein concentration was determined by the BCA assay (Pierce, #23227). All samples were supplemented with Laemmli buffer, boiled (7 min), run on Criterion XT gels, and then transferred to PVDF membranes according to the manufacturer's instructions (Bio-Rad). Membranes were blocked in 5% BSA for 1 h and then probed with primary antibody (4°C, overnight). The membranes were washed (4 × 10 min in TBS with 0.1% Tween 20, v/v) and probed with HRP-conjugated secondary antibody for 1 h. The membranes were washed and developed using Chemiluminescent Substrate (Pierce, #32106) or Luminata Crescendo Western HRP substrate (Millipore). Some blots were washed, stripped, and reprobed with antibodies to GAPDH or β-actin. Membranes were incubated in stripping buffer (Pierce, #46430) according to the manufacturer's instructions.
Synaptosome sorting and immunoprecipitation.
Sorting experiments were performed on a BD FACSAria Fusion cytometer, using light scatter discrimination (FSC-H, SSC-H, and doublet discrimination). First, synaptosomes were identified by size using calibrated beads (0.75–3.0 μm; see Fig. 1A,B), and 200,000 size-gated synaptosomes were sorted for each condition (basal vs cLTP). Sorted synaptosomes were collected in 250 μl of RIPA buffer containing protease and phosphatase inhibitors. Immediately after synaptosome collection, the volume was adjusted to 500 μl and immunoprecipitation was performed with a commercially available kit (Active Motif). Briefly, samples for each condition were incubated overnight with rotation at 4°C with a rabbit anti-GluA1 antibody (Cell Signaling Technology; #13185; 10 μg) or with a rabbit anti-PSD95 (Abcam #ab18258, 10 μg) antibody. As a negative control, a sample (basal condition) was incubated with a control rabbit IgG (Thermo, #02–6102, 10 μg). After incubation, protein-G magnetic beads were added and incubated for 1 h with rotation at RT. Protein complexes were magnetically precipitated according to the manufacturer's instructions, lysed with Laemmli buffer (4×), boiled (10 min), run on Criterion XT gels, and transferred to PVDF membranes. Antibodies used for blotting were as follows: rabbit anti-GluA1 (Cell Signaling Technology; 1:1000) and mouse anti-PSD95 (Millipore MAB1598; 1:1000). For stripping between first and second blotting, membranes were incubated in stripping buffer (Pierce, #46430) according to the manufacturer's instructions.
Statistical analyses.
Sample sizes were chosen on the basis of preliminary experiments using synaptosomes (Prieto et al., 2015) and previous experience with in vitro LTP recordings in hippocampal slices (Rex et al., 2007). ANOVA and two-tailed Student's t test (parametric tests) were used where assumptions of normality (Kolmogorov–Smirnov) and equal variance (Bartlett's test) were met, and were replaced by Kruskal–Wallis and Mann–Whitney test (nonparametric tests) where appropriate. For mean comparisons of three or more groups, one-way ANOVA was followed by post hoc Tukey's or Dunnett's (to compare each of a number of treatments with a single control test); whereas Kruskal–Wallis was followed by Dunn's post hoc test. Two-way ANOVAs were followed by Bonferroni's post hoc test. Welch's correction was used in unpaired data Student's t test analysis when samples had unequal variances. Statistical tests were performed using GraphPad Prism 5.0. Data are presented as mean ± SEM. A p value < 0.05 was considered significant.
Results
FASS-LTP identifies potentiated synaptosomes
Previous studies have shown that synaptosomes can be identified by flow cytometry using size-calibrated beads (Wolf and Kapatos, 1989a, b; Gylys et al., 2004; Fein et al., 2008; Sokolow et al., 2012; Postupna et al., 2014), a strategy based on the analysis of the forward-scattered (FSC) light, which is proportional to the size of particles. We first evaluated whether flow cytometry could selectively and reliably identify synaptosomal particles from the crude P2 fraction, which can be rapidly obtained (∼30 min) and is enriched in synaptosomes (Sandoval et al., 1978). Notably, in addition to canonical synaptosomes (presynaptic terminals with an adherent fragment of postsynaptic membrane), P2 fractions from rodents (Cotman et al., 1974; Rao and Steward, 1991; Bagni et al., 2000; Maurer et al., 2008; Corera et al., 2009; Nisticò et al., 2015) and humans (Hahn et al., 2009; Postupna et al., 2014) also contains “snowman-shaped” synaptosomes with a resealed postsynaptic element, which contains sparse membranous organelles identified by electron microscopy (Corera et al., 2009; Hahn et al., 2009) and cryo-electron tomography (Maurer et al., 2008). In crude P2 fractions from mouse hippocampus, we gated a population of particles between 0.75 and 3.0 μm using size-calibrated beads (Fig. 1A,B). Consistent with the average size of synaptosomes (Jones and Bradford, 1971; Wilhelm et al., 2014), we found that the subset of particles between 0.75 and 3.0 μm is enriched in synaptosomes, as demonstrated by the high proportion of particles expressing extracellular and intracellular synaptic markers (e.g., PSD95) with no histone-H3 (nuclear) (Fig. 1C,D); we refer to these particles as size-gated synaptosomes. Double-labeling indicated that most size-gated synaptosomes contain presynaptic and postsynaptic markers (e.g., synapsin-I+PSD95+ ∼70%; Fig. 1E), and that most GluA1+ events coexpress PSD95 (Fig. 1E), indicating that AMPA receptors are detected in particles containing postsynaptic densities. By Western blot, we validated the synaptic enrichment of our preparation (Fig. 1F) and the specificity of antibodies used for immunostaining (Fig. 1G). We also demonstrated the viability of our preparation using calcein AM, a dye that evaluates cell membrane integrity and viability. Size-gated synaptosomes stained positive for calcein (>90%; Fig. 1C,D). These data confirm that flow cytometry selectively and reliably identifies viable synaptosomal particles from the crude P2 fraction.
We envisioned that, in the size-gated synaptosome population, potentiated synapses could be detected by extracellular membrane surface labeling (without permeabilization) using antibodies specific for extracellular epitopes on GluA1 (Richmond et al., 1996) and neurexin-1β (Nrx1β), a presynaptic adhesion molecule stabilized at the membrane surface by synaptic activity (Fu and Huang, 2010). At excitatory synapses, Nrx1β promotes presynaptic differentiation and captures postsynaptic surface GluA1 via PSD95 (de Wit et al., 2009; Mondin et al., 2011). Thus, GluA1 and Nrx1β double-labeling further allows us to focus on “snowman-shaped” synaptosomes that contain both presynaptic and postsynaptic elements. To induce cLTP, synaptosomes were primed with 500 μm glycine (Chen et al., 2011) (15 min) followed by depolarization using 37 mm KCl (30 min) (Nicholls and Sihra, 1986), at 37°C. In parallel, to determine basal levels of GluA1+Nrx1β+, a synaptosome sample was maintained in external solution (37°C, 45 min) and treated with identical volumes of external solution instead of glycine or KCl.
After cLTP induction (45 min), we observed an increased proportion of GluA1+Nrx1β+ events over basal levels (246 ± 21%, p =0.0002 vs basal, n = 8, unpaired Student's t test; Fig. 2A,B), demonstrating that FASS-LTP detects activity-dependent plasticity at the synaptosome surface. We consistently found that up to ∼25% of the size-gated synaptosomes increase surface GluA1 levels after cLTP stimulation, thus indicating that a reliable fraction of particles (∼2500 of 10,000 acquired events) contains functional postsynaptic elements. Subpopulation analysis performed in GluA1-Nrx1β density plots revealed that GluA1+Nrx1β+ particles (top right quadrant) exhibit the highest mean fluorescence intensity for GluA1 (p =0.0023; Fig. 2C) and concentrate most Nrx1β+ particles (p =0.0002; Fig. 2D), supporting the idea that cLTP simultaneously orchestrates an upregulation of postsynaptic GluA1 levels while facilitating the expression of presynaptic Nrx1β at the synaptosomal surface. Notably, in both basal and cLTP conditions, GluA1+Nrx1β+ particles were found to exhibit the highest GluA1 surface levels (Fig. 2C), thus indicating that our approach can identify potentiated synaptosomes even at low basal levels.
Figure 2.
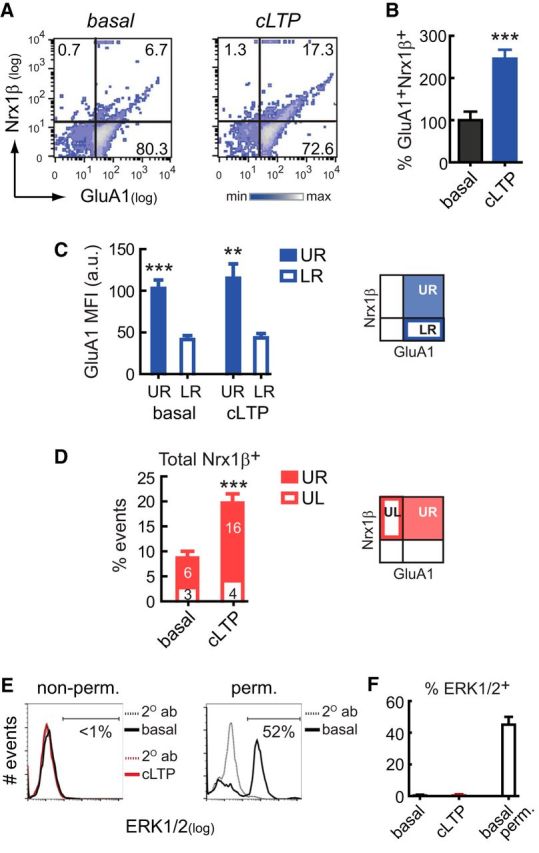
FASS-LTP identifies potentiated synapses by tracking GluA1 and Nrx1β surface expression in size-gated synaptosomes. A, Representative two-color parameter density plots showing GluA1 and Nrx1β surface detection in size-gated synaptosomes maintained in external solution (basal) and after 45 min cLTP (500 μm glycine, 37 mm KCl). Thresholds for endogenous/nonspecific fluorescence for each marker were set by staining with secondary antibodies only (lower left quadrant). According to these thresholds, fluorescence analysis defined four quadrants: UL (upper left), UR (upper right), LL (lower left), and LR (lower right). Surface immunostaining reveals that percentage GluA1+Nrx1β+ events (UR) increases after cLTP, relative to basal conditions. B, Values normalized to basal state. Data are mean ± SEM. ***p =0.0002 (unpaired Student's t test), n = 8 independent experiments (8 mice, 3–4 months). C, The mean fluorescence intensity (MFI) for GluA1 is higher in GluA1+Nrx1β+ than in GluA1+ single-positive synaptosomes, indicating that, on average, each potentiated synapse identified as GluA1+Nrx1β+ contains more surface GluA1 receptors. Graph represents GluA1 MFI in UR and LR quadrants, in basal and cLTP conditions. Data are mean ± SEM. **p = 0.0023, UR versus LR (paired Student's t test). ***p = 0.0007, UR versus LR (paired Student's t test). D, Analysis on Nrx1β data revealed that cLTP stimulation increases the number of synaptosomes with detectable levels of surface Nrx1β, which are mainly located in the GluA1+Nrx1β+ population. Total percentage of synaptosomes expressing Nrx1β at surface (Nrx1β+ single-positive, UL; and GluA1+Nrx1β+ double-positive, UR events). Data are mean ± SEM. ***p = 0.0002 (unpaired Student's t test). UL and UR average numbers are depicted inside the bar. E, Representative histogram of synaptosomes tested for ERK1/2 under nonpermeabilized conditions (non-perm., left). Synaptosomes were either maintained and treated with external solution (basal) or cLTP-stimulated (45 min). The threshold for endogenous/nonspecific fluorescence was independently set in basal and cLTP conditions by staining with the secondary antibody only (2° ab, dotted lines). In parallel, as a positive control for ERK1/2 immunostaining, synaptosomes maintained in basal conditions for 45 min were permeabilized and tested for ERK/1/2 (perm., right). F, Overall data from experiments described in E show percentage of synaptosomes with a positive signal for ERK1/2 (ERK1/2+). n = 3 independent experiments (3 mice, 3–4 months). Data are mean ± SEM.
As FASS-LTP is based on surface synaptosome labeling, this method relies on synaptosome membrane integrity. To evaluate the effects of our cLTP protocol on membrane integrity, we determined whether calcein AM loaded before the incubation period (37°C) remains inside the synaptosomes at the end of the experiment (45 min). Synaptosomes were loaded with 20 nm calcein AM and either stimulated with our cLTP protocol or maintained and treated with equivalent volumes of external solution (basal state). After 45 min, we found high levels of calcein+ events on both basal and cLTP conditions, relative to unloaded synaptosomes (% calcein+: basal = 93.4 ± 4.3 vs cLTP = 92.3 ± 4.1; p = 0.86, unpaired t test, n = 7, 3- to 4-month-old mice). To further assess membrane integrity, we tested antibody penetration in synaptosomes. After 45 min of cLTP or control treatment (external solution), synaptosomes were incubated (no permeabilization) with an antibody against the cytosolic kinases ERK1/2 (extracellular signal-regulated kinases-1 and -2), two MAP kinases that play a key role in synaptic plasticity (Thomas and Huganir, 2004). No labeling was found in either basal or cLTP conditions (Fig. 2E,F). In contrast, a positive intracellular signal for ERK1/2 was observed when synaptosomes were permeabilized (Fig. 2E,F). Overall, these data indicate that synaptosomal membrane integrity is preserved in our experimental conditions, thus preventing false-positive surface labeling due to antibody internalization.
FASS-LTP models electrically induced LTP recorded in intact circuitries
To demonstrate the physiological relevance and specificity of our cLTP synaptic potentiation paradigm, we used flow cytometry to evaluate whether parallel changes in GluA1+Nrx1β+ surface expression are present in synaptosomes prepared from mature hippocampal slices (8-week-old rat) that had undergone electrophysiological induction of LTP. We induced LTP at CA1 by naturalistic theta burst stimulation (TBS) at Schafer collaterals from CA3 hippocampus. After confirming that stable LTP was established following TBS (Fig. 3A), the CA1 area was punched out (Fig. 3B) and immediately processed for synaptosomal isolation and flow cytometry analysis. We found that TBS of hippocampal slices increased the number of GluA1+Nrx1β+ synapses present in isolated synaptosomes (p < 0.019; Fig. 3C,D), paralleling our findings in cLTP-stimulated synaptosomes from mice (Fig. 2A,B) and rats (143 ± 15% over basal, p =0.029, Mann–Whitney test, n = 4). These data demonstrate that TBS-LTP and cLTP converge on a common molecular readout, namely, increased surface coexpression of GluA1 and Nrx1β.
Figure 3.

TBS of hippocampal slices increased the number of GluA1+Nrx1β+ synapses present in isolated synaptosomes. A, fEPSP recorded in CA1 after stimulation of Schafer collaterals in hippocampal slices. B, After 30–60 min of stable LTP, CA1 area (∼0.4 mm2) surrounding the recording electrode was punched out (dotted line) to immediately obtain the P2 fraction. C, Percentage GluA1+Nrx1β+ size-gated synaptosomes increases after TBS-LTP, relative to control. D, Data are mean ± SEM; n = 7 independent experiments, 7 rats. *p = 0.019 (unpaired Student's t test).
Further analysis of the extent to which FASS-LTP reproduces the essential features of electrically induced LTP revealed important parallels. Time course analysis demonstrated that the early (15 min) increase in the proportion of GluA1+Nrx1β+ events after cLTP stimulation is sustained up to 75 min (Fig. 4A), resembling the long-lasting increase in EPSPs that defines LTP. In addition, we found that our cLTP protocol depends on priming of NMDAR by glycine and on synaptosome KCl depolarization (Fig. 4A), which favors glutamate release and voltage-dependent postsynaptic signaling. In glycine-primed synaptosomes, chemically induced depolarization at −49, −41, and −31 mV using increasing concentrations of KCl (24, 37, and 52 mm) revealed that 37 mm (−41 mV; p < 0.01) and 52 mm (−31 mV; p < 0.05) but not 24 mm KCl (−49 mV) induce cLTP in synaptosomes (Fig. 4B). In contrast, we found a weak cLTP response in glycine-primed synaptosomes depolarized (30 min) by 2.5 mm 4-AP (equimolar substitution of NaCl by 4-AP in the cLTP solution; percentage GluA1+Nrx1β+ basal vs 4-AP = 100.0 ± 14.6 vs 132.2 ± 27.3; p = 0.33, unpaired t test, n = 5, 3- to 4-month-old mice). Importantly, the NMDAR antagonist AP5 blocks the cLTP-driven increase in GluA1+Nrx1β+ synaptosome levels (Fig. 4C), paralleling the NMDAR dependence of hippocampal LTP previously established by electrophysiological recordings in vivo (Morris et al., 1986) and in vitro using brain slices (Collingridge et al., 1983). In addition, we found that cLTP in synaptosomes is blocked by inhibiting Ca2+/calmodulin-kinase II (CaMKII), an enzyme that increases AMPAR conductance via GluA1 phosphorylation (Derkach et al., 1999) (Fig. 4D). Similarly, either K252a (protein tyrosine kinase inhibitor) or anisomycin (protein synthesis inhibitor) prevented the increase in GluA1+Nrx1β+ levels following cLTP stimulation (Fig. 4D). In further parallel, application of TrkB-Fc fusion protein, the BDNF scavenger that prevents electrically induced LTP, also blocked synaptosomal cLTP (Fig. 4D). Finally, because an important pathway for enduring LTP depends on PKA activation (Nguyen and Woo, 2003), we tested the effect of modulators of PKA activity on synaptosomal cLTP. Either H-89 (PKA inhibitor) or SQ22536 (adenylyl cyclase [AC] inhibitor) blocked cLTP (Fig. 4D). Overall, these findings are consistent with the essential roles of CaMKII (Malinow et al., 1989; Silva et al., 1992), tyrosine kinases (O'Dell et al., 1991), protein synthesis (Fonseca et al., 2006), PKA (Nguyen and Woo, 2003), and BDNF signaling (Rex et al., 2007) in LTP, demonstrating that FASS-LTP reproduces the defining characteristics of the long-lasting EPSP enhancement in hippocampus seen after electrical stimulation (i.e., LTP).
GluA1-containing AMPAR are located and concentrated at dendritic spines. However, because extracellular GluA1-labeling detects GluA1 at both synaptic and extrasynaptic synaptosomal surface, we evaluated whether cLTP increases GluA1 levels at the PSD by assessing the physical interaction of GluA1 with PSD95. After cLTP stimulation, GluA1 was immunoprecipitated from 200,000 synaptosomes sorted by size using calibrated beads (0.75–3.0 μm) (Fig. 5A). Compared with nonstimulated synaptosomes, cLTP increased GluA1-PSD95 interaction levels, as quantified by PSD95 immunoblotting (Fig. 5B,D). We further tested GluA1-PSD95 coimmunoprecipitation by PSD95 immunoprecipitation (IP) and GluA1 immunoblotting. Following PSD95 IP, we found increased GluA1 levels in cLTP-stimulated synaptosomes compared with controls maintained in external solution (Fig. 5C,E). As PSD95 is a major scaffolding protein of the PSD, these experiments demonstrate that cLTP increases GluA1 levels at the PSD in synaptosomes.
Figure 5.
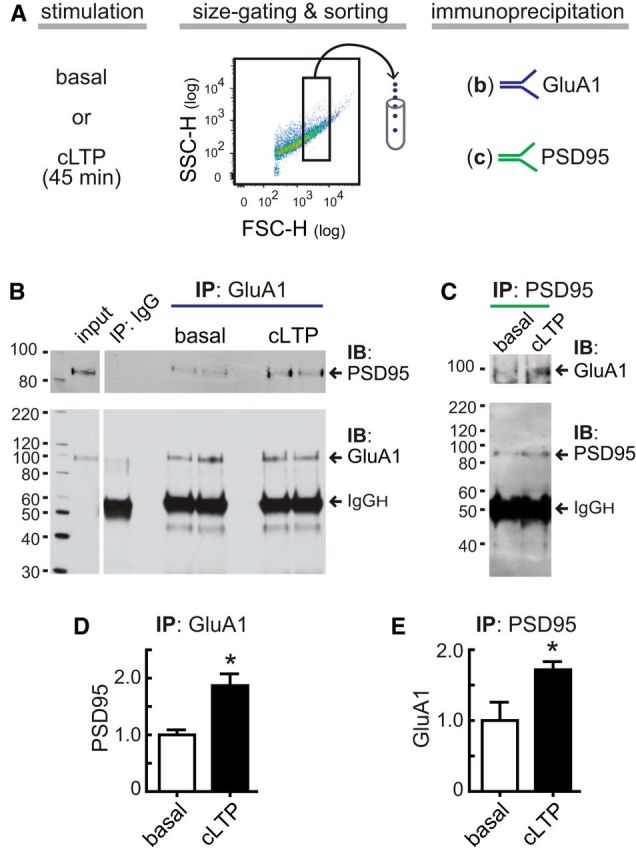
cLTP increases GluA1-PSD95 physical interaction in synaptosomes. A–C, Synaptosomes were maintained in external solution (basal) or stimulated (cLTP). To stop stimulation, synaptosomes were treated with cold 0.1 mm EDTA-PBS and put on ice. Immediately, 200,000 size-gated synaptosomes (Fig. 1A, B) were sorted using a FACSAria Fusion sorter (sample and sort collection tubes were maintained at 4°C during sorting). Sorted synaptosomes were immediately lysed and immunoprecipitated using (B) rabbit anti-GluA1 (N-terminal) and (C) rabbit anti-PSD95 (amino acids 50–150) antibodies. As a negative control, a synaptosome sample was immunoprecipitated with a control rabbit IgG. IP was followed by immunoblotting (IB) using: (1) PSD95 (mouse) and (2) GluA1 (rabbit) antibodies in B; and (1) GluA1 (rabbit) and (2) PSD95 (mouse) antibodies in C. Membranes were stripped before the second IB. Membranes show representative experiments. D, PSD95 level following GluA1 IP. *p =0.018 (unpaired Student's t test). n = 3 independent experiments run in duplicate. E, GluA1 level following PSD95 IP. *p =0.045 (unpaired Student's t test). n = 4 independent experiments run in duplicate. Values normalized to basal state. Data are mean ± SEM.
LTP is impaired in synapses from mouse AD models
AD mouse models commonly exhibit LTP deficits: e.g., 3xTg (Oddo et al., 2003), Tg2576 (Jacobsen et al., 2006), 5xFAD (Kimura and Ohno, 2009), P301S (Yoshiyama et al., 2007), and J20 (Saganich et al., 2006); however, whether synaptic (e.g., dysregulation of the spine signaling) (Penzes et al., 2011) or extrasynaptic mechanisms (e.g., dysregulation of extrasynaptic NMDAR) (Li et al., 2011) play a major role in AD-related LTP deficits is not fully understood. Notably, FASS-LTP is an ideal system to test the possible contribution of synaptic mechanisms. We conducted FASS-LTP analysis in young (3–4 months) and middle-aged (12–15 months) nontransgenic (non-tg) and 3xTg mice, a well-known model of AD (Oddo et al., 2003). FASS-LTP revealed that, although comparable GluA1+Nrx1β+ levels after chemical stimulation were observed in young non-tg and 3xTg mice, cLTP was absent in aged 3xTg mice (p < 0.001, young vs aged 3xTg; Fig. 6A,B). This profile is consistent with electrophysiological recordings in 3xTg showing intact LTP at 3–4 months but significant deficits in 6- to 7-month-old mice (Oddo et al., 2003). In addition, FASS-LTP detected an age-related impairment of cLTP in non-tg mice (p < 0.01, young vs aged non-Tg; Fig. 6A,B), consistent with the decline in hippocampal LTP observed in mice at mid-life (∼15 months) (Bach et al., 1999). However, cLTP was significantly lower in aged 3xTg compared with aged non-tg mice (p < 0.05, 3xTg vs non-tg; Fig. 6A,B), supporting the idea that transgene-driven expression of AD pathology further reduces synaptic plasticity beyond the effects of aging alone (Oddo et al., 2003). We also used FASS-LTP to assess synaptic plasticity in the Tg2576 model, one of the best characterized mouse models of AD (Hsiao et al., 1996; Jacobsen et al., 2006). Consistent with in vivo and in vitro electrophysiological recordings showing hippocampal LTP impairments in middle-aged (13–16 months) Tg2576 mice (Chapman et al., 1999), FASS-LTP detected a reduced cLTP response at 13–16 months in Tg2576 mice compared with age-matched controls (p < 0.05, Tg2576 vs non-tg; Fig. 6C,D). Thus, through using two well-characterized AD mouse models, we found strong support for the idea that AD-driven mechanisms impair LTP directly at the synapse.
Figure 6.
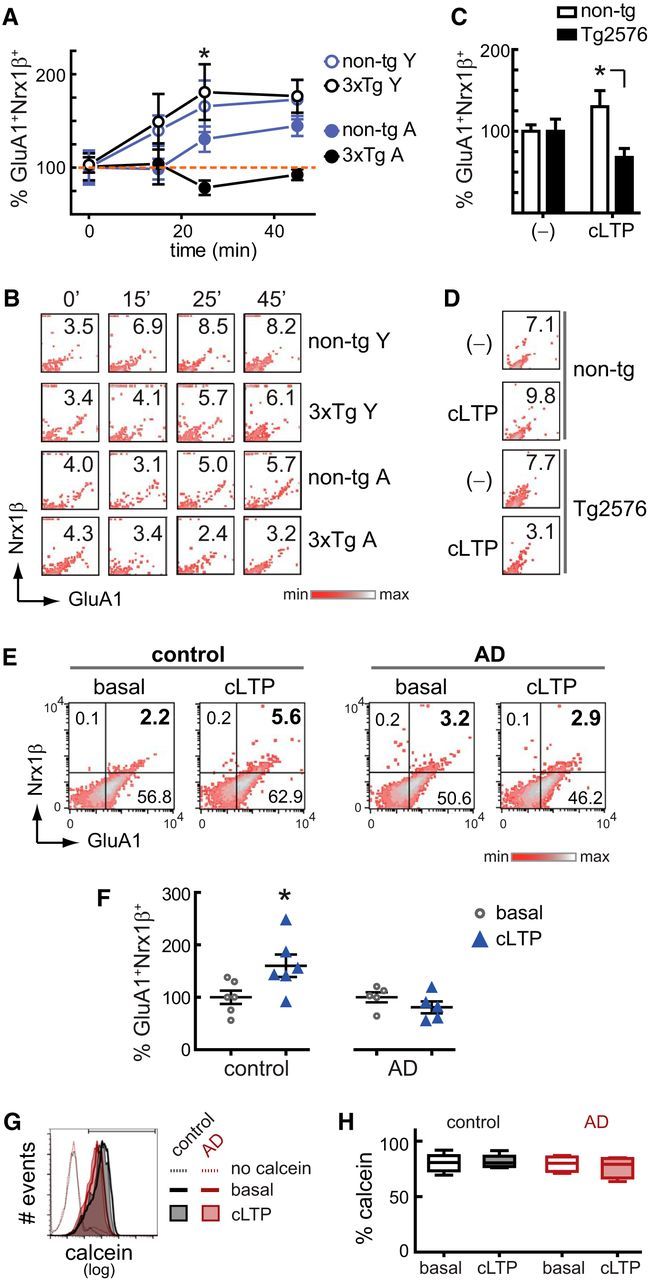
FASS-LTP captures synaptic deficits in AD transgenic mice and in the Alzheimer-diseased brain. A, Time course of cLTP (gly+52 mm KCl) in synaptosomes from young (Y, 3–4 months) and middle-aged (A, 12–15 months) nontransgenic (non-tg, B6129SF2/J) and 3xTg male mice. For each time point, values were normalized to basal state (time: 0); non-tg Y (n = 6), 3xTg Y (n = 7), non-tg A (n = 7), 3xTg A (n = 5). Data are mean ± SEM. *p < 0.05, young versus middle-aged 3xTg (Bonferroni's post hoc, two-way ANOVA). B, Representative upper-right quadrants from GluA1-Nrx1β plots show percentage GluA1+Nrx1β+ events at the indicated time points in synaptosomes from young and middle-aged non-tg and 3xTg mice. C, cLTP in middle-aged (13–16 months) nontransgenic (non-tg, B6;SJL) and Tg2576 mice. Percentage GluA1+Nrx1β+ events were normalized to synaptosomes maintained in external solution (−); non-tg (n = 5; 1 female, 4 males), Tg2576 (n = 6; 3 females, 3 males). Data are mean ± SEM. *p < 0.05 (ANOVA, Tukey post hoc test). D, Representative upper-right quadrants from GluA1-Nrx1β plots show percentage GluA1+Nrx1β+ events in synaptosomes from non-tg and Tg2576 mice. E, cLTP in cryopreserved synaptosomes from human brain cortex (Brodmann area A7); controls (n = 6) and AD (n = 6) cases matched by age and PMI. cLTP response, only observed in control cases, was not significantly affected by age (89–101 years, p =0.88) or by PMI (3.45–8.33 h, p =0.16) (linear regression). F, Percentage GluA1+Nrx1β+ events normalized to synaptosomes maintained in external solution (basal state). Data are mean ± SEM. Individual vales are shown. *p =0.036 (unpaired Student's t test). G, Representative histograms show calcein staining in size-gated synaptosomes from one control and one AD case, in both basal (37°C, 45 min) and cLTP conditions (37°C, 45 min). Synaptosomal fractions were loaded with 20 nm calcein AM before stimulation. The threshold for endogenous/nonspecific fluorescence was set with a sample maintained in external solution (37°C, 45 min) but not loaded with calcein AM; the upper bar in the plot shows the region of positive signal. H, Overall results showing percentage of calcein-positive synaptosomes in control (n = 5) and AD (n = 4) cases. p = 0.986 (Kruskal–Wallis test). For case information, see Table 1.
Table 1.
Case information
| Case ID | Age (yr) | PMI (hr) | Sex | Braak score/amyloid deposits | Additional information |
|---|---|---|---|---|---|
| Controlsa | |||||
| 1–13 | 99 | 6.00 | Male | I/0 | |
| 35–12 | 101 | 4.50 | Male | I/0 | Cerebral amyloid angiopathy, multiple infarctions |
| 2–11 | 97 | 4.10 | Male | II/A | |
| 18–11 | 96 | 3.45 | Male | II/B | |
| 23–12 | 95 | 6.00 | Female | III/0 | Hippocampal sclerosis |
| 21–13 | 89 | 8.33 | Female | I/B | |
| AD | |||||
| 21–10 | 97 | 6.10 | Female | V/C | |
| 5–13 | 99 | 4.92 | Female | V/C | Vascular dementia |
| 11–09 | 77 | 5.50 | Male | VI/C | |
| 33–09 | 93 | 6.35 | Male | VI/C | |
| 36–12 | 56 | 5.25 | Female | VI/C | Down's syndrome |
| 37–15 | 87 | 6.03 | Female | VI/C | |
| 43–15b | 83 | 2.65 | Female | V/C | Hippocampal sclerosis |
| 44–15b | 79 | 5.63 | Female | VI/C | Hippocampal sclerosis |
aControl cases included aged cognitively normal controls with non-AD diagnoses.
bOnly tested on drug screening experiments (Fig. 7).
LTP is impaired in synapses from human AD brain
Although animal studies have consistently demonstrated LTP deficits in mouse models of AD (Oddo et al., 2003; Jacobsen et al., 2006; Saganich et al., 2006; Yoshiyama et al., 2007; Kimura and Ohno, 2009), direct evidence of LTP deficits in human AD brain has been elusive, primarily due to methodological limitations. To address this fundamental question, we used FASS-LTP on synaptosomal fractions from cryopreserved human cortex. We found that, although cLTP stimulation induced an increase in GluA1+Nrx1β+ levels in synaptosomes from human control tissue (p < 0.05), there was no detectable change in GluA1+Nrx1β+ levels in AD tissue (Fig. 6E,F) (comparable age [p = 0.158] and postmortem delay [p = 0.713] between groups). In contrast to this difference in cLTP response, comparable levels of calcein staining (viability) were detected in synaptosomes of control and AD cases either maintained in basal conditions or cLTP stimulated (p = 0.986; Fig. 6G,H). Overall, these data provide the first direct evidence to support the idea that synapses from the AD-diseased brain are intrinsically defective in LTP.
Based on the unique capacity of FASS-LTP to monitor synaptic plasticity in human brain tissue, a widely useful application of this method would be drug screening, performed directly in human brain tissue, to identify candidates that restore LTP to defective synapses in AD. Indeed, the need for better identification of candidate drugs for treatment of AD is underscored by the high failure rate of AD drug clinical trials (99.6% failures on >400 trials) (Cummings et al., 2014) despite the preclinical evidence of drug effectiveness demonstrated in animal tissue. We next use FASS-LTP to screen for drugs that restore LTP in AD, testing multiple agents in parallel directly in human AD tissue (40 synaptosomal samples obtained from 100–200 mg tissue).
Enhancement of cGMP signaling rescues LTP in the AD-diseased brain
Pharmacological enhancement of LTP has been widely focused on approaches that augment the PKA/CREB pathway, a signaling cascade that depends on cAMP production by AC (Nguyen and Woo, 2003). Because cAMP levels are reduced by phosphodiesterases (PDEs) (a family of enzymes that hydrolyze cyclic nucleotides), PDE inhibitors (PDEi) (which prevent the chemical breakdown of cAMP and cGMP) represent a potential treatment strategy for enhancing LTP and preventing memory decline (García-Osta et al., 2012). The effectiveness of PDEi to enhance LTP and/or memory has been demonstrated in animal models with inhibition of PDE2 (Boess et al., 2004), PDE4 (Gong et al., 2004; Rutten et al., 2008), PDE5 (Prickaerts et al., 2002; Puzzo et al., 2009; Cuadrado-Tejedor et al., 2011; Reneerkens et al., 2012; Akkerman et al., 2015), and PDE9 (Kroker et al., 2012; Kroker et al., 2014). Whether PDE inhibition similarly enhances LTP in human tissue is unknown.
We used FASS-LTP in human synaptosomes from control and AD cases to interrogate in parallel the effectiveness of 7 selective PDE inhibitors to enhance LTP, specifically inhibiting PDE2 (Bay-60–7550, 0.5 μm), PDE4 (rolipram, 30 μm), PDE5 (vardenafil, 0.1 μm; sildenafil, 0.5 μm; tadalafil, 0.2 μm), and PDE9 (Bay-73–6691, 10 μm). In parallel, we tested forskolin (adenylyl cyclase activator, ACactiv) and cinaciguat (guanylyl cyclase activator, GCactiv), as well as functionally relevant combinations of PDEi with ACactiv or GCactiv. Thus, a total of 18 treatments were simultaneously tested on basal conditions (external solution) and after cLTP (i.e., ∼40 human synaptosome samples) (Fig. 7A–C). We found that, in synaptosomes from AD cases, GluA1+Nrx1β+ levels were not increased after cLTP stimulation, even in synaptosomes treated with PDEi alone (in the absence of ACactiv or GCactiv) (Fig. 7A,B). In contrast, cLTP was rescued in synaptosomes from AD cases by the combination of GCactiv with PDE5 inhibition (vardenafil) or PDE9 inhibition (Bay-73–6691) (p < 0.05; Fig. 7A,B), suggesting that synaptic plasticity in the human AD brain may be rescued by enhancing cGMP signaling. In synaptosomes from control human cases, GluA1+Nrx1β+ levels were increased in basal conditions after cLTP stimulation (173 ± 16%, p = 0.023 vs basal, n = 6, unpaired Student's t test), demonstrating intact capacity for synaptic potentiation. However, no further increase in the number of potentiated synapses was observed with any tested treatment (p > 0.05; Fig. 8A). Interestingly, while basal GluA1+Nrx1β+ levels (in the absence of cLTP stimulation) were not significantly affected by any drug treatment either in AD or in control cases, a trend for increased basal potentiation state was observed in the presence of PDE5 inhibition (vardenafil) with GCactiv in synaptosomes from control human cases (Fig. 8B).
Figure 7.
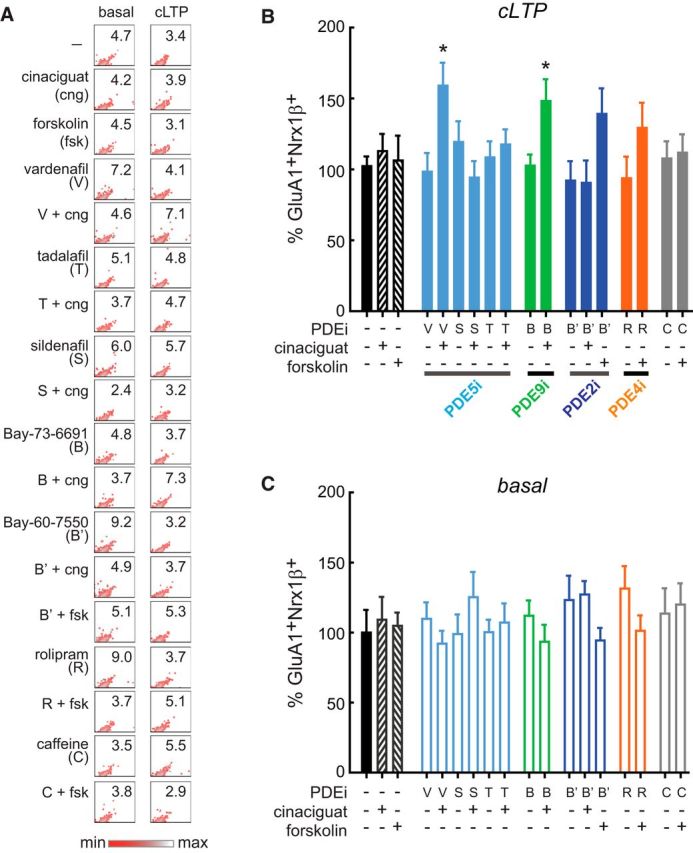
Drug screening in AD human synapses by FASS-LTP. A, Synaptosomes from AD cases (n = 8) were preincubated for 20 min with PDEi or vehicle before cLTP. Forskolin 50 μm or cinaciguat 300 nm was added 10 min before cLTP, as indicated. Representative upper-right quadrants from GluA1-Nrx1β density plots show percentage GluA1+Nrx1β+ events following the above described treatments in both basal and cLTP conditions. B, cLTP responses. Data are mean ± SEM. *p < 0.05 versus cLTP (ANOVA, Dunnett post hoc test). C, In parallel, a set of synaptosomes were maintained in external solution (basal) and similarly treated with PDEi (20 min), forskolin and cinaciguat (10 min). Data are mean ± SEM. p > 0.05 (ANOVA). GluA1+Nrx1β+ levels in basal conditions and after cLTP were normalized to vehicle-treated synaptosomes in basal state. PDE5i: vardenafil 0.1 μm (V); sildenafil 0.5 μm (S); tadalafil 0.2 μm (T); PDE9i: Bay-73–669 10 μm (B); PDE2i: Bay-60–7550 0.5 μm (B′); PDE4i: rolipram 30 μm (R); caffeine 100 μm (C) (nonselective and weak PDEi) (Boswell-Smith et al., 2006). Forskolin was combined with B′, R, and C, which inhibit cAMP breakdown; whereas cinaciguat was combined with V, S, T, B, and B′ to increase cGMP production while preventing cGMP hydrolysis. B′ was combined with both forskolin and cinaciguat as this compound inhibits PDE2, an enzyme that hydrolyzes both cAMP and cGMP. Treatments are shown in identical order in both cLTP (B) and basal (C) conditions. Table 1 contains information on AD cases.
Figure 8.
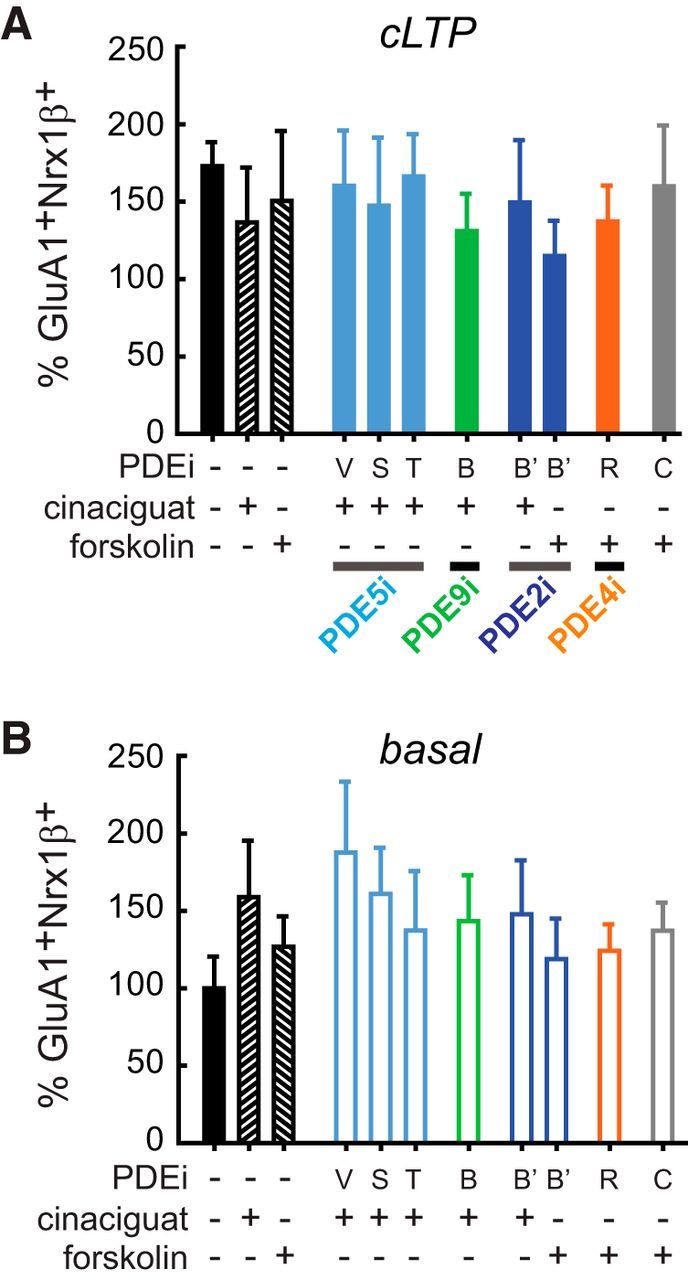
Drug screening in human synapses from control cases by FASS-LTP. A, Synaptosomes from control cases (n = 6) were preincubated for 20 min with PDEi or vehicle before cLTP. Forskolin 50 μm or cinaciguat 300 nm was added 10 min before cLTP, as indicated. Data are mean ± SEM. p > 0.05 (ANOVA). B, In parallel, a set of synaptosomes were maintained in external solution (basal) and similarly treated with PDEi (20 min), forskolin and cinaciguat (10 min). Data are mean ± SEM. p > 0.05 (ANOVA). GluA1+Nrx1β+ levels in basal conditions and after cLTP were normalized to vehicle-treated synaptosomes in basal state. PDE5i: vardenafil 0.1 μm (V); sildenafil 0.5 μm (S); tadalafil 0.2 μm (T); PDE9i: Bay-73–669 10 μm (B); PDE2i: Bay-60–7550 0.5 μm (B′); PDE4i: rolipram 30 μm (R); caffeine 100 μm (C) (nonselective and weak PDEi) (Boswell-Smith et al., 2006). Forskolin was combined with B′, R, and C, which inhibit cAMP breakdown; whereas cinaciguat was combined with V, S, T, B, and B′ to increase cGMP production while preventing cGMP hydrolysis. B′ was combined with both forskolin and cinaciguat as this compound inhibits PDE2, an enzyme that hydrolyzes both cAMP and cGMP. Treatments are shown in identical order in both cLTP (A) and basal (B) conditions. Table 1 contains information of cases.
These data demonstrate that FASS-LTP is a sensitive and efficient approach to screen for drugs acting directly on mechanisms underlying human LTP, allowing for simultaneous testing of multiple samples and treatment conditions. FASS-LTP identified PDE5 and PDE9, two enzymes expressed in human neurons (Kleiman et al., 2012; Teich et al., 2016), as specific molecular targets for inhibition to rescue synaptic potentiation in human AD synapses. The data also indicate that PDE inhibition would be minimally effective to enhance potentiation in synapses that have intact cLTP, observed in control human cases. The lack of further cLTP enhancement in control human tissue resembles the limit on the maximum LTP capable of being induced by a series of bursts (LTP “ceiling”), and is consistent with the idea that that the LTP “ceiling” is relatively constant at the synapse level and may not be affected by pharmacological manipulations (Arai et al., 1994).
Discussion
Using FASS-LTP, we demonstrate that the increase in surface GluA1 and Nrx1β levels by cLTP in synaptosomes closely resembles synapse potentiation, the unitary event underlying LTP in intact circuitries. Indeed, we found that electrical stimulation in hippocampal slices also increases synaptosomal surface levels of GluA1 and Nrx1β. Consistent with this finding, our data demonstrate that the cLTP response in synaptosomes mechanistically parallels the facilitation of synaptic transmission following electrically induced LTP in brain slices (e.g., dependence on CaMKIIand BDNF signaling). Further, using our sensitive flow cytometry approach to study plasticity directly at the synapse (Fig. 9), we demonstrate that LTP is impaired in synapses from animal models of neurodegeneration, but more importantly, in human AD brain. The application of FASS-LTP directly to human brain tissue represents an innovative strategy to efficiently identify plasticity-enhancing drugs that are effective in humans. Further, use of FASS-LTP to screen drugs before preclinical pharmacological target validation would speed translation from animal models to clinical trials, a major advance in the field.
Figure 9.

FASS-LTP overview. 1, Isolation of crude synaptosomal fraction (P2) containing intact synaptic units (sealed pre- and postsynaptic compartments) along with presynaptic terminals, free mitochondria, and cellular debris. 2, Glycine-KCl stimulation (cLTP). 3, Immunolabeling for surface (no permeabilization) GluA1 and Nrx1β to identify potentiated synapses. In accordance with previous reports, our data support a model where cLTP simultaneously orchestrates an upregulation of postsynaptic GluA1 levels while facilitating the expression of presynaptic Nrx1β at synaptosomal surface. In addition, reduced endocytosis (Dong et al., 2015) (dashed arrows) may also contribute to increase surface GluA1 and Nrx1β following cLTP. 4, Flow cytometry identifies potentiated synapses by size and GluA1+Nrx1β+(extracellular) double labeling.
Our study incorporates multiple features in one design to study LTP in isolated synaptosomes. Several key features of our approach extend prior studies, which have demonstrated that synaptosome stimulation with glutamate, glycine, and/or KCl increases GluA1 and GluA2 levels in purified PSD fractions (Corera et al., 2009), as well as the synthesis of proteins involved in synaptic plasticity (α-CaMKII, Arc, Homer, and BDNF) (Bagni et al., 2000; Gharami and Das, 2014). We have used a fluorescence-labeled antibody directed to the N-terminal domain of GluA1 to detect surface localized GluA1 extending previous methods using [3H]-AMPA to detect AMPA receptors in isolated synaptosome membranes (Corera et al., 2009). In addition, we also demonstrate that glycine-KCl stimulation increases GluA1-PSD95 physical interaction in size-sorted synaptosomes. GluA1 clustering at the PSD likely reflects GluA1-containing endosome insertion at the postsynaptic plasma membrane, as this is a main process regulating activity-dependent synaptic trafficking of AMPAR (Ehlers, 2000; Park et al., 2004, 2006). The introduction of flow cytometry for synaptosome analysis (flow synaptometry) provides a means to efficiently detect changes in surface localized GluA1 and Nrx1β, two key synaptic receptors for enduring LTP. The use of double label with GluA1 and Nrx1 ensures that we focus on synaptosomes with both presynaptic and postsynaptic elements. Our data indicate that a significant number of “integral synapses” can be detected by analyzing thousands of particles using flow synaptometry. Indeed, we have consistently found that up to ∼25% of the size-gated synaptosomes increase surface GluA1 levels after cLTP stimulation, thus suggesting that a reliable fraction of particles (∼2500 of 10,000 acquired events) contains postsynaptic sealed spines with essential elements to support LTP (e.g., functional trafficking and cytoskeletal machinery), at least in the 1 to 2 h time window after stimulation.
In developing our FASS-LTP approach, while cLTP responses in neuronal cultures are evident with glycine stimulation alone (Lu et al., 2001; Park et al., 2006), we reasoned that synaptosomal stimulation would benefit from additional KCl-dependent depolarization because synaptosomes lack firing-evoked neurotransmitter release. Therefore, we combined glycine pretreatment with mild KCl (37 mm) depolarization to emulate in vitro high activity states in synaptosomes. Our sequential glycine-KCl protocol robustly increases surface levels of GluA1 and Nrx1β over a time period of 15 min to at least 90 min, inducing a long-lasting response that is stronger than that observed with glycine-only or KCl-only stimulations (Fig. 4A).
In contrast to current approaches to study activity-dependent responses by electrophysiological or biochemical methods in brain slices, neuronal cultures, and synaptosome preparations, FASS-LTP allows multiple conditions to be tested in parallel in a relatively short time, as the approach is based on simple procedures, requires only a small amount of tissue (milligrams), and is highly economical as drug testing is performed in small reaction volumes (200–400 μl). In particular, we demonstrate that FASS-LTP can simultaneously test 30–40 preparations from human brain tissue in ∼5 h, using as little as 0.05–20 μg of drugs in each experiment. Further, flow cytometry multiparameter analysis (Kling, 2015) in a single synaptosomal preparation may allow tracking cLTP responses in specific subsets of synapses (e.g., using transgenic mice expressing fluorescent reporters on neuron subtypes) (Lobo et al., 2006).
Despite a worldwide effort to identify drugs that alleviate memory deficits, such as occur in AD, no effective treatments currently exist despite >400 clinical trials (Cummings et al., 2014). It has been suggested that the failure to translate animal model findings to humans may be overcome by target validation using a preclinical screening platform that is based on testing in adult human brain tissue (Dragunow, 2008). Our data indicate that FASS-LTP is a highly translational approach, as it has revealed pharmaceutical agents that enhance LTP in human brain synaptosomes. Indeed, we have identified the cGMP pathway as a target for rescuing cLTP in AD-dysfunctional synapses. Our data show that PDE5 inhibition by vardenafil, an FDA-approved drug that prevents cGMP breakdown, increased GluA1+Nrx1β+ levels in synaptosomes treated with cinaciguat, a GCactivator in Phase IIb investigation (Clinical trial NCT01064037) that increases cGMP levels. Although vardenafil is currently used for treating vascular dysfunction and pulmonary hypertension, it crosses the blood–brain barrier (Reneerkens et al., 2012), a key characteristic for consideration in the treatment of cognitive decline. Consistent with our data, vardenafil increases brain cGMP levels and improves memory in adult rats (Prickaerts et al., 2002; Reneerkens et al., 2012; Bollen et al., 2015); specifically in standard housed rats but not in rats housed in an enriched environment, suggesting a ceiling effect under optimal cognitive stimulation (Akkerman et al., 2014). Indeed, studies in humans suggest that vardenafil may improve cognition in low-cognitive performers, but not in high-level educated subjects (Reneerkens et al., 2013). Surprisingly, the other PDE5 inhibitors that we tested (sildenafil and tadalafil) did not enhance the cLTP response. However, it is known that vardenafil is more potent than sildenafil for improving memory in rats (Prickaerts et al., 2002), even though these two PDE5i have similar structures, suggesting that further drug optimization of PDE inhibitors could be achieved with chemical modifications. Further consistent with the idea that synaptic plasticity in the AD brain may be rescued by enhancing cGMP signaling, we also found that in the presence of cinaciguat (guanylyl cyclase activator), the PDE9 inhibitor Bay-73–6691 increased the cLTP response in AD synapses. Supporting this finding, Bay-73–6691 increases hippocampal cGMP levels, improves memory in Tg2576 mice, and restores LTP impaired by amyloid β oligomers (Kroker et al., 2014). The particular effect of vardenafil and Bay-73–6691 in AD synaptosomes is further supported by mRNA analysis showing that in AD cortical tissue the expression of PDE5 is significantly increased, and PDE9 expression shows a tendency to increase (Ugarte et al., 2015), whereas the expression of PDE2 (Reyes-Irisarri et al., 2007) and PDE4 (Ugarte et al., 2015) is not altered, relative to age-matched controls. Although further research is needed to evaluate the efficacy of cGMP-related PDEi to improve cognitive in AD, our data provide a proof of concept for FASS-LTP as an efficient method for drug screening and preclinical target validation.
Although there are a number of challenges with using postmortem human brain tissue in research, with one of the most significant being the PMI, several reports indicate that basic biochemical reactions remain well preserved in the postmortem human brain. For instance, protein–protein interactions in human PSD fractions are relatively insensitive to variation in PMI (<15 h) or age (relatively constant from 70 to 90 years) (Hahn et al., 2009). Moreover, glycine-dependent NMDAR activation (Hahn et al., 2006) and insulin signaling (Talbot et al., 2012) are relatively intact in low-PMI (<19 h) brain tissues, suggesting that glycine-dependent GluR1 and Nrx1β surface expression in synaptosomes is likely to be similarly resistant to some variables associated with a postmortem approach. Indeed, our data show that PMI does not have a significant effect on FASS-LTP when the delays are <9 h.
In conclusion, FASS-LTP provides new data directly on synapses and the status of LTP in human brain. Importantly, we provide support for a pharmacological strategy based on cGMP signaling enhancement to rescue LTP in the AD brain. Thus, our approach offers an exciting opportunity to scale-up LTP analyses to evaluate the potential of pharmaceutical and behavioral interventions to enhance plasticity in normal and diseased brains.
Footnotes
This work was supported by National Institutes of Health Grants R21-AG048506, P01-AG000538, and RO1-AG34667 to C.W.C., UC MEXUS-CONACYT Grant CN-16-170 to G.A.P. and C.W.C., and National Institutes of Health NS45260 and ONR MURI-N00014-10-1-0072 to G.L. Human tissue was obtained from the Alzheimer's Disease Research Center at University of California-Irvine (NIA P50 AG016573). We thank Shikha Snigdha for comments on the manuscript; Araceli Perez-Lopez for helpful advice on flow cytometry analysis; Frank LaFerla for providing 3xTg mice; and Andrea Tenner, Michael Hernandez, and Sophie Chu for the use of the FACScalibur cytometer, as well as providing Tg2576 mice.
The authors declare no competing financial interests.
References
- Akkerman S, Prickaerts J, Bruder AK, Wolfs KH, De Vry J, Vanmierlo T, Blokland A (2014) PDE5 inhibition improves object memory in standard housed rats but not in rats housed in an enriched environment: implications for memory models? PLoS One 9:e111692. 10.1371/journal.pone.0111692 [DOI] [PMC free article] [PubMed] [Google Scholar]
- Akkerman S, Blokland A, van Goethem NP, Cremers P, Shaffer CL, Osgood SM, Steinbusch HW, Prickaerts J (2015) PDE5 inhibition improves acquisition processes after learning via a central mechanism. Neuropharmacology 97:233–239. 10.1016/j.neuropharm.2015.04.019 [DOI] [PubMed] [Google Scholar]
- Arai A, Black J, Lynch G (1994) Origins of the variations in long-term potentiation between synapses in the basal versus apical dendrites of hippocampal neurons. Hippocampus 4:1–9. 10.1002/hipo.450040103 [DOI] [PubMed] [Google Scholar]
- Bach ME, Barad M, Son H, Zhuo M, Lu YF, Shih R, Mansuy I, Hawkins RD, Kandel ER (1999) Age-related defects in spatial memory are correlated with defects in the late phase of hippocampal long-term potentiation in vitro and are attenuated by drugs that enhance the cAMP signaling pathway. Proc Natl Acad Sci U S A 96:5280–5285. 10.1073/pnas.96.9.5280 [DOI] [PMC free article] [PubMed] [Google Scholar]
- Bagni C, Mannucci L, Dotti CG, Amaldi F (2000) Chemical stimulation of synaptosomes modulates alpha-Ca2+/calmodulin-dependent protein kinase II mRNA association to polysomes. J Neurosci 20:RC76. [DOI] [PMC free article] [PubMed] [Google Scholar]
- Baumgarth N, Roederer M (2000) A practical approach to multicolor flow cytometry for immunophenotyping. J Immunol Methods 243:77–97. 10.1016/S0022-1759(00)00229-5 [DOI] [PubMed] [Google Scholar]
- Bliss TV, Collingridge GL (1993) A synaptic model of memory: long-term potentiation in the hippocampus. Nature 361:31–39. 10.1038/361031a0 [DOI] [PubMed] [Google Scholar]
- Boess FG, Hendrix M, van der Staay FJ, Erb C, Schreiber R, van Staveren W, de Vente J, Prickaerts J, Blokland A, Koenig G (2004) Inhibition of phosphodiesterase 2 increases neuronal cGMP, synaptic plasticity and memory performance. Neuropharmacology 47:1081–1092. 10.1016/j.neuropharm.2004.07.040 [DOI] [PubMed] [Google Scholar]
- Bollen E, Akkerman S, Puzzo D, Gulisano W, Palmeri A, D'Hooge R, Balschun D, Steinbusch HW, Blokland A, Prickaerts J (2015) Object memory enhancement by combining sub-efficacious doses of specific phosphodiesterase inhibitors. Neuropharmacology 95:361–366. 10.1016/j.neuropharm.2015.04.008 [DOI] [PubMed] [Google Scholar]
- Boswell-Smith V, Spina D, Page CP (2006) Phosphodiesterase inhibitors. Br J Pharmacol 147 [Suppl 1]:S252–S257. [DOI] [PMC free article] [PubMed] [Google Scholar]
- Bradford HF. (1970) Metabolic response of synaptosomes to electrical stimulation: release of amino acids. Brain Res 19:239–247. 10.1016/0006-8993(70)90437-3 [DOI] [PubMed] [Google Scholar]
- Chapman PF, White GL, Jones MW, Cooper-Blacketer D, Marshall VJ, Irizarry M, Younkin L, Good MA, Bliss TV, Hyman BT, Younkin SG, Hsiao KK (1999) Impaired synaptic plasticity and learning in aged amyloid precursor protein transgenic mice. Nat Neurosci 2:271–276. 10.1038/6374 [DOI] [PubMed] [Google Scholar]
- Chen RQ, Wang SH, Yao W, Wang JJ, Ji F, Yan JZ, Ren SQ, Chen Z, Liu SY, Lu W (2011) Role of glycine receptors in glycine-induced LTD in hippocampal CA1 pyramidal neurons. Neuropsychopharmacology 36:1948–1958. 10.1038/npp.2011.86 [DOI] [PMC free article] [PubMed] [Google Scholar]
- Collingridge GL, Kehl SJ, McLennan H (1983) Excitatory amino acids in synaptic transmission in the Schaffer collateral-commissural pathway of the rat hippocampus. J Physiol 334:33–46. 10.1113/jphysiol.1983.sp014478 [DOI] [PMC free article] [PubMed] [Google Scholar]
- Corera AT, Doucet G, Fon EA (2009) Long-term potentiation in isolated dendritic spines. PLoS One 4:e6021. 10.1371/journal.pone.0006021 [DOI] [PMC free article] [PubMed] [Google Scholar]
- Cotman CW, Banker G, Churchill L, Taylor D (1974) Isolation of postsynaptic densities from rat brain. J Cell Biol 63:441–455. 10.1083/jcb.63.2.441 [DOI] [PMC free article] [PubMed] [Google Scholar]
- Cuadrado-Tejedor M, Hervias I, Ricobaraza A, Puerta E, Pérez-Roldan JM, Garcia-Barroso C, Franco R, Aguirre N, García-Osta A (2011) Sildenafil restores cognitive function without affecting beta-amyloid burden in a mouse model of Alzheimer's disease. Br J Pharmacol 164:2029–2041. 10.1111/j.1476-5381.2011.01517.x [DOI] [PMC free article] [PubMed] [Google Scholar]
- Cummings JL, Morstorf T, Zhong K (2014) Alzheimer's disease drug-development pipeline: few candidates, frequent failures. Alzheimers Res Ther 6:37. 10.1186/alzrt269 [DOI] [PMC free article] [PubMed] [Google Scholar]
- Daniel JA, Malladi CS, Kettle E, McCluskey A, Robinson PJ (2012) Analysis of synaptic vesicle endocytosis in synaptosomes by high-content screening. Nat Protoc 7:1439–1455. 10.1038/nprot.2012.070 [DOI] [PubMed] [Google Scholar]
- Derkach V, Barria A, Soderling TR (1999) Ca2+/calmodulin-kinase II enhances channel conductance of alpha-amino-3-hydroxy-5-methyl-4-isoxazolepropionate type glutamate receptors. Proc Natl Acad Sci U S A 96:3269–3274. 10.1073/pnas.96.6.3269 [DOI] [PMC free article] [PubMed] [Google Scholar]
- de Wit J, Sylwestrak E, O'Sullivan ML, Otto S, Tiglio K, Savas JN, Yates JR 3rd, Comoletti D, Taylor P, Ghosh A (2009) LRRTM2 interacts with Neurexin1 and regulates excitatory synapse formation. Neuron 64:799–806. 10.1016/j.neuron.2009.12.019 [DOI] [PMC free article] [PubMed] [Google Scholar]
- Dong Z, Han H, Li H, Bai Y, Wang W, Tu M, Peng Y, Zhou L, He W, Wu X, Tan T, Liu M, Wu X, Zhou W, Jin W, Zhang S, Sacktor TC, Li T, Song W, Wang YT (2015) Long-term potentiation decay and memory loss are mediated by AMPAR endocytosis. J Clin Invest 125:234–247. 10.1172/JCI77888 [DOI] [PMC free article] [PubMed] [Google Scholar]
- Dragunow M. (2008) The adult human brain in preclinical drug development. Nat Rev Drug Discov 7:659–666. 10.1038/nrd2617 [DOI] [PubMed] [Google Scholar]
- Ehlers MD. (2000) Reinsertion or degradation of AMPA receptors determined by activity-dependent endocytic sorting. Neuron 28:511–525. 10.1016/S0896-6273(00)00129-X [DOI] [PubMed] [Google Scholar]
- Fein JA, Sokolow S, Miller CA, Vinters HV, Yang F, Cole GM, Gylys KH (2008) Co-localization of amyloid beta and tau pathology in Alzheimer's disease synaptosomes. Am J Pathol 172:1683–1692. 10.2353/ajpath.2008.070829 [DOI] [PMC free article] [PubMed] [Google Scholar]
- Fonseca R, Nägerl UV, Bonhoeffer T (2006) Neuronal activity determines the protein synthesis dependence of long-term potentiation. Nat Neurosci 9:478–480. 10.1038/nn1667 [DOI] [PubMed] [Google Scholar]
- Fortin DA, Davare MA, Srivastava T, Brady JD, Nygaard S, Derkach VA, Soderling TR (2010) Long-term potentiation-dependent spine enlargement requires synaptic Ca2+-permeable AMPA receptors recruited by CaM-kinase I. J Neurosci 30:11565–11575. 10.1523/JNEUROSCI.1746-10.2010 [DOI] [PMC free article] [PubMed] [Google Scholar]
- Fu Y, Huang ZJ (2010) Differential dynamics and activity-dependent regulation of alpha- and beta-neurexins at developing GABAergic synapses. Proc Natl Acad Sci U S A 107:22699–22704. 10.1073/pnas.1011233108 [DOI] [PMC free article] [PubMed] [Google Scholar]
- García-Osta A, Cuadrado-Tejedor M, García-Barroso C, Oyarzábal J, Franco R (2012) Phosphodiesterases as therapeutic targets for Alzheimer's disease. ACS Chem Neurosci 3:832–844. 10.1021/cn3000907 [DOI] [PMC free article] [PubMed] [Google Scholar]
- Gharami K, Das S (2014) BDNF local translation in viable synaptosomes: implication in spine maturation. Neurochem Int 69:28–34. 10.1016/j.neuint.2014.02.009 [DOI] [PubMed] [Google Scholar]
- Gong B, Vitolo OV, Trinchese F, Liu S, Shelanski M, Arancio O (2004) Persistent improvement in synaptic and cognitive functions in an Alzheimer mouse model after rolipram treatment. J Clin Invest 114:1624–1634. 10.1172/JCI22831 [DOI] [PMC free article] [PubMed] [Google Scholar]
- Gylys KH, Fein JA, Yang F, Cole GM (2004) Enrichment of presynaptic and postsynaptic markers by size-based gating analysis of synaptosome preparations from rat and human cortex. Cytometry A 60:90–96. 10.1002/cyto.a.20031 [DOI] [PubMed] [Google Scholar]
- Hahn CG, Wang HY, Cho DS, Talbot K, Gur RE, Berrettini WH, Bakshi K, Kamins J, Borgmann-Winter KE, Siegel SJ, Gallop RJ, Arnold SE (2006) Altered neuregulin 1-erbB4 signaling contributes to NMDA receptor hypofunction in schizophrenia. Nat Med 12:824–828. 10.1038/nm1418 [DOI] [PubMed] [Google Scholar]
- Hahn CG, Banerjee A, Macdonald ML, Cho DS, Kamins J, Nie Z, Borgmann-Winter KE, Grosser T, Pizarro A, Ciccimaro E, Arnold SE, Wang HY, Blair IA (2009) The post-synaptic density of human postmortem brain tissues: an experimental study paradigm for neuropsychiatric illnesses. PLoS One 4:e5251. 10.1371/journal.pone.0005251 [DOI] [PMC free article] [PubMed] [Google Scholar]
- Hayashi Y, Shi SH, Esteban JA, Piccini A, Poncer JC, Malinow R (2000) Driving AMPA receptors into synapses by LTP and CaMKII: requirement for GluR1 and PDZ domain interaction. Science 287:2262–2267. 10.1126/science.287.5461.2262 [DOI] [PubMed] [Google Scholar]
- Hsiao K, Chapman P, Nilsen S, Eckman C, Harigaya Y, Younkin S, Yang F, Cole G (1996) Correlative memory deficits, Abeta elevation, and amyloid plaques in transgenic mice. Science 274:99–102. 10.1126/science.274.5284.99 [DOI] [PubMed] [Google Scholar]
- Huganir RL, Nicoll RA (2013) AMPARs and synaptic plasticity: the last 25 years. Neuron 80:704–717. 10.1016/j.neuron.2013.10.025 [DOI] [PMC free article] [PubMed] [Google Scholar]
- Hulspas R, O'Gorman MR, Wood BL, Gratama JW, Sutherland DR (2009) Considerations for the control of background fluorescence in clinical flow cytometry. Cytometry B Clin Cytom 76:355–364. 10.1002/cyto.b.20485 [DOI] [PubMed] [Google Scholar]
- Jacobsen JS, Wu CC, Redwine JM, Comery TA, Arias R, Bowlby M, Martone R, Morrison JH, Pangalos MN, Reinhart PH, Bloom FE (2006) Early-onset behavioral and synaptic deficits in a mouse model of Alzheimer's disease. Proc Natl Acad Sci U S A 103:5161–5166. 10.1073/pnas.0600948103 [DOI] [PMC free article] [PubMed] [Google Scholar]
- Jones DG, Bradford HF (1971) Observations on the morphology of mammalian synaptosomes following their incubation and electrical stimulation. Brain Res 28:491–499. 10.1016/0006-8993(71)90057-6 [DOI] [PubMed] [Google Scholar]
- Kimura R, Ohno M (2009) Impairments in remote memory stabilization precede hippocampal synaptic and cognitive failures in 5XFAD Alzheimer mouse model. Neurobiol Dis 33:229–235. 10.1016/j.nbd.2008.10.006 [DOI] [PMC free article] [PubMed] [Google Scholar]
- Kleiman RJ, Chapin DS, Christoffersen C, Freeman J, Fonseca KR, Geoghegan KF, Grimwood S, Guanowsky V, Hajós M, Harms JF, Helal CJ, Hoffmann WE, Kocan GP, Majchrzak MJ, McGinnis D, McLean S, Menniti FS, Nelson F, Roof R, Schmidt AW, et al. (2012) Phosphodiesterase 9A regulates central cGMP and modulates responses to cholinergic and monoaminergic perturbation in vivo. J Pharmacol Exp Ther 341:396–409. 10.1124/jpet.111.191353 [DOI] [PubMed] [Google Scholar]
- Kling J. (2015) Cytometry: measure for measure. Nature 518:439–443. 10.1038/518439a [DOI] [PubMed] [Google Scholar]
- Kroker KS, Rast G, Giovannini R, Marti A, Dorner-Ciossek C, Rosenbrock H (2012) Inhibition of acetylcholinesterase and phosphodiesterase-9A has differential effects on hippocampal early and late LTP. Neuropharmacology 62:1964–1974. 10.1016/j.neuropharm.2011.12.021 [DOI] [PubMed] [Google Scholar]
- Kroker KS, Mathis C, Marti A, Cassel JC, Rosenbrock H, Dorner-Ciossek C (2014) PDE9A inhibition rescues amyloid beta-induced deficits in synaptic plasticity and cognition. Neurobiol Aging 35:2072–2078. 10.1016/j.neurobiolaging.2014.03.023 [DOI] [PubMed] [Google Scholar]
- Li S, Jin M, Koeglsperger T, Shepardson NE, Shankar GM, Selkoe DJ (2011) Soluble Abeta oligomers inhibit long-term potentiation through a mechanism involving excessive activation of extrasynaptic NR2B-containing NMDA receptors. J Neurosci 31:6627–6638. 10.1523/JNEUROSCI.0203-11.2011 [DOI] [PMC free article] [PubMed] [Google Scholar]
- Lobo MK, Karsten SL, Gray M, Geschwind DH, Yang XW (2006) FACS-array profiling of striatal projection neuron subtypes in juvenile and adult mouse brains. Nat Neurosci 9:443–452. 10.1038/nn1654 [DOI] [PubMed] [Google Scholar]
- Lu W, Man H, Ju W, Trimble WS, MacDonald JF, Wang YT (2001) Activation of synaptic NMDA receptors induces membrane insertion of new AMPA receptors and LTP in cultured hippocampal neurons. Neuron 29:243–254. 10.1016/S0896-6273(01)00194-5 [DOI] [PubMed] [Google Scholar]
- Malinow R, Schulman H, Tsien RW (1989) Inhibition of postsynaptic PKC or CaMKII blocks induction but not expression of LTP. Science 245:862–866. 10.1126/science.2549638 [DOI] [PubMed] [Google Scholar]
- Manabe T, Renner P, Nicoll RA (1992) Postsynaptic contribution to long-term potentiation revealed by the analysis of miniature synaptic currents. Nature 355:50–55. 10.1038/355050a0 [DOI] [PubMed] [Google Scholar]
- Maurer UE, Sodeik B, Grünewald K (2008) Native 3D intermediates of membrane fusion in herpes simplex virus 1 entry. Proc Natl Acad Sci U S A 105:10559–10564. 10.1073/pnas.0801674105 [DOI] [PMC free article] [PubMed] [Google Scholar]
- Menon V, Thomas R, Ghale AR, Reinhard C, Pruszak J (2014) Flow cytometry protocols for surface and intracellular antigen analyses of neural cell types. J Vis Exp 18:94. 10.3791/52241 [DOI] [PMC free article] [PubMed] [Google Scholar]
- Molnár E, Baude A, Richmond SA, Patel PB, Somogyi P, McIlhinney RA (1993) Biochemical and immunocytochemical characterization of antipeptide antibodies to a cloned GluR1 glutamate receptor subunit: cellular and subcellular distribution in the rat forebrain. Neuroscience 53:307–326. 10.1016/0306-4522(93)90198-O [DOI] [PubMed] [Google Scholar]
- Mondin M, Labrousse V, Hosy E, Heine M, Tessier B, Levet F, Poujol C, Blanchet C, Choquet D, Thoumine O (2011) Neurexin-neuroligin adhesions capture surface-diffusing AMPA receptors through PSD-95 scaffolds. J Neurosci 31:13500–13515. 10.1523/JNEUROSCI.6439-10.2011 [DOI] [PMC free article] [PubMed] [Google Scholar]
- Morris RG, Anderson E, Lynch GS, Baudry M (1986) Selective impairment of learning and blockade of long-term potentiation by an N-methyl-d-aspartate receptor antagonist, AP5. Nature 319:774–776. 10.1038/319774a0 [DOI] [PubMed] [Google Scholar]
- Morrison JH, Baxter MG (2012) The ageing cortical synapse: hallmarks and implications for cognitive decline. Nat Rev Neurosci 13:240–250. 10.1038/nrn3200 [DOI] [PMC free article] [PubMed] [Google Scholar]
- Muller D, Joly M, Lynch G (1988) Contributions of quisqualate and NMDA receptors to the induction and expression of LTP. Science 242:1694–1697. 10.1126/science.2904701 [DOI] [PubMed] [Google Scholar]
- Musleh W, Bi X, Tocco G, Yaghoubi S, Baudry M (1997) Glycine-induced long-term potentiation is associated with structural and functional modifications of alpha-amino-3-hydroxyl-5-methyl-4-isoxazolepropionic acid receptors. Proc Natl Acad Sci U S A 94:9451–9456. 10.1073/pnas.94.17.9451 [DOI] [PMC free article] [PubMed] [Google Scholar]
- Nabavi S, Fox R, Proulx CD, Lin JY, Tsien RY, Malinow R (2014) Engineering a memory with LTD and LTP. Nature 511:348–352. 10.1038/nature13294 [DOI] [PMC free article] [PubMed] [Google Scholar]
- Negash S, Bennett DA, Wilson RS, Schneider JA, Arnold SE (2011) Cognition and neuropathology in aging: multidimensional perspectives from the Rush Religious Orders Study and Rush Memory And Aging Project. Curr Alzheimer Res 8:336–340. 10.2174/156720511795745302 [DOI] [PMC free article] [PubMed] [Google Scholar]
- Nguyen PV, Woo NH (2003) Regulation of hippocampal synaptic plasticity by cyclic AMP-dependent protein kinases. Prog Neurobiol 71:401–437. 10.1016/j.pneurobio.2003.12.003 [DOI] [PubMed] [Google Scholar]
- Nicholls DG, Sihra TS (1986) Synaptosomes possess an exocytotic pool of glutamate. Nature 321:772–773. 10.1038/321772a0 [DOI] [PubMed] [Google Scholar]
- Nisticò R, Florenzano F, Mango D, Ferraina C, Grilli M, Di Prisco S, Nobili A, Saccucci S, D'Amelio M, Morbin M, Marchi M, Mercuri NB, Davis RJ, Pittaluga A, Feligioni M (2015) Presynaptic c-Jun N-terminal kinase 2 regulates NMDA receptor-dependent glutamate release. Sci Rep 5:9035. 10.1038/srep09035 [DOI] [PMC free article] [PubMed] [Google Scholar]
- Oddo S, Caccamo A, Shepherd JD, Murphy MP, Golde TE, Kayed R, Metherate R, Mattson MP, Akbari Y, LaFerla FM (2003) Triple-transgenic model of Alzheimer's disease with plaques and tangles: intracellular Abeta and synaptic dysfunction. Neuron 39:409–421. 10.1016/S0896-6273(03)00434-3 [DOI] [PubMed] [Google Scholar]
- O'Dell TJ, Kandel ER, Grant SG (1991) Long-term potentiation in the hippocampus is blocked by tyrosine kinase inhibitors. Nature 353:558–560. 10.1038/353558a0 [DOI] [PubMed] [Google Scholar]
- Park M, Penick EC, Edwards JG, Kauer JA, Ehlers MD (2004) Recycling endosomes supply AMPA receptors for LTP. Science 305:1972–1975. 10.1126/science.1102026 [DOI] [PubMed] [Google Scholar]
- Park M, Salgado JM, Ostroff L, Helton TD, Robinson CG, Harris KM, Ehlers MD (2006) Plasticity-induced growth of dendritic spines by exocytic trafficking from recycling endosomes. Neuron 52:817–830. 10.1016/j.neuron.2006.09.040 [DOI] [PMC free article] [PubMed] [Google Scholar]
- Penzes P, Cahill ME, Jones KA, VanLeeuwen JE, Woolfrey KM (2011) Dendritic spine pathology in neuropsychiatric disorders. Nat Neurosci 14:285–293. 10.1038/nn.2741 [DOI] [PMC free article] [PubMed] [Google Scholar]
- Postupna NO, Keene CD, Latimer C, Sherfield EE, Van Gelder RD, Ojemann JG, Montine TJ, Darvas M (2014) Flow cytometry analysis of synaptosomes from post-mortem human brain reveals changes specific to Lewy body and Alzheimer's disease. Lab Invest 94:1161–1172. 10.1038/labinvest.2014.103 [DOI] [PMC free article] [PubMed] [Google Scholar]
- Prickaerts J, van Staveren WC, Sik A, Markerink-van Ittersum M, Niewöhner U, van der Staay FJ, Blokland A, de Vente J (2002) Effects of two selective phosphodiesterase type 5 inhibitors, sildenafil and vardenafil, on object recognition memory and hippocampal cyclic GMP levels in the rat. Neuroscience 113:351–361. 10.1016/S0306-4522(02)00199-9 [DOI] [PubMed] [Google Scholar]
- Prieto GA, Snigdha S, Baglietto-Vargas D, Smith ED, Berchtold NC, Tong L, Ajami D, LaFerla FM, Rebek J Jr, Cotman CW (2015) Synapse-specific IL-1 receptor subunit reconfiguration augments vulnerability to IL-1β in the aged hippocampus. Proc Natl Acad Sci U S A 112:E5078–E5087. 10.1073/pnas.1514486112 [DOI] [PMC free article] [PubMed] [Google Scholar]
- Puzzo D, Staniszewski A, Deng SX, Privitera L, Leznik E, Liu S, Zhang H, Feng Y, Palmeri A, Landry DW, Arancio O (2009) Phosphodiesterase 5 inhibition improves synaptic function, memory, and amyloid-beta load in an Alzheimer's disease mouse model. J Neurosci 29:8075–8086. 10.1523/JNEUROSCI.0864-09.2009 [DOI] [PMC free article] [PubMed] [Google Scholar]
- Rao A, Steward O (1991) Evidence that protein constituents of postsynaptic membrane specializations are locally synthesized: analysis of proteins synthesized within synaptosomes. J Neurosci 11:2881–2895. [DOI] [PMC free article] [PubMed] [Google Scholar]
- Reneerkens OA, Rutten K, Akkerman S, Blokland A, Shaffer CL, Menniti FS, Steinbusch HW, Prickaerts J (2012) Phosphodiesterase type 5 (PDE5) inhibition improves object recognition memory: indications for central and peripheral mechanisms. Neurobiol Learn Mem 97:370–379. 10.1016/j.nlm.2012.02.008 [DOI] [PubMed] [Google Scholar]
- Reneerkens OA, Sambeth A, Ramaekers JG, Steinbusch HW, Blokland A, Prickaerts J (2013) The effects of the phosphodiesterase type 5 inhibitor vardenafil on cognitive performance in healthy adults: a behavioral-electroencephalography study. J Psychopharmacol 27:600–608. 10.1177/0269881113477747 [DOI] [PubMed] [Google Scholar]
- Rex CS, Lin CY, Kramár EA, Chen LY, Gall CM, Lynch G (2007) Brain-derived neurotrophic factor promotes long-term potentiation-related cytoskeletal changes in adult hippocampus. J Neurosci 27:3017–3029. 10.1523/JNEUROSCI.4037-06.2007 [DOI] [PMC free article] [PubMed] [Google Scholar]
- Reyes-Irisarri E, Markerink-Van Ittersum M, Mengod G, de Vente J (2007) Expression of the cGMP-specific phosphodiesterases 2 and 9 in normal and Alzheimer's disease human brains. Eur J Neurosci 25:3332–3338. 10.1111/j.1460-9568.2007.05589.x [DOI] [PubMed] [Google Scholar]
- Richmond SA, Irving AJ, Molnár E, McIlhinney RA, Michelangeli F, Henley JM, Collingridge GL (1996) Localization of the glutamate receptor subunit GluR1 on the surface of living and within cultured hippocampal neurons. Neuroscience 75:69–82. 10.1016/0306-4522(96)00217-5 [DOI] [PubMed] [Google Scholar]
- Roman F, Staubli U, Lynch G (1987) Evidence for synaptic potentiation in a cortical network during learning. Brain Res 418:221–226. 10.1016/0006-8993(87)90089-8 [DOI] [PubMed] [Google Scholar]
- Rutten K, Basile JL, Prickaerts J, Blokland A, Vivian JA (2008) Selective PDE inhibitors rolipram and sildenafil improve object retrieval performance in adult cynomolgus macaques. Psychopharmacology (Berl) 196:643–648. 10.1007/s00213-007-0999-1 [DOI] [PMC free article] [PubMed] [Google Scholar]
- Saganich MJ, Schroeder BE, Galvan V, Bredesen DE, Koo EH, Heinemann SF (2006) Deficits in synaptic transmission and learning in amyloid precursor protein (APP) transgenic mice require C-terminal cleavage of APP. J Neurosci 26:13428–13436. 10.1523/JNEUROSCI.4180-06.2006 [DOI] [PMC free article] [PubMed] [Google Scholar]
- Sandoval ME, Horch P, Cotman CW (1978) Evaluation of glutamate as a hippocampal neurotransmitter: glutamate uptake and release from synaptosomes. Brain Res 142:285–299. 10.1016/0006-8993(78)90636-4 [DOI] [PubMed] [Google Scholar]
- Selkoe DJ. (2002) Alzheimer's disease is a synaptic failure. Science 298:789–791. 10.1126/science.1074069 [DOI] [PubMed] [Google Scholar]
- Shi SH, Hayashi Y, Petralia RS, Zaman SH, Wenthold RJ, Svoboda K, Malinow R (1999) Rapid spine delivery and redistribution of AMPA receptors after synaptic NMDA receptor activation. Science 284:1811–1816. 10.1126/science.284.5421.1811 [DOI] [PubMed] [Google Scholar]
- Silva AJ, Stevens CF, Tonegawa S, Wang Y (1992) Deficient hippocampal long-term potentiation in alpha-calcium-calmodulin kinase II mutant mice. Science 257:201–206. 10.1126/science.1378648 [DOI] [PubMed] [Google Scholar]
- Sokolow S, Luu SH, Nandy K, Miller CA, Vinters HV, Poon WW, Gylys KH (2012) Preferential accumulation of amyloid-beta in presynaptic glutamatergic terminals (VGluT1 and VGluT2) in Alzheimer's disease cortex. Neurobiol Dis 45:381–387. 10.1016/j.nbd.2011.08.027 [DOI] [PMC free article] [PubMed] [Google Scholar]
- Talbot K, Wang HY, Kazi H, Han LY, Bakshi KP, Stucky A, Fuino RL, Kawaguchi KR, Samoyedny AJ, Wilson RS, Arvanitakis Z, Schneider JA, Wolf BA, Bennett DA, Trojanowski JQ, Arnold SE (2012) Demonstrated brain insulin resistance in Alzheimer's disease patients is associated with IGF-1 resistance, IRS-1 dysregulation, and cognitive decline. J Clin Invest 122:1316–1338. 10.1172/JCI59903 [DOI] [PMC free article] [PubMed] [Google Scholar]
- Teich AF, Sakurai M, Patel M, Holman C, Saeed F, Fiorito J, Arancio O (2016) PDE5 exists in human neurons and is a viable therapeutic target for neurologic disease. J Alzheimers Dis 52:295–302. 10.3233/JAD-151104 [DOI] [PMC free article] [PubMed] [Google Scholar]
- Thomas GM, Huganir RL (2004) MAPK cascade signalling and synaptic plasticity. Nat Rev Neurosci 5:173–183. 10.1038/nrn1346 [DOI] [PubMed] [Google Scholar]
- Ugarte A, Gil-Bea F, García-Barroso C, Cedazo-Minguez Á, Ramírez MJ, Franco R, García-Osta A, Oyarzabal J, Cuadrado-Tejedor M (2015) Decreased levels of guanosine 3′, 5′-monophosphate (cGMP) in cerebrospinal fluid (CSF) are associated with cognitive decline and amyloid pathology in Alzheimer's disease. Neuropathol Appl Neurobiol 41:471–482. 10.1111/nan.12203 [DOI] [PubMed] [Google Scholar]
- Whitlock JR, Heynen AJ, Shuler MG, Bear MF (2006) Learning induces long-term potentiation in the hippocampus. Science 313:1093–1097. 10.1126/science.1128134 [DOI] [PubMed] [Google Scholar]
- Wilhelm BG, Mandad S, Truckenbrodt S, Kröhnert K, Schäfer C, Rammner B, Koo SJ, Claßen GA, Krauss M, Haucke V, Urlaub H, Rizzoli SO (2014) Composition of isolated synaptic boutons reveals the amounts of vesicle trafficking proteins. Science 344:1023–1028. 10.1126/science.1252884 [DOI] [PubMed] [Google Scholar]
- Wolf ME, Kapatos G (1989a) Flow cytometric analysis and isolation of permeabilized dopamine nerve terminals from rat striatum. J Neurosci 9:106–114. [DOI] [PMC free article] [PubMed] [Google Scholar]
- Wolf ME, Kapatos G (1989b) Flow cytometric analysis of rat striatal nerve terminals. J Neurosci 9:94–105. [DOI] [PMC free article] [PubMed] [Google Scholar]
- Yankner BA, Lu T, Loerch P (2008) The aging brain. Annu Rev Pathol 3:41–66. 10.1146/annurev.pathmechdis.2.010506.092044 [DOI] [PubMed] [Google Scholar]
- Yoshiyama Y, Higuchi M, Zhang B, Huang SM, Iwata N, Saido TC, Maeda J, Suhara T, Trojanowski JQ, Lee VM (2007) Synapse loss and microglial activation precede tangles in a P301S tauopathy mouse model. Neuron 53:337–351. 10.1016/j.neuron.2007.01.010 [DOI] [PubMed] [Google Scholar]
- Zhang Y, Cudmore RH, Lin DT, Linden DJ, Huganir RL (2015) Visualization of NMDA receptor-dependent AMPA receptor synaptic plasticity in vivo. Nat Neurosci 18:402–407. 10.1038/nn.3936 [DOI] [PMC free article] [PubMed] [Google Scholar]