

Abstract
The mammalian inner ear (IE) subserves auditory and vestibular sensations via highly specialized cells and proteins. Sensory receptor hair cells (HCs) are necessary for transducing mechanical inputs and stimulating sensory neurons by using a host of known and as yet unknown protein machinery. To understand the protein composition of these unique postmitotic cells, in which irreversible protein degradation or damage can lead to impaired hearing and balance, we analyzed IE samples by tandem mass spectrometry to generate an unbiased, shotgun-proteomics view of protein identities and abundances. By using Pou4f3/eGFP-transgenic mice in which HCs express GFP driven by Pou4f3, we FACS purified a population of HCs to analyze and compare the HC proteome with other IE subproteomes from sensory epithelia and whole IE. We show that the mammalian HC proteome comprises hundreds of uniquely or highly expressed proteins. Our global proteomic analysis of purified HCs extends the existing HC transcriptome, revealing previously undetected gene products and isoform-specific protein expression. Comparison of our proteomic data with mouse and human databases of genetic auditory/vestibular impairments confirms the critical role of the HC proteome for normal IE function, providing a cell-specific pool of candidates for novel, important HC genes. Several proteins identified exclusively in HCs by proteomics and verified by immunohistochemistry map to human genetic deafness loci, potentially representing new deafness genes.
SIGNIFICANCE STATEMENT Hearing and balance rely on specialized sensory hair cells (HCs) in the inner ear (IE) to convey information about sound, acceleration, and orientation to the brain. Genetically and environmentally induced perturbations to HC proteins can result in deafness and severe imbalance. We used transgenic mice with GFP-expressing HCs, coupled with FACS sorting and tandem mass spectrometry, to define the most complete HC and IE proteome to date. We show that hundreds of proteins are uniquely identified or enriched in HCs, extending previous gene expression analyses to reveal novel HC proteins and isoforms. Importantly, deafness-linked proteins were significantly enriched in HCs, suggesting that this in-depth proteomic analysis of IE sensory cells may hold potential for deafness gene discovery.
Keywords: cochlea, deafness, hair cells, inner ear, mass spectrometry, proteome
Introduction
Sensory receptor hair cell (HC) proteins regulate a wide range of specialized sensory, amplification, and synaptic functions in the inner ear (IE) (Housley et al., 2006; Kazmierczak and Mu, 2012; Wichmann and Moser, 2015). Despite the increasingly rapid rate of deafness gene discovery, approximately one-third of human deafness loci remain uncharacterized and it is estimated that hundreds of human deafness genes remain unidentified (Vona et al., 2015). Recent transcriptome analysis of purified specific IE cell types and single cells have provided important new insights into HC developmental processes and critical gene expression for HC versus supporting cell fates (Elkan-Miller et al., 2011; Burns et al., 2015; Cai et al., 2015; Scheffer et al., 2015). Although mRNA provides a sensitive measure of gene expression, proteomic analysis represents gene product maturation and a measure of functioning pathways. Moreover, mRNA and protein levels do not strictly correlate, splice variants may not be detected, posttranslational processing alters many proteins, and mRNA for highly stable proteins may be missed (Sharma et al., 2015; Liu et al., 2016). Therefore, we set out to establish an initial draft of the mammalian IE HC proteome. To achieve this goal, we conducted in-depth analysis of protein expression of multiple mouse IE cell extracts using high-resolution tandem mass spectrometry (MS)-based shotgun proteomics. We hypothesize that protein expression patterns are discretely regulated in specific highly specialized IE cells that play distinct roles for auditory and balance senses.
To achieve a detailed and confident proteomic characterization, we examined a series of IE extracts with progressive enrichment for HCs: whole IEs, sensory epithelia (SE), and HCs that were FACS purified from dissociated SE because of the HC-specific expression of GFP (GFP+) of our Pou4f3/eGFP reporter mice (Masuda et al., 2011). To confirm protein expression specifically in HCs, we also analyzed FACS-purified GFP− cells (presumed supporting cells) from the SE by MS. Through comparisons between these proteomic datasets, we defined hundreds of proteins and associated genes highly enriched in sensory HCs. By further comparisons with existing HC transcriptome data and with annotations for genes associated with deficits in auditory and vestibular function, we also identify novel HC proteins and isoforms and candidate genes for currently uncharacterized human deafness.
Materials and Methods
Animals.
All experiments performed were approved by the animal care committees of the Veterans Administration San Diego Healthcare System, University of California–San Diego, and Northwestern University in accordance with National Institutes of Health and the Society for Neuroscience guidelines for the care and ethical use of animals for scientific research. In all studies, mice of either sex were used. Postnatal day 4 (P4) to P7 Pou4f3/eGFP-transgenic mice were used for all proteomic studies. In these mice, 8.5 kb of DNA 5′ to the Pou4f3 start codon drives the selective expression of eGFP in all neonatal IE HCs (Masuda et al., 2011). Additional validation of targets via immunolabeling of IE tissue was performed using P4–P8 Pou4f3/eGFP mice or wild-type FVB mice. Validation of HC gene expression by qRT-PCR was performed using P3–P5 Pou4f3/eGFP mice. Cells from the IE of three C57BL/6 wild-type mice (RRID:IMSR_JAX:000664) were used to set the FACS collection fluorescence and cell size collection gates.
Sample isolation.
For analysis of the whole IE, IEs were dissected from temporal bones and the bony/cartilaginous capsule removed by microdissection. For analysis of SE, cochlear and vestibular sensory organs (organ of Corti, utricular and saccular maculae, and semicircular canal ampullae) were extracted into Leibovitz's buffer (Invitrogen, #2183–027) in 60 mm culture dishes for microdissection. Otoconial membranes were removed from the maculae. The dissected cochlear and vestibular preparations were incubated separately with 0.5 mg/ml thermolysin (Sigma-Aldrich, #T7902) in Leibovitz's buffer for 25–30 min in a 37°C/5% CO2 humidified tissue culture incubator to dissociate the extracellular matrices. The thermolysin was then aspirated, extracellular matrix tissue removed, the samples rinsed, and the cochlear epithelia (including the organ of Corti, the spiral limbus, and basilar membrane) and vestibular epithelia (utricular and saccular maculae and cristae of the semicircular canals) were pooled. For analysis of purified HCs and supporting cells, SEs isolated as above were first subjected to enzymatic dissociation. The cochlear and vestibular SEs were incubated separately with FACSMax cell dissociation solution (Genlantis, #T200100). The cell mixture was triturated with a pipette and further dissociated into single cells mechanically by passing through a 23 G blunt-ended needle. The dissociation was monitored by fluorescence microscopy. Dissociated cells were passed through a 40 μm cell strainer (BD Biosciences) to eliminate clumps before sorting and collected into a FACS tube on ice containing Leibovitz's buffer with 5% fetal calf serum. Cochlear and vestibular GFP+ and GFP− cells were sorted with a BD Biosciences FACSAria II cell sorter using a 100 μm nozzle at 488 nm and only cells of high and very low fluorescence, respectively, and of large scatter size (indicative of cell integrity) were collected into 0.01 m PBS (Invitrogen) with protease inhibitors (cOmplete protease inhibitor cocktail tablet, Roche) and lyophilized. Lyophilized samples of 199,894 cochlear and vestibular GFP+ HCs (ratio of 0.38:0.62) or 313,808 cochlear and vestibular GFP− cells (ratio of 0.74:0.26) were pooled and reconstituted into 500 μl of RIPA lysis buffer (150 mm NaCl, 5 mm EDTA, pH 8.0, 50 mm Tris, pH 8.0, 1% NP-40, 0.5% sodium deoxycholate, 0.1% SDS) for liquid chromatography tandem MS (LC-MS/MS).
Sample preparation for LC-MS/MS analysis.
The IE, SE, and HC samples were dissected and, when present, the temporal bones and the bony/cartilaginous capsule were pulverized with microscale Dounce homogenizers and solubilized for 30 min with ice-cold RIPA buffer (components described above) with protease inhibitor cocktail tablet (cOmplete, Roche). The entire extract was then subjected to methanol and chloroform precipitation, the precipitated protein pellets were solubilized in 100 μl of 8 m urea for 30 min, 100 μl of 0.2% ProteaseMAX (Promega) was added, and the mixture was incubated for an additional 2 h. The protein extracts were reduced and alkylated as described previously (Chen et al., 2008), followed by the addition of 300 μl of 50 mm ammonium bicarbonate, 5 μl of 1% ProteaseMAX, and 20 μg of sequence-grade trypsin (Promega). Samples were digested overnight in a 37°C thermomixer (Eppendorf). Up to 100 μg of protein was loaded for analysis with an Orbitrap Velos or Elite MS and up to 3 μg for analysis with an Orbitrap Fusion MS.
IE samples were analyzed by LC-MS/MS and resulting spectral files were searched against a protein database, as described below, as single or pooled MS analysis. For IE samples, three biological replicates (each consisting of both ears from one mouse) were each analyzed independently by LC-MS/MS and the spectral files from all replicates were pooled for a single database search. For SE samples, pooled cochlear epithelia (organ of Corti) were analyzed independently from pooled vestibular epithelia (utricle, saccule, and ampullae, all extracted from the same 25 mice). Cochlear and vestibular SE spectral files were searched both independently and also pooled for one single database search. Two additional replicates of cochlear SE (organ of Corti) were each analyzed and searched independently, consisting of pooled samples from 35 and 70 mice. For HC samples, GFP+ HCs were sorted from all SE types (organ of Corti, utricle, saccule, and ampullae) from a total of 132 mice, pooled into two replicates that were each analyzed independently, and the spectral files from both replicates were pooled for a single database search. GFP− supporting cell samples from a total of 25 mice were collected and analyzed similarly to GFP+ cells in three pooled replicates.
LC-MS/MS.
For multidimensional chromatography (Orbitrap Velos or Orbitrap Elite MS) the protein digest was bomb-pressure loaded onto a Kasil frit 250 μm inner diameter capillary packed with 2.5 cm of 10 μm Jupiter C18 reversed-phase resin (Phenomenex), followed by an additional 2.5 cm of 5 μm Partisphere strong cation exchanger (Whatman) (Link et al., 1999; Washburn et al., 2001). The column was washed with buffer A containing 95% water, 5% acetonitrile (ACN), and 0.1% formic acid (FA). After washing, a 100 μm inner diameter capillary with a 5 μm pulled tip packed with 15 cm of 3 μm Jupiter C18 reversed-phase resin (Phenomenex) was attached to the filter union and the entire split-column (desalting column–union–analytical column) was placed in line with an Agilent 1200 quaternary HPLC and analyzed using a modified 11-step separation described previously (Savas et al., 2012). The buffer solutions used were as follows: 5% ACN/0.1% FA (buffer A), 80% ACN/0.1% FA (buffer B), and 500 mm ammonium acetate/5% ACN/0.1% FA (buffer C). Step 1 consisted of a 90 min gradient from 0–100% buffer B. Steps 2–11 had a similar profile with the following changes: 5 min in 100% buffer A, 3 min in X% buffer C, a 10 min gradient from 0–15% buffer B, and a 108 min gradient from 15–100% buffer B. The 3 min buffer C percentages (X) were 10%, 20%, 30%, 40%, 50%, 60%, 70%, 80%, 90%, and 100%, respectively, for the 11-step analysis. As peptides eluted from the microcapillary column, they were electrosprayed directly into an LTQ Orbitrap Velos or Elite MS (Thermo Finnigan) with the application of a distal 2.4 kV spray voltage. A cycle of one full-scan mass spectrum (400–1800 m/z) at a resolution of 60,000 followed by 15 data-dependent MS2 spectra at a 35% normalized collision energy was repeated continuously throughout each step of the multidimensional separation. Maximum ion accumulation times were set to 500 ms for survey MS scans and to 100 ms for MS2 scans. Charge state rejection was set to omit singly charged ion species and ions for which a charge state could not be determined for MS2. Minimal signal for fragmentation was set to 1000. Dynamic exclusion was enabled with a repeat count: 1, duration: 20.00 s, list size: 300, exclusion duration 30.00 s, exclusion mass with high/low: 1.5 m/z. Application of MS scan functions and HPLC solvent gradients were controlled by the Xcalibur data system.
For Orbitrap Fusion Tribrid MS analysis, the tryptic peptides were purified with Pierce C18 spin columns and fractionated with increasing ACN concentrations (15%, 20%, 30%, 40%, 60%, and 70%). Three micrograms of each fraction was auto-sampler loaded with a Thermo Fisher EASY nLC 1000 UPLC pump onto a vented Acclaim Pepmap 100, 75 μm × 2 cm, nanoViper trap column coupled to a nanoViper analytical column (Thermo Fisher 164570, 3 μm, 100 Å, C18, 0.075 mm, 500 mm) with stainless steel emitter tip assembled on the Nanospray Flex Ion Source with a spray voltage of 2000 V. Buffer A contained 94.785% H2O with 5% ACN and 0.125% FA, and buffer B contained 99.875% ACN with 0.125% FA. The chromatographic run was for 4 h in total with the following profile: 0–7% for 7 min, 10% for 6 min, 25% for 160 min, 33% for 40 min, 50% for 7, 95% for 5 min, and 95% again for 15 min, respectively. Additional MS parameters include: ion transfer tube temp = 300°C, Easy-IC internal mass calibration, default charge state = 2 and cycle time = 3 s. Detector type set to Orbitrap, with 60 K resolution, with wide quad isolation, mass range = normal, scan range = 300–1500 m/z, max injection time = 50 ms, AGC target = 200,000, microscans = 1, S-lens RF level = 60, without source fragmentation, and datatype = positive and centroid. MIPS was set as on, included charge states = 2–6 (reject unassigned). Dynamic exclusion enabled with n = 1 for 30 and 45 s exclusion duration at 10 ppm for high and low. Precursor selection decision = most intense, top 20, isolation window = 1.6, scan range = auto normal, first mass = 110, collision energy 30%, CID, Detector type = ion trap, Orbitrap resolution = 30K, IT scan rate = rapid, max injection time = 75 ms, AGC target = 10,000, Q = 0.25, inject ions for all available parallelizable time.
Tandem mass spectra analysis.
Peptide spectral files from pooled samples or from biological replicates were combined for database searching. Spectrum raw files were extracted into MS1 and MS2 files using in-house program RawXtractor or RawConverter (http://fields.scripps.edu/downloads.php) (He et al., 2015) and the tandem mass spectra were searched against UniProt mouse protein database (downloaded on 03–25-2014; UniProt Consortium, 2015) and matched to sequences using the ProLuCID/SEQUEST algorithm (ProLuCID version 3.1; Eng et al., 1994; Xu et al., 2006) with 50 ppm peptide mass tolerance for precursor ions and 600 ppm for fragment ions. An eGFP sequence (below) was added manually to the mouse protein database to identify eGFP from IE samples of our Pou4f3/eGFP mice: MVSKGEELFTGVVPILVELDGDVNGHKFSVSGEGEGDATYGKLTLKFICTTGKLPVPWPTLVTTLTYGVQCFSRYPDHMKQHDFFKSAMPEGYVQERTIFFKDDGNYKTRAEVKFEGDTLVNRIELKGIDFKEDGNILGHKLEYNYNSHNVYIMADKQKNGIKVNFKIRHNIEDGSVQLADHYQQNTPIGDGPVLLPDNHYLSTQSALSKDPNEKRDHMVLLEFVTAAGITLGMDELYK.
The search space included all fully and half-tryptic peptide candidates that fell within the mass tolerance window with no miscleavage constraint, assembled, and filtered with DTASelect2 (version 2.1.3) (Tabb et al., 2002; Cociorva et al., 2007) through Integrated Proteomics Pipeline (IP2 version 3, Integrated Proteomics Applications, http://www.integratedproteomics.com). To estimate peptide probabilities and false-discovery rates (FDR) accurately, we used a target/decoy database containing the reversed sequences of all the proteins appended to the target database (Peng et al., 2003). Each protein identified was required to have a minimum of one peptide of minimal length of six amino acid residues; however, this peptide had to be an excellent match with a FDR <0.001 and at least one excellent peptide match. After the peptide/spectrum matches were filtered, we estimated that the protein FDRs were ≤1% for each sample analysis. Resulting protein lists include subset proteins to allow for consideration of all possible protein forms implicated by a given peptide identified from the complex IE protein mixtures.
The complete MS search results, search parameters, and MS raw files have been submitted to MASSIVE (accession number: MSV000079756) and ProteomeXchange (accession number: PXD004210). Upon acceptance, the data (project title: IE hair cell proteome) can be accessed by FTD download (URL: ftp://MSV000079756@massive.ucsd.edu).
Protein abundances and enrichment.
Each protein identified with the IP2 pipeline was associated with several different measures of abundance used in our analyses, including: peptide counts, spectral counts, and normalized spectral abundance factor (NSAF) (Zybailov et al., 2006), which takes into account protein length and number of proteins identified in the experiment. When comparing abundances of a given protein across samples, we used NSAF rank rather than abundance to minimize the effects of differences in sample sizes and stochastic differences between MS analyses. Unless otherwise stated, all following analyses were performed, and all plots generated, with custom scripts in MATLAB (Release 2015b; The MathWorks). Venn diagrams were plotted using the venn script (MATLAB Central File Exchange, retrieved 08-06-15). To assess whether a protein was significantly enriched or depleted in a given sample, we devised a two-part algorithm using rank abundances and a criterion defined by a set of “control” enrichment patterns. Of the 3351 proteins identified in common across IE, SE, and HC samples, each was assigned to an enrichment profile based on rank abundance: HC-enriched (IE < SE < HC); SE-enriched (SE > average of IE and HC); HC-depleted (IE > SE > HC); or SE-depleted (SE < average of IE and HC). The overall change in rank (absolute difference maximum − minimum) across proteins varied widely (1–2920). Whereas an HC-enriched protein with a large change in rank between IE and HC samples likely represents a biologically meaningful protein enrichment in HCs, a SE-depleted protein with a moderate or low overall change in rank represents a less interpretable profile that may result from technical differences between samples. We thus defined a conservative criterion for significant enrichment/depletion based on the distribution of overall changes in rank observed in the SE-depleted “control” group: the 95th percentile value, equating to a change in rank abundance of at least 1488.
Schematizing spectra and protein domains.
Exemplar tandem mass spectra were extracted from raw files using Xcalibur (version 3.0; Thermo Fisher Scientific) and b- and y-ion peaks were identified with the IP2 spectrum viewer using average mass mode. To illustrate the position of the identified peptides within the linearized protein sequences, protein domain schematics were created based on alignments made with the UniProt alignment tool (http://www.uniprot.org/align) (UniProt Consortium, 2015) and on domains identified with Pfam (http://pfam.xfam.org) (Finn et al., 2014).
Mapping proteins to genes.
To facilitate comparisons of our proteomic data with existing transcriptomes, transgenic animal phenotype databases, and human deafness genes, proteins were first mapped to Mouse Genome Informatics identifiers (MGI IDs). Using the batch query tool on UniProt (http://www.uniprot.org/uploadlists, accessed 08-06-15), 9000 of 9071 UniProt accession numbers (99.2%) were converted to 6394 MGI IDs. One additional protein was successfully matched to an MGI ID using the MGI batch query tool (http://www.informatics.jax.org/batch, accessed 08-06-15). In constructing a gene-centered Venn diagram, we assigned a given gene to a category if all of its associated proteins identified by MS also fell within the same category (e.g., a HC-only gene represents one or more gene products that were only identified in the HC sample). Gene names displayed in tables were derived from the associated UniProt entry information. For UniProt entries lacking gene names, we instead used gene names from the appropriate MGI entry information.
Comparison with RNA-seq data.
Transcriptomic data from Scheffer et al. (2015) were selected for protein–mRNA comparison because this study used a similar approach: FACS sorted HCs (GFP+) and presumed supporting cells (GFP−) from cochlear and utricular SE from Pou4f3/eGFP mice. Processed data, as described in Scheffer et al. (2015), were downloaded as a single database from the Shared Harvard Inner-Ear Laboratory Database (Shen et al., 2015). Importantly, we considered only data from P4 and P7 mice to mirror the age range used in the current study. Using the minimum read count criterion (>15) established in Scheffer et al. (2015) and ignoring entries with no reads at either P4 or P7, we ultimately used 18,101 of the total 20,207 genes for our analyses. As in Scheffer et al. (2015), we calculated the fold change in read counts for each gene as GFP+/GFP− and used cutoffs of >2 and <0.5 to define “HC-enriched” and “HC-depleted” genes, respectively.
We then used MGI IDs to identify genes across proteomic and transcriptomic datasets. For plotting proteomic-derived genes against corresponding transcripts, genes were matched by MGI ID, ordered by mRNA rank abundance, binned, counted, and expressed as a percentage of the total genes identified through the proteomic dataset. For plotting cumulative count of gene products versus transcript abundance across GFP+ samples, we defined the total abundance of a given transcript as summed read counts across both P4 and P7 and both cochlear and utricular GFP+ datasets. Fourteen transcripts appeared multiple times in the dataset and were excluded from analysis for simplicity. For plotting cumulative count of gene products versus protein abundance, we used protein NSAF values and treated each protein sequence as a separate entity to allow for differing abundances across isoforms or alternative sequences.
Relating IE proteins to mouse auditory/vestibular impairment.
We compiled auditory and vestibular phenotypes identified across various transgenic mouse lines using Mammalian Phenotype (MP) ontology terms within the Mouse Genome Database (MGD) (http://www.informatics.jax.org, accessed 11–30-15) (Eppig et al., 2015), comprising information from large consortium studies as well as primary literature. From this hierarchically organized database, we first extracted data (transgenic mouse lines and MP terms) from the following higher-level categories: “abnormal ear physiology,” “abnormal ear morphology,” “abnormal pinna reflex,” “abnormal postural reflex,” “abnormal startle reflex,” “abnormal vestibulocollic reflex,” “abnormal vestibuloocular reflex,” and “abnormal eye physiology.” Then, we filtered the resulting MP terms to those representing either negative outcomes on a particular assay (e.g., “decreased startle reflex,” “increased threshold for auditory brainstem response”) or negative changes in anatomical loci (e.g., “decreased cochlear hair cell number”). These MP terms were each assigned to one of the following groups of impaired phenotypes: (1) behavior, (2) IE physiology, (3) IE morphology, (4) impaired hearing or increased susceptibility to hearing loss, and (5) eye physiology, used as a negative control group to test the sensitivity of our analyses (e.g., comprises assays analogous to hearing assays, such as electroretinograms instead of auditory brainstem response recordings).
The affected genes (and corresponding MGI IDs) of the transgenic mouse lines associated with the phenotypes in these five groups were filtered by genes identified by our proteomic approach. The number of genes represented in each phenotype group ranged from 232 to 372. Only mouse lines with one gene manipulation (e.g., single gene knock-out or point mutation) were included to simplify interpretation. To predict potential new causative IE genes underlying auditory/vestibular impairment in mice, we filtered the genes in the “behavior” phenotype group to those that did not additionally appear in the “physiology,” “morphology,” or “hearing impairment” groups (i.e., filtered the gene list to those without well characterized roles in the IE or hearing/balance).
Relating IE proteins to human deafness.
Data from the Hereditary Hearing Loss home page (http://hereditaryhearingloss.org, accessed 10-07-15) were used to generate a list of known human nonsyndromic and syndromic deafness genes and a list of human nonsyndromic deafness loci without identified causative genes. The latter list was further verified, and updated where necessary, with data compiled by OMIM (http://omim.org, accessed 10-08-15) to ensure current chromosomal locations for deafness loci. Deafness genes were mapped to mouse orthologs and MGI IDs using the MGI batch query tool (accessed 10-08-15).
To predict potential novel deafness genes, we mapped genes identified only in the HC sample to human deafness loci as follows. MGI IDs were matched to human genes and human chromosomal locations using the GRCm38.p4 mouse and GRCh38.p3 human assemblies within Ensembl BioMart (Ensembl Release 82) (Kinsella et al., 2011; Flicek et al., 2014). The matching human chromosome locations were mapped to cytobands using annotations from UCSC Genome Bioinformatics (GRCh38 assembly, http://genome.ucsc.edu, accessed 10-08-15) (Rosenbloom et al., 2015). Then, only for mouse genes with high orthology confidence (orthology = 1, BioMart), corresponding human cytobands were filtered to those matching deafness loci with unknown causative genes. All resulting HC-only genes residing in deafness loci remain possible candidates for deafness genes because none could be ruled out based on previous studies (verified using OMIM, 10-08-15).
Statistical analyses.
Statistical overrepresentation tests of gene ontology (GO) terms were performed with PANTHER gene analysis tools (http://pantherdb.org) (Mi et al., 2013) using UniProt accession numbers of canonical isoforms as inputs and Bonferroni correction for multiple testing. When multiple significantly overrepresented GO terms arose from identical sets of proteins, the term associated with the highest fold enrichment value was used. Two-sample Kolmogorov–Smirnov tests were performed in MATLAB (The MathWorks) using kstest2. Fisher's exact tests, and inspection of Pearson's residuals from post hoc χ2 tests were performed using R (version 3.2.2) (R Core Team, 2015).
Immunolabeling of IE cells, sections, and whole mounts.
IEs from Pou4f3/eGFP mice (P4, both sexes) or FVB wild-type mice (P6-P8, both sexes) were dissected from the temporal bone, perfused with 4% paraformaldehyde (PFA) through oval and round windows, and postfixed either overnight at 4°C or for 1–2 h at room temperature. For sections, ears were decalcified with 8% EDTA in PB for 7–14 d at 4°C and then cryopreserved in 30% sucrose in PB overnight, followed by sequential replacement to 100% Tissue-Tek Optimal Cutting Temperature compound (Akura Finetek) and snap-frozen in liquid nitrogen before cryosectioning at 30 μm thickness. For whole-mount preparations, the bony capsule microdissection was performed to extract cochlear SE or vestibular macular epithelia. Whole mounts of vestibular epithelia were gently brushed with an eyelash to remove the gelatinous otoconial layer. Tissues were blocked and permeabilized with either 10% goat serum or 5% bovine serum with 1% Triton X-100. The following primary antibodies were used, followed by species-appropriate Alexa Fluor-conjugated secondary antibodies: anti-Casz1 at 1:100, NovusBio, CO, NBP1–86618 RRID:AB_11011305; anti-Cfap36 at 1:100, Bioss, MA, bs-812404R; anti-Fjx at 1:100, Bioss, MA, bs-8103R; anti-Pak3 at 1:50, Sigma-Aldrich, WH0005063M8 RRID:AB_1842823; anti-Nlgn3 at 1:50, R&D Systems, MAB6088; anti-Myo7a at 1:50, Proteus Biosciences, 25-6790 RRID:AB_10015251; anti-Ctbp2 at 1:100, BD Biosciences, 612044 RRID:AB_399431. Tissues were counterstained with DAPI nucleic acid stain and/or Alexa Fluor-conjugated phalloidin actin stain. Images were captured with confocal laser scanning microscopy (either an Olympus FV1000 or a Leica DMI4000).
To validate selection of GFP+ cells, FACS sorted GFP+ (cochlear and vestibular HCs) and GFP− cells (supporting cells) were collected into six-well cell culture plates and incubated at 37°C in a humidified 5% CO2 chamber overnight to allow the cells to adhere. The cells were then washed with PBS, fixed in 4% PFA, permeabilized, and blocked with 10% fetal bovine serum/5% Triton X-100. Anti-Myo7a (Proteus Biosciences, 25-6790 RRID:AB_10015251) was applied at 1:400, detected with Alexa Fluor 594 goat anti-rabbit IgG at 1:100 with DAPI DNA counterstain. The immunolabeled cells were imaged with a FSX100 fluorescence microscope (Olympus).
qRT-PCR.
Total RNA was extracted from FACS sorted GFP+ HCs and GFP− supporting cells using TRIzol and RNeasy Kit (Qiagen). RNA was reverse transcribed using Superscript III First-Strand cDNA synthesis kit (Invitrogen). Real-time PCR was performed with StepOnePlus Real-Time PCR system (Applied Biosystems) using Power SYBR Green Master Mix (Applied Biosystems). A total of 500 ng of cDNA was used for each reaction. Cycling parameters were as follows: 95°C for 10 min; 40 cycles of 95°C for 15 s, and 60°C for 60 s. Triplicates of each primer were performed with a no-template control. Three biological replicates were used for each target. Primers were sourced from Qiagen (QuanTitect primer assays) and were reconstituted to 10× concentration: Pou4f3 (QT00278957), Erich3 (“BC007180”) (QT00154028), Rsph10b (QT00319914), Wipf3 (QT01780695), 4930407I10Rik (QT00263487), Acad12 (QT00304948), Krt81 (QT00306656), 5430421N21Rik (QT02434544), Hes1 (QT00313537), and Coch (QT00116774). Normalized gene expression levels in GFP+ cells relative to GFP− cells are expressed as log10 of the mean relative quantification (RQ) across biological replicates.
Results
Defining the HC proteome with MS analysis of FACS-purified HCs
To investigate the HC proteome, and to globally investigate auditory/vestibular SE and IE proteomes, we used transgenic HC reporter mice that express eGFP under the control of the Pou4f3-8.5 promoter (Pou4f3/eGFP) (Masuda et al., 2011). In these mice, GFP is robustly and selectively expressed in HCs of auditory and vestibular SE throughout the first three postnatal weeks, as schematized in Figure 1A. We isolated GFP+ HCs by microdissection of SE followed by cell dissociation and FACS analysis (Fig. 1B–D). GFP+ cells, but not GFP− cells, express the HC protein myosin-VIIa (Fig. 1D), consistent with selective eGFP expression in HCs among IE cell types in this transgenic line. FACS gating parameters were chosen to ensure capture of the brightest GFP+ cells from Pou4f3/eGFP mice and no cells from wild-type mice (Figure 1E,F). We performed MS-based shotgun proteomic analysis across 3 IE sample types (cochlear and vestibular components) at ∼1 week of age: whole IEs (6 ears from 3 mice), microdissected SE (50 ears from 25 mice), and HCs (199,894 HCs from 132 mice) that were FACS sorted from SE to provide a purified HC population for in-depth protein discovery (Fig. 2A–C).
Figure 1.
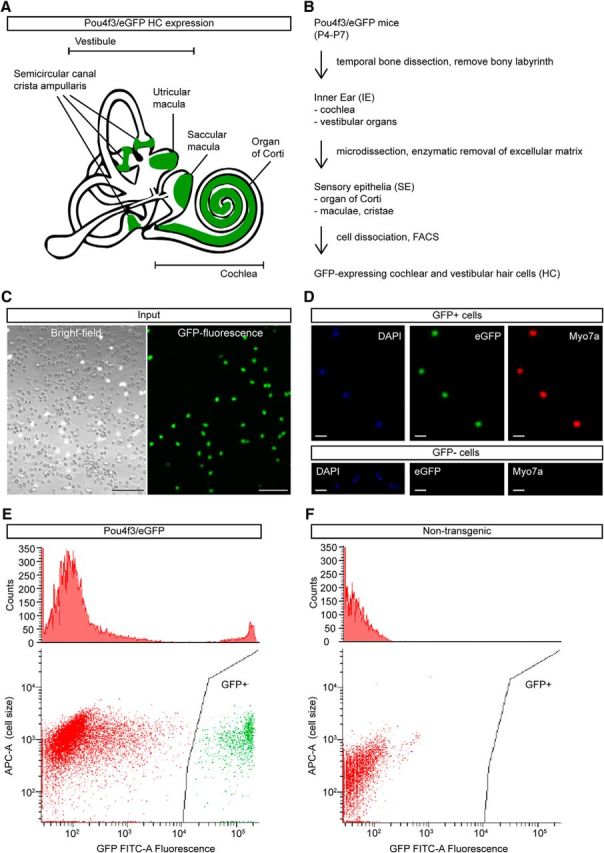
IE, SE, and GFP+ HC sample preparation for LC-MS/MS. A, Schematic of the mammalian IE. SEs, where GFP+ HCs are located, are highlighted in green. B, Pipeline showing sample preparation from the whole mouse IE to obtaining the SE by microdissection and enzymatic digestion of extracellular matrix and the final isolation and collection of GFP+ HCs by FACS. C, Dissociated GFP+ HCs and GFP− supporting cells from IE SE before FACS-sorting. Scale bar, 100 μm. D, FACS-sorted GFP+ HCs were confirmed with HC-specific Myo7a labeling (top). FACS-sorted GFP− cells did not express Myo7a (bottom). Scale bar, 5 μm. E, FACS histograms and scatterplots of dissociated SE cells from Pou4f3/eGFP mice. Only single cells showing distinctive GFP fluorescence are collected for MS HC analysis. F, FACS histograms and scatterplots of dissociated SE cells from C57BL/6 wild-type mice, where GFP fluorescent cells are absent.
Figure 2.
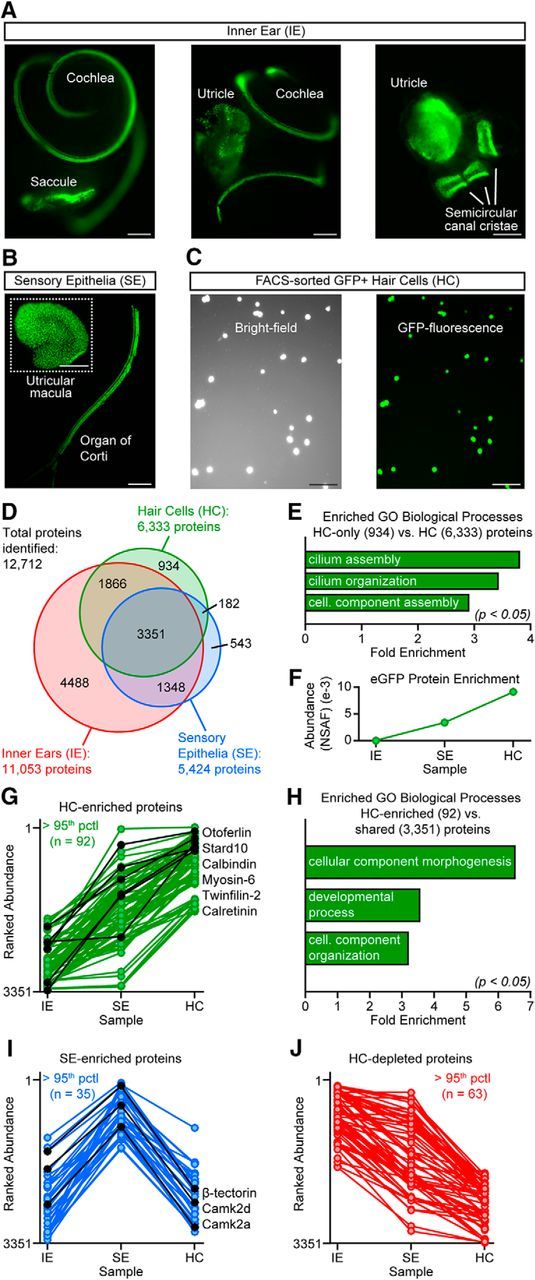
MS analysis of mouse IE proteomes. A, Fluorescence images of whole IE tissues showing GFP+ HCs in the cochlear and vestibular (saccule, utricle, semicircular canal ampullae) SE regions. Scale bar, 200 μm. B, SE of cochlear organ of Corti and of vestibular macula after enzymatic and microdissection removal of extracellular matrices. Scale bar, 200 μm. C, FACS-sorted GFP+ HCs, confirming collection of only GFP fluorescent cells. Scale bar, 50 μm. D, Protein identification count Venn diagram of IE, SE, and HC datasets from 3, 25, and 132 mice, respectively. E, Proteins found uniquely in HCs are significantly enriched for GO terms related to ciliary structures (binomial test with Bonferroni correction: “cilium assembly”: p = 0.0097; “cilium organization”: p = 0.0211; “cellular component assembly involved in morphogenesis”: p = 0.0443). F, EGFP abundance from IE, SE, and HC proteomes (NSAF = normalized spectral abundance factor). G, HC-enriched proteins based on ranked abundance in HC versus SE or IE samples, with representative proteins and their rank abundance profiles in black. H, Proteins enriched in HCs (HC abundance > SE > IE) are significantly enriched for GO terms related to cell development, organization and morphogenesis (binomial test with Bonferroni correction: “cellular component morphogenesis”: p = 0.0000; “developmental process”: p = 0.0000; “cellular component organization”: p = 0.0001). I, J, “SE-enriched” (SE abundance > average of IE and HC) (I) and “HC-depleted” (IE abundance > SE > HC) (J) proteins were identified as those present in all samples but with higher ranked abundance in SE or in IE samples, respectively. Representative SE-enriched proteins and their rank abundance profiles are shown in black.
Using semiquantitative analysis based on protein rank abundance, we defined two sets of HC proteins: those found in the HC sample but not IE or SE samples (“HC-only”) and those with significantly higher abundance in the HC sample (“HC-enriched”) compared with SE and IE samples (HC abundance > SE > IE). Of 12,712 total proteins identified, we found evidence for approximately half (6333) in the purified HCs, with 934 proteins identified as “HC-only” (Fig. 2D, Table 1). Among these 934 proteins are many proteins known to be specifically expressed in HCs and known to support HC function critical for audition and balance, such as Espn, Myo3a, Ocm, Prestin (Slc26a5), and Strc (Zheng et al., 2000; Schneider et al., 2006; Sekerková et al., 2006; Verpy et al., 2011; Tong et al., 2016). Although present in all three sample types, HCs comprise only a fraction of the total protein content in the IE and SE samples; therefore, HC-only proteins likely represent both HC-specific proteins and some low-abundance proteins of other cell types that can only be accessed by MS when sample complexity is reduced. We addressed this latter possibility in part by additionally analyzing a purified population of GFP− cells from the same transgenic line and, in Table 1 of HC-only proteins grouped by gene, we indicate with double asterisks the genes for which proteins were identified in both the purified GFP+ and GFP− samples: only 8.3% (38 of 458 genes). Moreover, results of a GO term overrepresentation test (Fig. 2E) support the former possibility that HC-only proteins are largely HC specific, two of three significantly enriched biological processes categories among HC-only proteins are related to ciliated cells (binomial test with Bonferroni correction: “cilium assembly”: p = 0.0097; “cilium organization”: p = 0.0211; “cellular component assembly involved in morphogenesis”: p = 0.0443), based in part on identification of HC and stereocilia bundle proteins such as Dync2h1 and Rab3ip (Shin et al., 2013; Krey et al., 2015). We note that scarce HC proteins that reside primarily extracellularly may be underrepresented in the HC datasets due to the proteinase digestion step needed to dissociate the SE cells before FACS purification. This may explain the absence of certain proteins from our HC dataset such as cadherin-23 and protocadherin-15, elements of the stereocilia tip links (Kazmierczak and Mu, 2012).
Table 1.
Table of 934 proteins identified in the HC sample, but not in the IE or SE datasets (“HC-only”) ordered alphabetically by gene name (n = 458)
| Gene name | UniProt accession nos. (no. of peptides mapped, no. of spectral counts) |
|---|---|
| 1110004E09Rik* | D3YZC4 (1, 1); D6REH7 (1, 1); Q8BL95 (1, 1) |
| 2310036O22Rik* | Q9D735 (1, 1) |
| 4833439L19Rik*, P33monox* | D3Z1F7 (1, 1); Q9DBN4 (1, 1); Q9DBN4-2 (1, 1) |
| 4922501L14Rik | G3UY94 (1, 2) |
| 4930407I10Rik* | D3Z5T8 (1, 3) |
| 5430421N21Rik* | E9Q1Y9 (1, 1) |
| 6030458C11Rik | Q8BGC1-3 (1, 1) |
| 8030462N17Rik* | Q0VAW6 (1, 1); Q8BH50 (1, 1); Q8BH50-2 (1, 1) |
| A2mp** | Q6GQT1 (2, 19) |
| A730017C20Rik* | E9Q5J6 (1, 1); H3BJK3 (1, 1); Q8C4X7 (1, 1) |
| Abhd10* | F6X5P5 (1, 1); Q6PE15 (2, 2); Q6PE15-2 (2, 2) |
| Abracl* | E9QMV2 (1, 1); Q4KML4 (1, 1) |
| Acad10* | Q8K370 (2, 2) |
| Acad12* | D3Z7X0 (2, 2) |
| Acsf3 | Q3URE1-2 (1, 1) |
| Adprhl1* | Q8BGK2 (1, 1) |
| Aftph* | H3BJH7 (1, 1); Q80WT5 (1, 1); Q80WT5-2 (1, 1) |
| Agps | H3BIY5 (1, 1) |
| Agtrap* | Q9WVK0 (1, 1) |
| Ahctf1* | F6SJR1 (1, 1); Q8CJF7 (1, 1) |
| Aldh1a3 | G3UWP3 (4, 4) |
| Amfr* | Q9R049 (2, 3); Q9R049-2 (2, 3) |
| Ank1 | D6RJ51 (1, 1); G3UY11 (1, 1) |
| Ank3 | S4R162 (1, 3) |
| Ankrd24* | Q80VM7 (2, 3) |
| Ankrd49* | Q8VE42 (1, 1) |
| Aoc2* | A2A4I9 (1, 1); Q812C9 (1, 1) |
| Ap3b2* | Q9JME5 (7, 10) |
| Apba1 | B2RUJ5-2 (4, 22) |
| Arhgap11a* | Q80Y19 (1, 1) |
| Arl1 | F8WIB1 (4, 4) |
| Arl6ip1* | Q9JKW0 (1, 3) |
| Arl6ip4* | D3YWC2 (1, 2); D3Z6F1 (1, 2); Q9JM93 (1, 2) |
| Armc8* | G3X920 (2, 2); Q9DBR3 (2, 2); Q9DBR3-2 (2, 2); Q9DBR3-3 (2, 2) |
| Armt1* | A6H630 (1, 1); A6H630-2 (1, 1); A6H630-3 (1, 1); A6H630-4 (1, 1) |
| Asb3* | A8Y5I6 (1, 1); Q9WV72 (1, 1) |
| Atad2b* | E9Q166 (2, 5) |
| Ate1* | J3QNU1 (2, 2); Q4FCQ7 (2, 2); Q9Z2A5 (2, 2); Q9Z2A5-2 (2, 2) |
| Atp4a** | E9QNX7 (1, 2); Q64436 (1, 2); Q91WH7 (1, 2) |
| Atp8a2* | P98200 (1, 1) |
| Aven* | A2AGL5 (1, 2); Q9D9K3 (1, 2) |
| B9d2* | Q3UK10 (1, 1) |
| Bad* | D3YZR8 (1, 2); F7ABX5 (1, 2); Q3U9H3 (1, 2); Q61337 (1, 2) |
| Bag6 | G3UYZ0 (2, 8); G3V013 (2, 8) |
| Bbs4* | Q8C1Z7 (1, 1) |
| Bbs9* | Q811G0 (1, 1); Q811G0-2 (1, 1); Q811G0-4 (1, 1) |
| BC007180* | F6QRE9 (1, 1) |
| BC017158* | D6RDS0 (1, 1); Q91W34 (1, 1); Q91W34-2 (1, 1) |
| Bcl2** | P10417 (1, 1); P10417-2 (1, 1) |
| Birc6 | J3QP64 (1, 1); S4R268 (2, 2); S4R2J7 (1, 1) |
| Blmh | E9QA53 (3, 3) |
| Bpifb9b* | A2AJD1 (1, 1); Q80XI7 (1, 1); Q80XI7-2 (1, 1) |
| Brsk1* | D3Z5P0 (1, 1); Q5RJI5 (1, 1) |
| Bsdc1* | Q80Y55 (1, 1) |
| Btaf1* | E9QAE3 (1, 1) |
| C4b** | P01029 (3, 3) |
| Calml4* | E9Q1L1 (1, 1); Q91WQ9 (1, 1); Q91WQ9-2 (1, 1); Q91WQ9-3 (1, 1) |
| Casz1* | B1AS46 (2, 5); B1AS48 (1, 1); Q9CWL2 (2, 5); Q9CWL2-2 (2, 5) |
| Ccdc104* | Q8C6E0 (2, 2) |
| Ccdc33* | E9QQ55 (1, 1); Q3ULW6 (1, 1) |
| Ccdc39* | Q9D5Y1 (1, 1) |
| Ccdc40* | Q8BI79 (2, 2); Q8BI79-2 (2, 2); Q8BI79-3 (2, 2) |
| Ccnk* | O88874 (2, 4); Q3U3M5 (2, 4) |
| Cdk13** | Q69ZA1 (3, 4); Q69ZA1-2 (3, 4) |
| Chd8* | Q09XV5 (1, 2); Q09XV5-2 (1, 2) |
| Chp1 | B0R092 (1, 1) |
| Chst2* | Q80WV3 (1, 1) |
| Cisd3* | B1AR13 (1, 3); B2RWE3 (1, 3) |
| Clk3* | O35492 (1, 1) |
| Commd7** | Q8BG94 (1, 2) |
| Cox4i2* | Q91W29 (1, 1) |
| Cpeb2* | D3YUJ4 (1, 1); E9Q5X2 (1, 1); E9Q969 (1, 1); Q812E0 (1, 1) |
| Cpeb3* | D3Z1R6 (1, 1); D3Z5R9 (1, 1); F6T0J8 (1, 1); Q7TN99 (1, 1); Q7TN99-2 (1, 1); Q7TN99-3 (1, 1); Q7TN99-4 (1, 1); Q7TN99-5 (1, 1) |
| Cpeb4* | Q5SU47 (1, 1); Q5SU48 (1, 1); Q7TN98 (1, 1); Q7TN98-2 (1, 1); Q7TN98-3 (1, 1); Q7TN98-4 (1, 1); Q7TN98-5 (1, 1) |
| Cpt2 | A2A8E9 (2, 5) |
| Cradd* | O88843 (1, 1) |
| Cryzl1 | D3YZD6 (1, 1); F7BGV1 (1, 1); Q921W4-2 (1, 1) |
| Ctbp2 | E9Q123 (1, 1) |
| Ctif* | E9Q1U6 (1, 1); Q6PEE2 (1, 1); Q6PEE2-2 (1, 1) |
| Ctnnb1 | D3Z5Q1 (1, 1); E9PW26 (1, 1) |
| Cyb5d2* | Q5SSH8 (1, 1) |
| Cyb5r1 | G3UZG6 (1, 2) |
| Cyb5r2* | Q3KNK3 (1, 2); Q3KNK3-2 (1, 2) |
| Cyld* | Q80TQ2 (1, 2); Q80TQ2-2 (1, 2) |
| Cyp2s1* | D3Z762 (1, 1); D3Z7F1 (3, 4); Q9DBX6 (3, 4) |
| D2Wsu81e* | Q3UHX9 (1, 1); Q3UHX9-2 (1, 1) |
| D630045J12Rik*, Kiaa1549* | D3YTS3 (1, 1); F7ATU7 (1, 1); Q68FD9 (1, 1) |
| Dach1** | Q9QYB2 (1, 1); Q9QYB2-2 (1, 1) |
| Dcp1a* | Q91YD3 (1, 1) |
| Ddx39b | G3UXI6 (2, 14) |
| Dgke* | F2Z490 (1, 1); Q9R1C6 (1, 1) |
| Dicer1* | F8VQ54 (1, 1); Q8R418 (1, 1); Q8R418-2 (1, 1) |
| Dnaaf2* | Q8BPI1 (1, 1) |
| Dnah10* | D3YYQ8 (1, 1); F7ABZ6 (1, 1) |
| Dnah5* | Q8VHE6 (1, 1) |
| Dnai2*, Dnaic2* | A2AC93 (1, 1); A2AC93-2 (1, 1); R4GML5 (1, 1) |
| Dnajb2* | Q9QYI5 (1, 5); Q9QYI5-2 (1, 5) |
| Dpf3* | F6T820 (1, 1); F7CL41 (2, 2); F7CPB1 (2, 2); P58269 (2, 2); P58269-2 (2, 2); P58269-3 (1, 1); P58269-4 (2, 2) |
| Dph6 | Q9CQ28-3 (1, 3) |
| Dst | S4R1Y6 (1, 1); S4R2A8 (1, 1); S4R2C6 (1, 1) |
| Dtd1* | Q9DD18 (1, 1); Q9DD18-2 (1, 1) |
| Dtna | Q9D2N4-5 (2, 2); Q9D2N4-6 (2, 2) |
| Dusp14* | Q9JLY7 (1, 1) |
| Dxo* | G3UWW3 (1, 1); G3UZ39 (1, 1); O70348 (1, 1) |
| Dync2h1 | D3Z025 (8, 11); Q45VK7-3 (3, 6) |
| Dynlrb2* | Q9DAJ5 (3, 4); Q9DAJ5-2 (3, 4) |
| Echdc1* | E0CXS3 (1, 1); Q9D9V3 (2, 2); Q9D9V3-2 (2, 2) |
| Edc4 | F6V5I7 (1, 1); F6ZJ27 (2, 2) |
| Ehmt1* | A2AIS5 (1, 1); E9Q5A3 (2, 2); Q5DW34 (2, 2); Q5DW34-2 (2, 2); Q5DW34-3 (2, 2); Q8BRN2 (1, 1) |
| Enpp4* | Q8BTJ4 (1, 1); Q8BTJ4-2 (1, 1) |
| Ephx1 | F6YTS6 (4, 7) |
| Epn2** | F7CD65 (1, 1); F7CUV7 (1, 1); J3QNT7 (1, 1); Q5NCM5 (1, 1); Q5NCM6 (1, 1); Q8CHU3 (1, 1); Q8CHU3-2 (1, 1) |
| Espn* | B1AWP7 (1, 2); B1AWP8 (1, 2); B1AWP9 (1, 2); B1AWQ0 (1, 2); B1AWQ1 (1, 2); B1AWQ3 (1, 2); B1AWQ4 (1, 2); Q9DD12 (1, 2); Q9ET47 (1, 2); Q9ET47-2 (1, 2); Q9ET47-3 (1, 2); Q9ET47-4 (1, 2); Q9ET47-5 (1, 2); Q9ET47-6 (1, 2); Q9ET47-7 (1, 2); Q9ET47-8 (1, 2) |
| Espnl* | H3BLK9 (4, 7); Q3UYR4 (4, 7) |
| Evl* | E9PVP4 (2, 2); F8WJB9 (2, 2); P70429 (2, 2); P70429-2 (2, 2) |
| Eya4* | Q8BY78 (2, 3); Q9Z191 (1, 2) |
| Fam160b1* | Q8CDM8 (1, 2); Q8CDM8-2 (1, 2) |
| Fam168a* | Q8BGZ2 (1, 1); Q8BGZ2-2 (1, 1) |
| Fam192a* | Q91WE2 (1, 1) |
| Fam63a* | Q76LS9 (1, 1); Q76LS9-2 (1, 1) |
| Fbp2* | P70695 (2, 3) |
| Fbxo46* | Q8BG80 (1, 1) |
| Fcrlb* | Q5DRQ8 (13, 37) |
| Fer1l4* | A3KGK3 (1, 2); A3KGK3-2 (1, 2) |
| Fggy* | A2AJL3 (3, 4); A2AJL3-2 (3, 4); A2AJL4 (3, 4); B7ZCH9 (1, 1); D6RG41 (2, 3); F7ANG8 (1, 1) |
| Fhod3* | Q76LL6 (1, 1); Q76LL6-2 (1, 1); Q76LL6-3 (1, 1); Q76LL6-4 (1, 1) |
| Fjx1* | Q8BQB4 (1, 1) |
| Flg2* | E9QPZ3 (1, 2); Q2VIS4 (1, 2) |
| Fn3krp* | Q8K274 (1, 1) |
| Fubp3 | F6S444 (1, 1); F6W2V3 (1, 1) |
| Gab2* | Q3ZB57 (1, 1); Q9Z1S8 (1, 1) |
| Gabarapl1* | Q8R3R8 (1, 1) |
| Galk2 | B7ZCT3 (1, 1); B7ZCT4 (1, 1); B7ZCT5 (1, 1) |
| Gas7* | B1ATI9 (1, 1); Q3U432 (1, 1); Q60780 (1, 1); Q60780-2 (1, 1) |
| Gdap1l1** | A2A5H8 (1, 2); Q3USC7 (2, 4); Q8VE33 (2, 4) |
| Gga3* | A2A9W7 (1, 1); Q8BMI3 (1, 1) |
| Gm17190* | V9GX38 (3, 20) |
| Gm20683* | H3BKJ1 (1, 1) |
| Gm4944* | J3QM38 (1, 1) |
| Gm5039* | J3QNT6 (1, 4) |
| Gm5414* | Q6IFZ8 (1, 3) |
| Gm8420 | E9Q1X1 (1, 1) |
| Gmfg | D3YY16 (1, 1) |
| Gmppa | D3YVK2 (2, 2); D3Z2L8 (2, 2); D3Z5Z5 (2, 2) |
| Gpaa1** | E9PW03 (1, 1); E9QA52 (1, 1); F6T7Y8 (1, 1); Q9WTK3 (1, 1) |
| Gpkow* | Q56A08 (1, 1) |
| Gpx2* | Q9JHC0 (3, 4) |
| Grhpr | B1AXQ0 (1, 1) |
| Grip1* | D3YWY4 (1, 2); D3YZL8 (1, 2); D3Z066 (1, 2); D3Z6R6 (1, 2); D3Z6T4 (1, 2); H7BX09 (1, 2); H7BX90 (1, 2); Q6GQT7 (1, 2); Q925T6 (1, 2); Q925T6-2 (1, 2); Q925T6-3 (1, 2) |
| Grxcr1* | G3X9N2 (1, 1); Q50H32 (1, 1) |
| Grxcr2* | Q3TYR5 (1, 1) |
| Gsdma* | Q9EST1 (1, 1) |
| Gsdma2* | Q32M21 (1, 1); Q32M21-3 (1, 1) |
| Gsdma3* | Q5Y4Y6 (1, 1) |
| Gtf2a2* | D3Z793 (2, 7); D3Z7C2 (2, 7); D3Z7S8 (2, 7); D6RIQ7 (2, 7); Q05C74 (2, 7); Q80ZM7 (2, 7) |
| Hal* | P35492 (1, 1) |
| Hba-x**, Hbz** | A7M7S6 (1, 3); P06467 (1, 3) |
| Heatr2* | B9EJR8 (1, 1) |
| Heatr3* | Q8BQM4 (1, 1) |
| Hip1r | F7DCR9 (1, 2) |
| Hmg20a | Q9DC33-2 (1, 1); Q9DC33-3 (1, 1) |
| Hmga1 | P17095-1 (1, 1) |
| Hn1* | P97825 (1, 1) |
| Hnrnph3 | D3Z6Y3 (1, 2) |
| Hnrnpll | Q921F4-5 (1, 1) |
| Hook1* | Q8BIL5 (2, 2); Q8BIL5-2 (2, 2) |
| Hpcal1* | P62748 (1, 5) |
| Hsd11b2* | P51661 (1, 2) |
| Hspa4l | F6TFH3 (1, 1) |
| Hspb11* | Q9D6H2 (1, 1) |
| Huwe1 | F6UYC1 (1, 1) |
| Iba57* | Q8CAK1 (1, 1) |
| Idi1 | H3BKD7 (1, 1); H3BLP1 (1, 1) |
| Idua* | P48441 (1, 1); Q8BLF6 (1, 1); Q8BMG0 (1, 1) |
| Ift172* | Q6VH22 (1, 1) |
| Ilvbl | Q8BU33-2 (1, 2); Q8BU33-3 (1, 2) |
| Inpp5j* | P59644 (1, 1) |
| Ints6 | Q6PCM2-3 (1, 1) |
| Ints9* | Q8K114 (2, 2); Q8K114-2 (1, 1) |
| Iqcd* | Q9D3V1 (1, 1); Q9D3V1-2 (1, 1) |
| Itpkc* | Q7TS72 (1, 1) |
| Kcnab1* | P63143 (2, 2); Q3U6C5 (2, 2); Q9D5E9 (2, 2) |
| Kcnab2* | E0CXZ9 (1, 1); P62482 (1, 1); Q3UPV6 (1, 1) |
| Kcnj13* | P86046 (1, 1) |
| Klc2 | D3Z5Y7 (2, 2) |
| Klf11* | Q8K1S5 (1, 1) |
| Klhdc7b* | E9Q9M9 (2, 6) |
| Kncn* | Q307W7 (1, 1) |
| Krt13 | P08730-2 (5, 14) |
| Krt16** | Q9Z2K1 (6, 13) |
| Krt20* | Q9D312 (2, 3) |
| Krt24** | A1L317 (1, 1) |
| Krt28** | A6BLY7 (1, 1) |
| Krt31** | Q61765 (1, 1) |
| Krt32* | B1ATJ5 (1, 1); Q62168 (1, 1) |
| Krt33b** | Q61897 (1, 1) |
| Krt35** | Q497I4 (1, 1) |
| Krt36* | B1AQ75 (1, 1) |
| Krt40** | Q6IFX3 (1, 1) |
| Krt72** | Q6IME9 (1, 7) |
| Krt78* | E9Q0F0 (1, 7) |
| Krt81* | Q9ERE2 (1, 1) |
| Krt83* | Q6IMF0 (2, 2) |
| Krt85* | Q9Z2T6 (2, 2) |
| Krt86* | P97861 (1, 1) |
| Ksr1* | Q5SXE2 (1, 1); Q5SXE4 (1, 1); Q61097 (1, 1); Q61097-2 (1, 1) |
| Lactb2* | Q99KR3 (2, 3) |
| Lchn* | Q3UHG7 (1, 1); Q3UHG7-2 (1, 1) |
| Lgalsl* | Q8VED9 (3, 3) |
| Lgi2* | Q8K4Z0 (1, 1); Q8K4Z0-2 (1, 1) |
| Limd1* | Q9QXD8 (2, 4) |
| Limk2* | O54785 (1, 1); O54785-2 (1, 1); O54785-3 (1, 1); Q5NC03 (1, 1) |
| Lmbrd2* | Q8C561 (1, 1); Q8C561-2 (1, 1); Q8C561-3 (1, 1) |
| Lmo7 | E0CZD8 (1, 1) |
| Lnp** | A2ASL8 (1, 1); A2ASM0 (1, 1); Q7TQ95 (1, 1) |
| Lpin2* | E9PWN0 (1, 1); Q99PI5 (1, 1) |
| Lrrc16a* | D3Z030 (2, 6); F7AI27 (1, 2); Q6EDY6 (2, 6); Q6EDY6-3 (2, 6) |
| Lsm1* | Q8VC85 (1, 1) |
| Lyz1* | P17897 (1, 2) |
| Macf1 | F6RCJ3 (1, 1); F6RL59 (1, 1); Q9CYG3 (1, 1) |
| Madd | A6PWP7 (2, 3) |
| Map9* | Q3TRR0 (1, 1); Q3TRR0-2 (1, 1) |
| Mboat7* | D3YU33 (2, 3); Q8CHK3 (2, 3) |
| Mcat** | Q8R3F5 (2, 2) |
| Mcl1* | P97287 (1, 1); P97287-2 (1, 1) |
| Med1* | Q925J9 (1, 1); Q925J9-4 (1, 1) |
| Med8* | A2A9C6 (1, 1); A2A9C8 (1, 1); Q9CY05 (1, 1); Q9D7W5 (1, 1); Q9DAY7 (1, 1) |
| Mepce | F6XIE4 (1, 3) |
| Metap1d* | Q9CPW9 (1, 1) |
| Mfn1* | F6XRI9 (1, 1); Q811U4 (1, 1) |
| Mgst1** | E9QJW0 (1, 1); Q91VS7 (1, 1) |
| Minos1* | Q7TNS2 (1, 1) |
| Misp** | Q9D279 (1, 1) |
| Mllt4 | F7C3I9 (1, 2) |
| Mms19 | F7A0X7 (1, 1); F7C9N6 (1, 1) |
| Mpc1* | D3Z786 (1, 2); P63030 (1, 2) |
| Mpdz | A3KG84 (1, 2); I7HJS5 (1, 2) |
| Mpp7* | G5E8S8 (1, 1); Q8BVD5 (1, 1); Q8BVD5-2 (1, 1); Q8BVD5-4 (1, 1); Q8BVD5-5 (1, 1) |
| Mri1 | F6YY88 (1, 2) |
| Mrpl22* | Q8BU88 (1, 1) |
| Mrpl9* | Q3UK02 (1, 3); Q99N94 (1, 3) |
| Mrps11* | Q3U8Y1 (1, 1); Q9DCA2 (1, 1) |
| Mrps5* | Q99N87 (1, 1) |
| Msh2 | G3UXD8 (1, 1) |
| Msrb3* | D3YUC9 (1, 2); Q8BU85 (1, 2) |
| Mtfr1l | D3YW54 (3, 3); D3Z0X8 (3, 3); D6RCX5 (3, 3); Q9CWE0-2 (3, 3) |
| Mthfd2* | P18155 (1, 1) |
| Myl2* | P51667 (1, 7) |
| Myo3a* | A2ASW0 (1, 1); F6QNG5 (1, 1); Q8K3H5 (1, 1) |
| Myo3b* | F8VQ79 (1, 1); Q1EG27 (1, 1); Q1EG27-2 (1, 1) |
| Nbeal1* | E9PV03 (1, 1) |
| Nccrp1** | G3X9C2 (1, 7) |
| Nck1* | Q8BH99 (1, 1); Q99M51 (1, 1) |
| Ncoa1* | P70365 (1, 1); P70365-2 (1, 1); P70365-3 (1, 1); P70365-4 (1, 1) |
| Ncor2 | D3Z2J5 (1, 1); F6Z4B2 (1, 1) |
| Ndufa12 | F6RBR6 (1, 1) |
| Ndufaf4* | Q9D1H6 (1, 1) |
| Neb | A2AQB2 (1, 2); F6X9B6 (1, 2) |
| Necap1* | Q9CR95 (1, 1) |
| Nf2* | F8WJ43 (1, 1); P46662 (1, 1); P46662-2 (1, 1) |
| Nfatc4* | Q8K120 (1, 3); Q8K120-2 (1, 3) |
| Nfib** | A2BG75 (1, 1); A2BG76 (1, 1); A2BG77 (1, 1); I7HIP8 (1, 1); P97863 (1, 1); P97863-2 (1, 1); P97863-3 (1, 1) |
| Nhsl1* | Q8CAF4 (1, 2); Q8CAF4-3 (1, 2) |
| Nit1 | D3YY53 (2, 2); D3Z2Y2 (2, 2); D3Z3I3 (2, 2) |
| Nlgn3* | A2AGI2 (1, 1); A2AGI3 (1, 1); Q8BYM5 (1, 1) |
| Nln* | Q91YP2 (2, 2) |
| Noc3l* | Q8VI84 (1, 1) |
| Nptn | H3BKA7 (1, 1) |
| Nrbp1* | D3YUV1 (1, 1); Q99J45 (1, 1) |
| Nt5dc3* | Q3UHB1 (2, 2) |
| Nudt16l1 | Q8VHN8-3 (1, 1) |
| Nup214 | A2ATN3 (1, 1) |
| Nup35** | A2ATJ2 (1, 1); Q8R4R6 (1, 1) |
| Nup88 | J3QNZ2 (1, 3) |
| Nxt1** | Q9QZV9 (1, 1) |
| Ocm* | P51879 (1, 1) |
| Osbp2* | Q5QNQ4 (1, 1); Q5QNQ6 (1, 1); Q8K0C7 (1, 1) |
| Oscp1* | Q8BHW2 (2, 2) |
| Otud7b* | B2RUR8 (1, 1) |
| Ovca2* | Q9D7E3 (1, 1) |
| Paip1 | G3UYE5 (2, 3); G3UZH8 (1, 2); G3UZS6 (1, 2) |
| Pak1 | S4R2K7 (2, 2) |
| Pak3 | A3KGC3 (1, 1); A3KGC4 (1, 1); A3KGC5 (5, 9) |
| Palm3* | A2TJV2 (7, 9) |
| Paqr9* | Q6TCG2 (1, 2) |
| Pawr* | Q925B0 (1, 2) |
| Pcif1* | P59114 (1, 1) |
| Pde4dip* | E9Q1A0 (3, 4); G3X9L9 (3, 4); H3BJ38 (2, 3); Q3UR03 (2, 3); Q80YT7 (3, 4); Q80YT7-2 (3, 4) |
| Pex5l* | D3YYH0 (1, 1); D3YYH1 (1, 1); F8SLP9 (1, 1); F8SLQ3 (1, 1) |
| Pgam5* | Q8BX10 (1, 2) |
| Pgm2l1 | E0CX81 (1, 1) |
| Phax* | G5E8V8 (1, 1); Q9JJT9 (1, 1) |
| Phc2* | Q9QWH1 (1, 2); Q9QWH1-2 (1, 2) |
| Phc3* | B7ZNA5 (1, 1); D3YY34 (1, 1); E9QPT4 (1, 1); Q8CHP6 (1, 1); Q8CHP6-2 (1, 1) |
| Phrf1* | A6H619 (1, 1); A6H619-2 (1, 1) |
| Pi4kb | D6RI80 (1, 1) |
| Pick1* | E9PUZ5 (1, 1); E9QAC6 (1, 1); Q62083 (1, 1) |
| Pih1d1* | Q9CQJ2 (1, 1) |
| Pik3r2* | O08908 (1, 1) |
| Pkn2 | Q8BWW9-3 (1, 2) |
| Pknox2* | Q8BG99 (1, 1) |
| Pkp1* | P97350 (1, 2) |
| Pkp4* | A2AS45 (1, 2); A2AS47 (1, 2); Q68FH0 (1, 2); Q68FH0-2 (1, 2) |
| Plce1* | Q8K4S1 (1, 1); S4R1Q8 (1, 1) |
| Plekha7* | Q3UIL6 (1, 1); Q3UIL6-2 (1, 1); Q3UIL6-3 (1, 1); Q3UIL6-5 (1, 1); Q3UIL6-6 (1, 1); S4R243 (1, 1) |
| Plekho1* | F6XQM2 (1, 1); Q9JIY0 (1, 1) |
| Poldip2* | F6SQH7 (1, 1); Q91VA6 (1, 1) |
| Poldip3 | F6VR84 (1, 1) |
| Pou4f3* | Q63955 (2, 2) |
| Ppox* | P51175 (2, 2) |
| Ppp2r5b* | Q6PD28 (2, 2) |
| Prepl | Q8C167-3 (1, 1) |
| Prr15* | Q9D1T5 (1, 1) |
| Prrc2c | S4R209 (2, 2); S4R2L9 (3, 3) |
| Prrt4* | B2RU40 (1, 1) |
| Psma6 | E0CYT2 (1, 3) |
| Psmd13 | E9PY93 (1, 4) |
| Pten* | O08586 (1, 1) |
| Ptpn3* | A2ALK8 (1, 1) |
| Pum1** | A8WHM8 (1, 2); E9Q6M7 (1, 2); Q3TTW5 (1, 2); Q80U78 (1, 2); Q80U78-2 (1, 2); Q80U78-3 (1, 2); Q80U78-4 (1, 2) |
| Pus10 | B0QZU5 (1, 2) |
| Qpctl* | Q8BH73 (1, 1); Q8BH73-2 (1, 1) |
| Qtrt1* | Q9JMA2 (2, 2) |
| Rab3d | D3YW33 (1, 1); D3YWL1 (1, 1) |
| Rab3ip* | Q68EF0 (3, 8) |
| Rabepk* | A2AUF7 (1, 1); B0R0S4 (2, 2); Q8VCH5 (2, 2) |
| Ralgapb* | A2ACC6 (1, 1); A2ACC7 (1, 1); E9Q0J2 (1, 1); F8WHN4 (1, 1); Q8BQZ4 (1, 1); Q8BQZ4-2 (1, 1) |
| Ranbp9 | P69566-2 (1, 1) |
| Rasal2* | D3YUS5 (1, 1); E9PW37 (1, 1); E9PYD8 (1, 1) |
| Rasgrp4* | E0CX54 (1, 1); E0CZ06 (1, 1); E9QKB7 (1, 1); Q8BTM9 (1, 1); Q8BTM9-2 (1, 1); Q8BTM9-3 (1, 1); Q8BTM9-4 (1, 1) |
| Rbm27** | Q5SFM8 (1, 1); Q5SFM8-2 (1, 1); Q5SFM8-3 (1, 1) |
| Rbm33* | D3Z5I9 (1, 1); Q9CXK9 (1, 1) |
| Rcc2 | A2AWQ2 (2, 5) |
| Rdh12* | Q8BYK4 (3, 4) |
| Rdh13* | Q8CEE7 (1, 2) |
| Rnf40* | Q3U319 (1, 1) |
| Rnmt | D3Z4K1 (1, 1) |
| Rpp25l* | Q99JH1 (1, 1) |
| Rprd2* | Q6NXI6 (1, 1); Q6NXI6-2 (1, 1) |
| Rsph10b* | E9PYQ0 (1, 1) |
| Rsph9* | F7B7Q8 (1, 1); Q9D9V4 (1, 1) |
| Rtn1** | A3QM89 (1, 2); Q7M6W1 (1, 2); Q8K0T0 (1, 3) |
| Rtn4ip1** | Q924D0 (1, 1) |
| Sall1* | Q6P5E3 (1, 1); Q9ER74 (1, 1) |
| Sap130* | J3QNK5 (1, 1); Q8BIH0 (1, 1); Q8BIH0-2 (1, 1); Q8BIH0-3 (1, 1) |
| Scaf4* | Q6PFF0 (1, 1); Q7TSH6 (1, 1) |
| Scai** | Q8C8N2 (1, 1) |
| Scrib | D3YU97 (2, 2) |
| Scyl2 | Q80UY7 (1, 3) |
| Sdcbp* | A2AKJ6 (1, 1); A2AKJ9 (1, 1); H3BLG5 (1, 1); O08992 (1, 1); Q3TMX0 (1, 1) |
| Sdhc* | D3Z1A8 (1, 5); Q9CZB0 (1, 5) |
| Sdsl* | Q8R238 (1, 1) |
| Sec61a2* | A2ATT9 (1, 3); Q9JLR1 (1, 3) |
| Selh** | Q3UQA7 (1, 2) |
| Serpinb13* | Q8CDC0 (1, 1); Q8CDC0-2 (1, 1) |
| Setd6* | Q9CWY3 (1, 1) |
| Setdb1* | D3YYC3 (1, 5); G5E8N3 (1, 5); O88974 (1, 5); O88974-3 (1, 5); O88974-4 (1, 5) |
| Sh2d4b* | A6X942 (3, 4); A6X942-2 (3, 4) |
| Sh3gl2 | F6ZL13 (1, 1) |
| Shank2* | D3Z5K8 (1, 1); D3Z5K9 (1, 1); Q80Z38 (1, 1); Q80Z38-2 (1, 1) |
| Shroom2* | A2ALU4 (3, 3); A7TU71 (3, 3) |
| Skor1* | D3YX64 (2, 2); Q8BX46 (2, 2); Q8BX46-2 (2, 2) |
| Skor2* | A7M7C7 (1, 1) |
| Slc25a11 | Q5SX48 (2, 3) |
| Slc25a46* | Q9CQS4 (1, 2) |
| Slc26a5* | D3Z013 (2, 5); D6RIK0 (1, 4); Q32MT6 (2, 5); Q99NH7 (2, 5) |
| Slc27a2* | A2ANX6 (1, 1); O35488 (1, 1) |
| Smap2* | Q7TN29 (3, 8); Q7TN29-2 (3, 8) |
| Smarca1 | Q8BS67 (1, 2) |
| Smarcal1* | Q8BJL0 (1, 1); Q8BJL0-2 (1, 1); Q8BJL0-3 (1, 1); Q8BJL0-4 (1, 1) |
| Smg7* | Q5RJH6 (1, 1); Q5RJH6-2 (1, 1); Q5RJH6-3 (1, 1) |
| Smpdl3a | D3Z1B4 (1, 2) |
| Smtn* | D3YVS1 (1, 1); D3Z3Q3 (1, 1); Q921U8 (1, 1); Q921U8-2 (1, 1); Q921U8-3 (1, 1); Q921U8-4 (1, 1) |
| Smug1* | Q6P5C5 (1, 1) |
| Snrpe | E9PZG9 (1, 1) |
| Spag8* | Q3V0Q6 (1, 1); Q5UAV3 (1, 1) |
| Spats2l | E9Q106 (1, 1) |
| Spryd4* | Q91WK1 (1, 1) |
| Srcin1** | B1AQX6 (2, 3); B1AQX7 (2, 3); B1AQX9 (2, 3); Q9QWI6 (1, 1); Q9QWI6-2 (1, 1); Q9QWI6-3 (1, 1) |
| Srgap2* | Q91Z67 (1, 3) |
| Srp54 | P14576-2 (1, 1) |
| Srpk1 | F8WGJ7 (1, 1) |
| Stk32c* | Q8QZV4 (1, 1) |
| Stk4 | Q8CDG4 (1, 1) |
| Strbp | A2BH83 (1, 1) |
| Strc* | Q8VIM6 (1, 1) |
| Stx16 | B7ZCB7 (1, 2) |
| Taf4a* | E9QAP7 (1, 2); F6W8W7 (1, 2) |
| Tapt1* | Q4VBD2 (1, 1) |
| Tars2* | Q3TP97 (1, 1); Q3UQ84 (1, 1); Q922A3 (1, 1) |
| Tbpl1* | P62340 (1, 2) |
| Tbrg4* | Q91YM4 (1, 2); Q91YM4-2 (1, 2) |
| Tcp11* | B2KF24 (1, 1); B2KF25 (1, 1); Q01755 (1, 1); Q5FWA2 (1, 1) |
| Tgfb1i1 | Q62219-6 (1, 2) |
| Tgm1* | Q9JLF6 (1, 1) |
| Thoc5* | Q5SVF8 (1, 2); Q5SVF9 (3, 4); Q8BKT7 (3, 4) |
| Tjap1* | Q9DCD5 (2, 4) |
| Tmcc2* | Q3T9T1 (2, 2); Q3TZY4 (2, 2); Q80W04 (2, 2) |
| Tmem11* | E9Q933 (2, 8); Q8BK08 (2, 8) |
| Tmem173* | Q3TBT3 (6, 6); Q3TBT3-2 (6, 6); Q3TBT3-3 (6, 6) |
| Tmem259* | F6RN19 (1, 2); Q8CIV2 (1, 2); Q8CIV2-2 (1, 2) |
| Tmem9b* | D3Z6W5 (1, 1); Q9JJR8 (1, 1) |
| Tmtc4* | Q8BG19 (1, 2); Q8BG19-3 (1, 2) |
| Tnxb* | E9Q2T3 (1, 1); O35452 (1, 1) |
| Tomt* | A1Y9I9 (3, 11) |
| Top2b | F6U5K2 (1, 1) |
| Tor1aip2 | Q8BYU6 (1, 2) |
| Tpgs1* | Q99MS8 (1, 1) |
| Trappc11* | B2RXC1 (1, 1) |
| Trim36* | E9Q3A0 (4, 8); Q80WG7 (4, 8) |
| Trim45* | A2ACL2 (2, 3); E9Q2K9 (2, 3); F6SXK7 (2, 3); Q6PFY8 (2, 3); Q6PFY8-2 (2, 3) |
| Triobp | G5E8W1 (1, 3); Q99KW3-5 (3, 3) |
| Trp53bp1 | F6S5E4 (2, 2) |
| Trrap* | E9PWT1 (1, 1); E9PZA7 (1, 1); E9QLK7 (1, 1); F7CGG2 (1, 1); Q80YV3 (1, 1) |
| Tsc2* | Q61037 (2, 3); Q61037-2 (2, 3); Q61037-3 (2, 3); Q61037-4 (2, 3); Q61037-5 (2, 3); Q61037-6 (2, 3); Q61037-7 (2, 3); Q7TT21 (2, 3) |
| Tsc22d1 | H3BJ00 (1, 1); H3BK98 (1, 1); H3BLH4 (1, 1) |
| Ttc8* | Q8VD72 (1, 1); Q8VD72-2 (1, 1) |
| Txlna | A2ADZ2 (1, 1); Q6PAM1-2 (1, 1) |
| Txndc11* | Q8K2W3 (1, 1) |
| Ubac1* | Q8VDI7 (1, 1) |
| Ube3b* | Q9ES34 (1, 1) |
| Ubl4 | F8WHM4 (1, 1) |
| Uckl1* | F7CAK3 (1, 1); Q91YL3 (1, 1) |
| Ugcg* | O88693 (1, 1) |
| Uqcc2* | D3Z4C9 (1, 1); D3Z4D6 (1, 1); Q9CQY6 (1, 1) |
| Uqcr11* | Q9CPX8 (1, 2) |
| Uros** | P51163 (1, 1) |
| Usp30* | Q3UN04 (1, 2) |
| Usp36* | B1AQJ2 (1, 1) |
| Usp8* | A2AI52 (1, 1); Q80U87 (1, 1) |
| Usp9x | E9PWA9 (1, 1); G3UZS3 (1, 1) |
| Vangl2* | D3YY75 (1, 1); Q91ZD4 (1, 1) |
| Vwa8 | Q8CC88-2 (3, 4) |
| Wac* | E9Q020 (1, 3); E9Q4Y9 (1, 3); E9Q5D5 (1, 3); F6R357 (1, 3); F6Z247 (1, 3); Q924H7 (1, 3); Q924H7-2 (1, 3); Q924H7-3 (1, 3) |
| Wdr12* | D3Z369 (1, 1); Q9JJA4 (2, 2) |
| Wdr19* | Q3UGF1 (1, 1); Q3UGF1-2 (1, 1); Q3UGF1-3 (1, 1) |
| Wdr26* | E0CYH4 (2, 3); F7DFQ2 (1, 2); F8WH48 (1, 1); Q8C6G8 (2, 3) |
| Wdr5 | F6Q3W0 (3, 5) |
| Wdr54 | D3Z394 (2, 4) |
| Wdr6* | Q99ME2 (1, 4) |
| Wdr76* | A6PWY4 (1, 1); A6PWY4-2 (1, 1); A6PWY4-3 (1, 1) |
| Wdr77 | D6RIL4 (1, 1) |
| Wdr81** | F6XD87 (1, 1); K4DI77 (1, 1); Q5ND34 (1, 1); Q5ND34-2 (1, 1); Q5ND34-3 (1, 1) |
| Wipf3** | D3Z5R4 (1, 1); E9Q2D0 (1, 1); P0C7L0 (1, 1); P0C7L0-2 (1, 1) |
| Wnk1** | F6U2S8 (1, 1); P83741 (1, 1); P83741-2 (1, 1); P83741-3 (1, 1); P83741-4 (1, 1); P83741-5 (1, 1) |
| Wnk2* | E0CYT1 (1, 2); E0CZE3 (1, 2); E9Q6Q2 (1, 2); E9QJQ9 (1, 2); E9QM73 (1, 2); E9QMI8 (1, 2); E9QMI9 (1, 2); F7BQG5 (1, 2); Q3UH66 (1, 2); Q3UH66-2 (1, 2); Q3UH66-3 (1, 2); Q3UH66-4 (1, 2); Q3UH66-5 (1, 2); Q3UH66-6 (1, 2); Q3UH66-7 (1, 2) |
| Wwc1* | Q5SXA9 (1, 1) |
| Xab2 | F6TM12 (1, 1) |
| Xirp2* | Q4U4S6 (2, 2); Q4U4S6-2 (1, 1) |
| Ylpm1 | F6YTL8 (2, 2) |
| Zc3h14* | Q8BJ05 (1, 1); Q8BJ05-2 (1, 1); Q8BJ05-3 (1, 1) |
| Zc3h18 | H3BJJ9 (1, 2) |
| Zfr | D3Z5G4 (2, 5); D3Z7V6 (2, 5) |
| Zgpat* | Q8VDM1 (1, 1) |
| Zhx2* | Q8C0C0 (1, 1) |
| Zmat3* | B9EI21 (1, 1); O54836 (1, 1) |
| Znf598* | Q80YR4 (1, 1); Q80YR4-2 (1, 1); Q80YR4-3 (1, 1) |
| Zswim8* | Q3UHH1 (2, 2); Q3UHH1-2 (2, 2); Q3UHH1-3 (2, 2); Q3UHH1-4 (2, 2) |
Distinct protein isoforms or protein sequences (according to UniProt mouse protein database) are listed individually for each gene, along with corresponding peptide and spectral counts. Gene names with a single asterisk signify genes that are categorized as “HC-only,” meaning that all associated proteins were identified only in the HC sample and not also in the GFP− sample (n = 313). Gene names without asterisks have some HC-only proteins (listed here), but other proteins from the same gene were also identified in the IE and/or SE samples (n = 107). Gene names with double asterisks signify genes categorized as “HC-only” by the enrichment approach (comparing IE, SE, and HC samples), but that were also identified in a “control” set of purified GFP− cells (n = 38). UniProt accession numbers are unique protein identifiers from the UniProt database. Numbers following the UniProt accession numbers signify an entry for a specific isoform.
We next sought to extract “HC-enriched” proteins: those identified across multiple sample types but with likely specificity for HCs because the HC proteome is enriched as HCs increasingly dominate the sample, as demonstrated by increasing eGFP protein abundance (Fig. 2F). Using a conservative criterion for significant enrichment based on rank abundance (see Materials and Methods), we defined 92 HC-enriched proteins (Fig. 2G, Table 2), which include known HC proteins such as otoferlin (Otof), Stard10, Calb1, Myo6, Twf2, and Calb2 (Moser et al., 2006; Peng et al., 2009; Herget et al., 2013). HC-enriched proteins, largely structural/cytoskeletal proteins, drove overrepresentation of several GO biological process categories related to cell development and morphogenesis (Fig. 2H, binomial test with Bonferroni correction: “cellular component morphogenesis”: p = 0.0000; “developmental process”: p = 0.0000; “cellular component organization”: p = 0.0001), none of which were overrepresented among the 35 SE-enriched (SE abundance > average of IE and HC) or 63 HC-depleted (IE abundance > SE > HC) proteins (Fig. 2I,J). We also identified 80 proteins enriched in HCs relative to the SE sample that were not identified in the more complex IE sample (Table 2).
Table 2.
Table of 92 proteins identified in HC, SE and IE samples and 80 proteins identified in HC and SE samples that are enriched in the HC sample (“HC-enriched”) ordered by degree of enrichment (from highest to lowest)
| HC-enriched proteins (HC abundance > SE > IE) | ||
|---|---|---|
| Gene name | UniProt accession no. (no. of peptides mapped, no. of spectral counts) | Percentile rank in IE, SE, HC |
| Otof | D3YXV0 (54, 212) | 0.8, 59.1, 87.9 |
| Otof | Q9ESF1-2 (55, 216) | 0.7, 58.1, 87.9 |
| Otof | Q9ESF1-3 (54, 212) | 0.8, 58.3, 87.8 |
| Otof | E9PYR6 (52, 210) | 0.7, 58.0, 87.6 |
| Otof | Q9ESF1 (52, 210) | 0.7, 58.0, 87.6 |
| Krt6b | Q9Z331 (9, 153) | 11.7, 63.9, 95.8 |
| Krt6a | P50446 (9, 153) | 11.8, 64.4, 95.8 |
| Krt6b | Q3UV11 (9, 153) | 11.8, 64.3, 95.8 |
| Krt76 | Q3UV17 (4, 140) | 11.0, 57.7, 94.8 |
| Krt75 | Q8BGZ7 (4, 143) | 11.9, 61.4, 95.6 |
| Krt4 | P07744 (3, 137) | 12.4, 42.8, 95.6 |
| Stard10 | G3UY59 (6, 15) | 5.7, 58.0, 85.8 |
| Krt14 | Q61781 (15, 90) | 15.5, 39.9, 93.0 |
| Krt5 | Q922U2 (12, 181) | 19.7, 64.0, 96.4 |
| Stard10 | G3UW37 (8, 17) | 3.3, 46.2, 79.9 |
| Stard10 | G3UYM0 (5, 11) | 6.3, 60.1, 82.4 |
| Stard10 | Q9JMD3 (8, 17) | 2.9, 44.3, 77.9 |
| Cacybp | Q9CXW3 (7, 35) | 16.4, 49.4, 91.3 |
| [eGFP] | – (42, 406) | 25.4, 99.0, 100.0 |
| Calb1 | P12658 (18, 105) | 26.0, 89.4, 97.3 |
| Stard10 | E9PVP0 (8, 17) | 2.0, 39.8, 73.3 |
| Cryz | D3Z4Q4 (4, 11) | 13.4, 62.4, 83.6 |
| Cryz | D3Z2X0 (4, 11) | 12.2, 59.7, 82.1 |
| Cryz | D3YWU6 (4, 11) | 19.2, 70.2, 88.4 |
| Gstm5 | E9PV63 (4, 8) | 5.8, 23.6, 74.6 |
| Acbd7 | Q9D258 (4, 29) | 28.2, 85.2, 96.6 |
| Krt79 | Q8VED5 (4, 35) | 12.2, 40.5, 80.3 |
| Krt42 | Q6IFX2 (8, 52) | 20.8, 61.4, 88.5 |
| Krt17 | Q9QWL7 (12, 37) | 17.3, 29.1, 84.4 |
| Pgam2 | O70250 (5, 21) | 18.6, 64.7, 84.2 |
| Psph | Q99LS3 (5, 13) | 12.4, 35.8, 77.6 |
| Krt77 | Q6IFZ6 (6, 51) | 19.9, 54.2, 85.0 |
| Dnaja4 | Q9JMC3 (4, 14) | 1.9, 43.8, 66.6 |
| Krt71 | Q9R0H5 (3, 22) | 9.3, 51.7, 71.0 |
| Hebp2 | Q9WU63 (5, 13) | 18.1, 65.5, 79.6 |
| Myo6 | Q64331 (41, 169) | 30.4, 33.4, 90.2 |
| Ap1m2 | Q9WVP1 (7, 16) | 9.2, 53.7, 68.5 |
| Ap1m2 | Q9WVP1-2 (7, 16) | 9.1, 53.6, 68.3 |
| Krt73 | Q6NXH9 (3, 20) | 8.9, 56.6, 68.1 |
| Arf4 | E9Q2C2 (1, 6) | 26.6, 38.9, 85.8 |
| Rpl15 | Q9CZM2 (3, 9) | 13.5, 47.8, 72.1 |
| Gm10020 | E9QAZ2 (3, 9) | 13.6, 47.9, 72.1 |
| Krt74 | Q6IFZ9 (2, 18) | 9.7, 54.8, 67.4 |
| Ugdh | D3YXP9 (2, 6) | 11.9, 54.5, 68.8 |
| Arf3 | D3YV25 (1, 6) | 32.3, 44.0, 89.2 |
| Twf2 | Q9Z0P5 (13, 35) | 30.1, 75.6, 86.9 |
| Twf2 | Q9Z0P5-2 (13, 35) | 30.2, 75.8, 87.0 |
| Wdr61 | Q8BVQ0 (5, 11) | 13.1, 25.7, 69.6 |
| Sorbs2 | Q3UTJ2-3 (8, 26) | 16.1, 42.6, 72.5 |
| mCG_1288 | V9GWY0 (6, 52) | 38.3, 58.1, 93.5 |
| Cryz | V9GXY8 (5, 12) | 20.9, 65.8, 75.9 |
| Cryz | D3YUG9 (4, 11) | 25.1, 70.9, 79.7 |
| Nutf2 | P61971 (2, 5) | 15.0, 26.8, 69.5 |
| Sorbs2 | Q3UTJ2-4 (8, 26) | 16.5, 41.3, 71.0 |
| Calb2 | Q08331 (17, 51) | 39.8, 68.3, 93.2 |
| Krt10 | P02535 (13, 75) | 37.3, 71.9, 90.1 |
| Ddt | G3UZN1 (3, 12) | 39.5, 72.7, 92.1 |
| Krt10 | A2A513 (13, 75) | 37.7, 72.4, 90.2 |
| Krt10 | P02535-2 (13, 75) | 37.7, 72.4, 90.2 |
| Sorbs2 | B2RXQ9 (7, 24) | 15.9, 40.3, 67.7 |
| Ewsr1 | Q5SUT0 (5, 44) | 30.1, 54.8, 81.7 |
| Eml1 | D6RII3 (2, 14) | 2.1, 4.0, 53.4 |
| Sod1 | P08228 (3, 6) | 18.1, 59.3, 69.3 |
| Sorbs2 | D3Z080 (7, 24) | 14.7, 38.7, 65.5 |
| Sorbs2 | Q3UTJ2-5 (7, 24) | 14.8, 38.8, 65.6 |
| Krt1 | P04104 (8, 27) | 20.7, 47.1, 71.3 |
| Me1 | P06801 (16, 32) | 26.8, 65.7, 76.9 |
| Nme1 | Q5NC79 (2, 4) | 16.1, 40.7, 65.9 |
| Krt10 | P02535-3 (13, 75) | 42.5, 76.3, 91.9 |
| Ewsr1 | Q5SUS9 (6, 45) | 31.4, 53.2, 80.7 |
| Ctbp2 | P56546-2 (10, 22) | 6.7, 12.1, 56.0 |
| Ewsr1 | Q61545 (6, 45) | 31.8, 53.5, 80.9 |
| Eml1 | Q05BC3-2 (2, 14) | 2.0, 3.3, 50.7 |
| Pdk3 | Q922H2 (5, 16) | 20.5, 25.8, 69.1 |
| Lrba | E9Q3Y4 (21, 56) | 4.4, 32.5, 52.9 |
| Ddt | O35215 (5, 15) | 41.1, 82.1, 89.6 |
| BC026585 | Q3UNZ8 (3, 8) | 8.2, 32.7, 56.5 |
| Eml1 | D3Z4J9 (2, 14) | 1.9, 3.2, 50.0 |
| Jup | Q02257 (15, 42) | 29.5, 42.5, 77.1 |
| Krt2 | Q3TTY5 (9, 26) | 20.1, 35.1, 67.7 |
| Eml1 | Q05BC3 (2, 14) | 1.8, 3.1, 49.3 |
| Txnrd1 | Q9JMH6 (17, 63) | 40.0, 67.0, 87.2 |
| Nhlrc2 | Q8BZW8 (7, 14) | 5.3, 36.7, 52.5 |
| Eml1 | Q05BC3-3 (2, 14) | 1.8, 3.0, 48.6 |
| Sorbs2 | Q3UTJ2 (8, 26) | 8.9, 29.3, 55.6 |
| Sorbs2 | B7ZWM6 (8, 26) | 8.7, 28.9, 55.3 |
| Sorbs2 | E9Q0B0 (8, 26) | 8.8, 29.0, 55.3 |
| Pa2g4 | D3YVH7 (5, 16) | 31.9, 45.5, 77.7 |
| Actr3b | Q641P0 (2, 8) | 6.8, 9.5, 52.2 |
| Txnrd1 | Q9JMH6-2 (17, 63) | 44.3, 71.0, 89.5 |
| Lrba | Q9ESE1-3 (17, 44) | 4.1, 31.6, 49.1 |
| Sorbs2 | B9EKP8 (7, 24) | 8.6, 28.7, 53.1 |
| HC-enriched proteins (HC abundance > SE, not identified in IE) | ||
|---|---|---|
| Gene name | UniProt accession no. (no. of peptides mapped, no. of spectral counts) | Percentile rank in SE, HC |
| Pgm2l1 | Q8CAA7 (4, 8) | 14.8, 76.9 |
| Myo7a | P97479 (36, 93) | 36.8, 91.2 |
| Myo7a | P97479-2 (36, 93) | 39.0, 91.8 |
| Myo7a | Q5MJ56 (36, 93) | 39.6, 92.3 |
| Ift122 | Q6NWV3 (3, 4) | 3.8, 49.5 |
| Ift122 | Q6NWV3-2 (3, 4) | 3.3, 48.9 |
| Ift122 | E9Q9G8 (3, 4) | 1.6, 46.7 |
| Tmem201 | A2A8U2-3 (1, 3) | 14.3, 56.6 |
| Tmem201 | A2A8U2 (1, 3) | 13.2, 54.4 |
| Dsp | E9Q557 (26, 68) | 45.1, 85.2 |
| Dsp | E9PZW0 (23, 58) | 48.4, 85.7 |
| Wdr35 | Q8BND3 (3, 3) | 4.4, 38.5 |
| Wdr35 | Q8BND3-2 (3, 3) | 5.5, 39.6 |
| Osbpl3 | D3YTT6 (4, 7) | 37.4, 65.9 |
| Try5 | Q9QUK9 (7, 26) | 70.9, 98.4 |
| Try4 | Q9R0T7 (7, 26) | 71.4, 98.9 |
| Osbpl3 | Q9DBS9 (4, 7) | 40.1, 67.0 |
| Wdr5 | P61965 (3, 5) | 55.5, 80.2 |
| Prss1 | Q9Z1R9 (3, 18) | 72.5, 96.7 |
| Kcna10 | B2RQA1 (1, 2) | 27.5, 51.6 |
| Tmem201 | A2A8U2-2 (1, 3) | 41.8, 65.4 |
| Bloc1s2 | Q9CWG9 (1, 3) | 59.3, 82.4 |
| Dnaja4 | D3Z1U5 (3, 8) | 67.6, 90.1 |
| Try10 | Q792Z1 (2, 12) | 72.0, 94.0 |
| Acss2 | F7CU63 (1, 3) | 50.0, 71.4 |
| Inpp1 | H3BK26 (1, 3) | 65.9, 86.3 |
| Gapdh | S4R1N5 (1, 14) | 80.2, 100.0 |
| Rbm38 | Q62176 (2, 5) | 63.2, 83.0 |
| Wdr54 | Q9R0D8 (2, 4) | 54.9, 74.7 |
| Inpp1 | E0CX64 (1, 3) | 68.7, 87.9 |
| Llgl2 | Q3TJ91 (2, 2) | 8.2, 27.5 |
| Sccpdh | J3QNN5 (1, 2) | 61.5, 80.8 |
| 6030458C11Rik | Q8BGC1 (3, 6) | 58.8, 78.0 |
| Clip1 | F6RAY2 (1, 2) | 54.4, 72.5 |
| Rab3b | Q9CZT8 (1, 5) | 66.5, 84.1 |
| Osbpl3 | F8WH20 (2, 4) | 41.2, 58.2 |
| Tppp | Q7TQD2 (1, 2) | 53.3, 70.3 |
| Spryd3 | E9Q9B3 (2, 2) | 38.5, 54.9 |
| Inpp1 | E0CYQ4 (1, 3) | 73.6, 89.6 |
| Osbpl3 | D3Z194 (2, 4) | 40.7, 56.0 |
| 6030458C11Rik | Q8BGC1-2 (2, 5) | 64.3, 79.7 |
| Cryzl1 | Q921W4 (2, 2) | 46.2, 61.0 |
| Llgl2 | J3QJU5 (2, 2) | 7.7, 22.0 |
| Mlf2 | Q99KX1 (2, 3) | 62.1, 75.8 |
| Ptprq | P0C5E4 (10, 14) | 51.1, 62.1 |
| Ap3m2 | Q8R2R9 (4, 4) | 60.4, 70.9 |
| Fscn2 | Q32M02 (4, 4) | 56.0, 66.5 |
| Stard10 | G3UY87 (6, 14) | 85.7, 94.5 |
| Stard10 | G3V020 (7, 16) | 89.0, 97.8 |
| 2210010C04Rik | Q9CPN9 (1, 9) | 79.7, 88.5 |
| Gm5356 | D3YVS3 (3, 6) | 78.6, 86.8 |
| Rbm38 | G3UWQ8 (1, 4) | 87.9, 95.1 |
| Rbm38 | G3UXN1 (1, 4) | 81.9, 89.0 |
| Hnrnpd | F7A465 (2, 3) | 79.1, 84.6 |
| Atp6v1f | Q9D1K2 (1, 1) | 62.6, 68.1 |
| Cyb5r1 | Q9DB73 (1, 2) | 57.7, 63.2 |
| – | P01786 (1, 1) | 63.7, 68.7 |
| Myo7a | D3YUT5 (1, 1) | 61.0, 64.8 |
| Otol1 | Q4ZJM7 (4, 9) | 78.0, 81.9 |
| Rab3a | P63011 (1, 1) | 52.7, 55.5 |
| Wfs1 | P56695 (1, 1) | 8.8, 11.0 |
| Wfs1 | Q3UN10 (1, 1) | 9.9, 12.1 |
| Avil | O88398 (1, 1) | 9.3, 11.5 |
| Gle1 | Q8R322 (1, 1) | 12.6, 14.8 |
| Lsm6 | P62313 (2, 7) | 95.1, 97.3 |
| Ivns1abp | Q920Q8 (1, 1) | 13.7, 15.9 |
| Myo7a | F6ZLJ0 (1, 1) | 52.2, 53.8 |
| Stard10 | G3UZB9 (2, 6) | 97.8, 99.5 |
| Ctr9 | Q62018-2 (2, 3) | 51.6, 52.7 |
| Gnpda2 | D6RCJ1 (1, 2) | 89.6, 90.7 |
| Ehmt2 | Q9Z148 (1, 1) | 1.1, 2.2 |
| Ivns1abp | Q920Q8-3 (1, 1) | 15.4, 16.5 |
| Ivns1abp | Q920Q8-4 (1, 1) | 15.9, 17.0 |
| Madd | A2AGQ4 (2, 3) | 17.0, 18.1 |
| Madd | E9QN47 (2, 3) | 17.6, 18.7 |
| Madd | U28-14 (2, 3) | 18.1, 19.2 |
| Rfx3 | P48381 (1, 1) | 12.1, 12.6 |
| Fryl | F8VQ05 (2, 2) | 0.5, 1.1 |
| Ehmt2 | A2CG76 (1, 1) | 2.2, 2.7 |
| Ehmt2 | Q9Z148-3 (1, 1) | 2.7, 3.3 |
Distinct protein isoforms or protein sequences (according to UniProt mouse protein database) are listed individually, so gene names may be listed more than once. UniProt accession numbers are unique protein identifiers from the UniProt database. Numbers following the UniProt accession numbers signify an entry for a specific isoform. Percentile rank is the percentile of a given rank abundance (based on NSAF) within a particular sample. EGFP was added to the search database manually and has no associated UniProt accession number. A dash (–) in the gene name columns signifies a protein without a gene name.
Unbiased survey of HC proteins with MS yields novel and isoform-specific HC gene products
The ∼12,000 identified IE proteins represent thousands of genes, including hundreds of genes with products identified only the HC sample (“HC-only” genes). The 934 HC-only proteins (Fig. 2D) map to 458 genes; however, 351 of these genes are considered “HC-only” because all associated proteins identified by MS were identified only in the HC sample (Table 1, single asterisks), whereas other genes among the 458 have at least one protein form identified only in the HC sample and another form identified in a different sample. We compared the resulting gene products identified by our MS approach with recent cochlear and utricular RNA-sequencing (RNA-seq) analysis performed by Scheffer et al. (2015), in which the investigators FACS purified GFP+ HCs from the same Pou4f3/eGFP mouse line used in the current study and examined differential gene expression in pooled HCs versus pooled GFP− supporting cells (Scheffer et al., 2015; Fig. 3A). To facilitate protein versus transcript comparisons, we mapped our proteomic data to MGI gene identifiers (genes quantified in Figure 3B) and used only transcriptome data from matched ages (P4 and P7) (Fig. 3A). Whereas Scheffer et al. (2015) examined differential gene product expression between GFP+ and GFP− cell populations, we performed progressive enrichment for GFP+ cells by comparing IE, SE, and HC samples. Therefore, to provide a more direct comparison between the two studies, we first compared overlap of gene products between GFP+ and GFP− cells in each study (Fig. 3C). We reanalyzed the RNA-seq data and found that 2.9% of the genes were found exclusively in the GFP+ dataset (Fig. 3C, left). In contrast, the MS results showed that 40.3% of the identified genes were found only in the GFP+ dataset (Fig. 3C, right, top). We then compared our “HC-only” genes that were identified based on enrichment for HC proteins/genes by comparing IE, SE, and HC datasets with those found in the GFP− MS results. As the overlap of genes in the MS “HC-only” and GFP− datasets is minimal, our HC-only gene population is relatively unchanged: 89.2% of the HC-only genes identified by the enrichment strategy are also identified as “HC-only” by the GFP+ versus GFP− comparison (Fig. 3C, right, bottom). Importantly, MS analysis of GFP− cell extracts failed to identify any eGFP peptides, which shows that these cell extracts have very little or no HC contamination.
Figure 3.
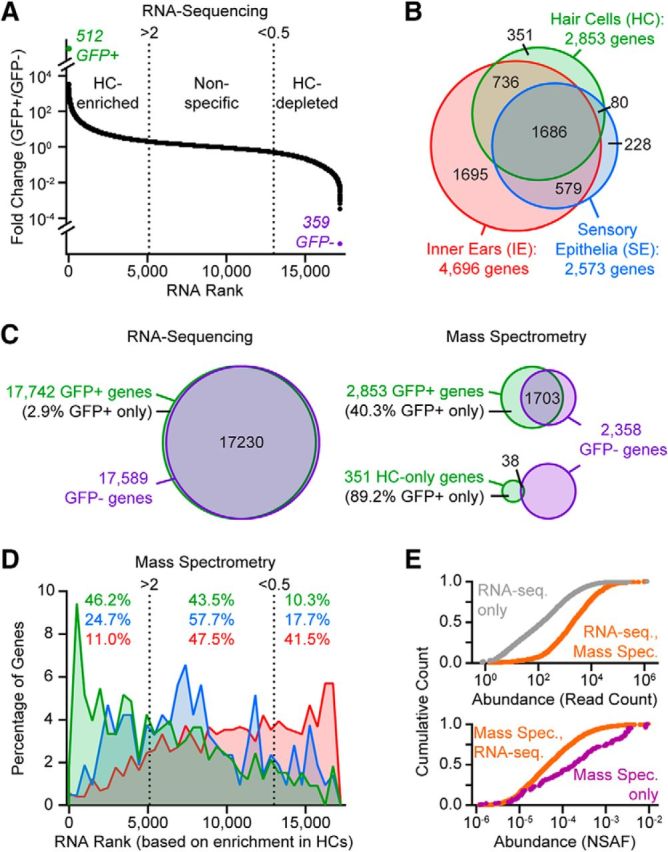
IE gene identification through proteomics extends the transcriptome. A, Transcriptomic data from Scheffer et al. (2015), where fold change GFP+/GFP− represents differential gene expression levels between HCs and supporting cells, respectively. Data from P4–P7 samples are replotted using quality criterion (read counts > 15) and definitions for “HC-enriched” (fold change > 2) or “HC-depleted” (supporting-cell enriched, fold change < 0.5) defined by Scheffer et al. (2015). Transcripts identified either only in GFP+ (n = 512) or only in GFP− (n = 359) samples are indicated with green and purple text, respectively. B, Numbers of genes identified across samples through MS analysis (proteins mapped to genes using Mouse Genome Informatics IDs). C, Venn diagrams showing the overlap of genes identified in GFP+ and GFP− cell populations for both the Scheffer et al. (2015) RNA-Seq (left) and MS (right, top) analyses. Genes identified as “HC-only” through progressive HC enrichment and MS analysis have minimal overlap with genes identified by MS in GFP− cells (right, bottom). D, Mapping of HC-, SE-, and IE-only proteomic-derived genes (from B) to mRNA rank, where higher rank indicates more highly expressed in HCs compared with supporting cells (from A). Percentage of HC-, SE-, and IE-only genes in each transcriptomic-derived category (“HC-enriched,” “nonspecific,” and “HC-depleted”) are shown in green, blue and red, respectively. E, Cumulative counts of gene products (expressed as a proportion of total) versus abundance. HC gene products detected by RNA-seq only (top, gray) versus HC gene products detected by both RNA-seq and MS (top, orange), where abundance is transcript read count. HC gene products detected by MS only (bottom, purple) versus HC gene products detected by both RNA-seq and MS (bottom, orange), where abundance is normalized spectral abundance factor (NSAF). Within each set of distributions, distributions are significantly different (Kolmogorov–Smirnov test: p = 0.0000 for top and bottom panels).
We then related our “singleton” genes (those with gene products identified only in IE or SE or HC samples) to gene expression enrichment categories defined by transcriptomic data to test the idea that a HC-only protein corresponds to an mRNA transcript defined as “HC-enriched” by differential gene expression (GFP+/GFP− > 2). We arranged our proteomic-derived genes according to corresponding mRNA rank abundance (Fig. 3D) and, as expected, a large fraction of the 351 HC-only genes (46.2%) were highly enriched in HCs as shown by both proteomic and transcriptomic approaches. Complementing this result, genes encoding IE-only proteins were enriched in the transcriptomic-defined “HC-depleted” category (GFP+/GFP− < 0.5).
Our FACS purification of HCs yielded enrichment of HC gene products that was in many ways similar to previous mRNA studies. However, the abundance levels of HC transcripts versus proteins were not tightly linked. Compared with HC gene products identified by both approaches, HC gene products identified only by RNA-seq tended to have lower abundance (Fig. 3E, top), whereas HC gene products identified only by proteomics tended to have higher abundance (Fig. 3E, bottom). Within each comparison, the abundance distributions were significantly different (Kolmogorov–Smirnov test: p = 0.0000 for top and bottom panels).
We next examined unique peptides identified only in the HC sample (and not in the GFP− sample) that reveal expression of known and novel HC-specific protein isoforms, which are not always accessible in transcriptome analysis (Table 3). Among these peptides, five map uniquely to the ribeye domain of C-terminal binding protein 2 (Ctbp2) isoform-2 (Fig. 4A), a component of specialized presynaptic ribbons found at HC synapses (Khimich et al., 2005), which is distinct from the more widely expressed, nuclear-localized isoform-1 (Verger et al., 2006). We also repeatedly observed one peptide uniquely mapping to isoform-2 of the HC protein Otof (Fig. 4B), a protein that is critical for normal synaptic exocytosis (Roux et al., 2006). In addition, we identified the canonical isoform-1 of DNA methyltransferase 1 (Dnmt1) (Fig. 4C), based on a HC-only peptide mapped to the domain that distinguishes isoform-1 from isoform-2.
Table 3.
List of 38 HC-only protein isoforms identified based on unique peptide sequences and identified only in the GFP+ sample in alphabetical order
| Gene name | UniProt accession no. (no. of peptides mapped, no. of spectral counts) | No. of Swiss-Prot isoforms in UniProt reference proteome |
|---|---|---|
| Aak1 | Q3UHJ0-1 (1, 1) | 2 |
| Adk | P55264-1 (1, 2) | 2 |
| Atl3 | Q91YH5-1 (1, 3) | 2 |
| Copg2 | Q9QXK3-1 (7, 18) | 4 |
| Ctbp2 | P56546-2 (10, 22) | 2 |
| Cyb5d2 | Q5SSH8-1 (1, 1) | 2 |
| Dnaaf2 | Q8BPI1-1 (1, 1) | 2 |
| Dnmt1 | P13864-1 (1, 1) | 2 |
| Dync2h1 | Q45VK7-2 (26, 35) | 3 |
| Gak | Q99KY4-1 (1, 1) | 2 |
| Gnl1 | P36916-1 (2, 7) | 2 |
| Gtf3c1 | Q8K284-1 (6, 9) | 3 |
| Hmga1 | P17095-1 (1, 1) | 2 |
| Ift172 | Q6VH22-1 (1, 1) | 2 |
| Ints9 | Q8K114-1 (2, 2) | 2 |
| Lima1 | Q9ERG0-1 (5, 12) | 2 |
| Mbd2 | Q9Z2E1-1 (2, 2) | 2 |
| Metap1d | Q9CPW9-1 (1, 1) | 2 |
| Naca | P70670-1 (16, 36) | 2 |
| Ogt | Q8CGY8-1 (3, 3) | 2 |
| Otof | Q9ESF1-2 (55, 214) | 3 |
| Pawr | Q925B0-1 (1, 2) | 2 |
| Pcbp2 | Q61990-2 (7, 21) | 3 |
| Pgam5 | Q8BX10-1 (1, 2) | 2 |
| Pspc1 | Q8R326-1 (4, 7) | 2 |
| Rufy3 | Q9D394-2 (2, 2) | 4 |
| Scai | Q8C8N2-1 (1, 1) | 2 |
| Sorbs1 | Q62417-1 (3, 3) | 7 |
| Srek1 | Q8BZX4-2 (3, 10) | 2 |
| Strbp | Q91WM1-1 (8, 12) | 2 |
| Synj2bp | Q9D6K5-1 (1, 2) | 4 |
| Tom1 | O88746-1 (8, 14) | 2 |
| Tor1aip1 | Q921T2-1 (2, 3) | 3 |
| Tor1aip2 | Q8BYU6-1 (1, 2) | 2 |
| Trappc11 | B2RXC1-1 (1, 1) | 2 |
| Txndc11 | Q8K2W3-1 (1, 1) | 2 |
| Vwa8 | Q8CC88-1 (4, 6) | 3 |
| Xirp2 | Q4U4S6-1 (2, 2) | 2 |
UniProt accession numbers are unique protein identifiers from the UniProt database. Numbers following the UniProt accession numbers signify an entry for a specific isoform.
Figure 4.
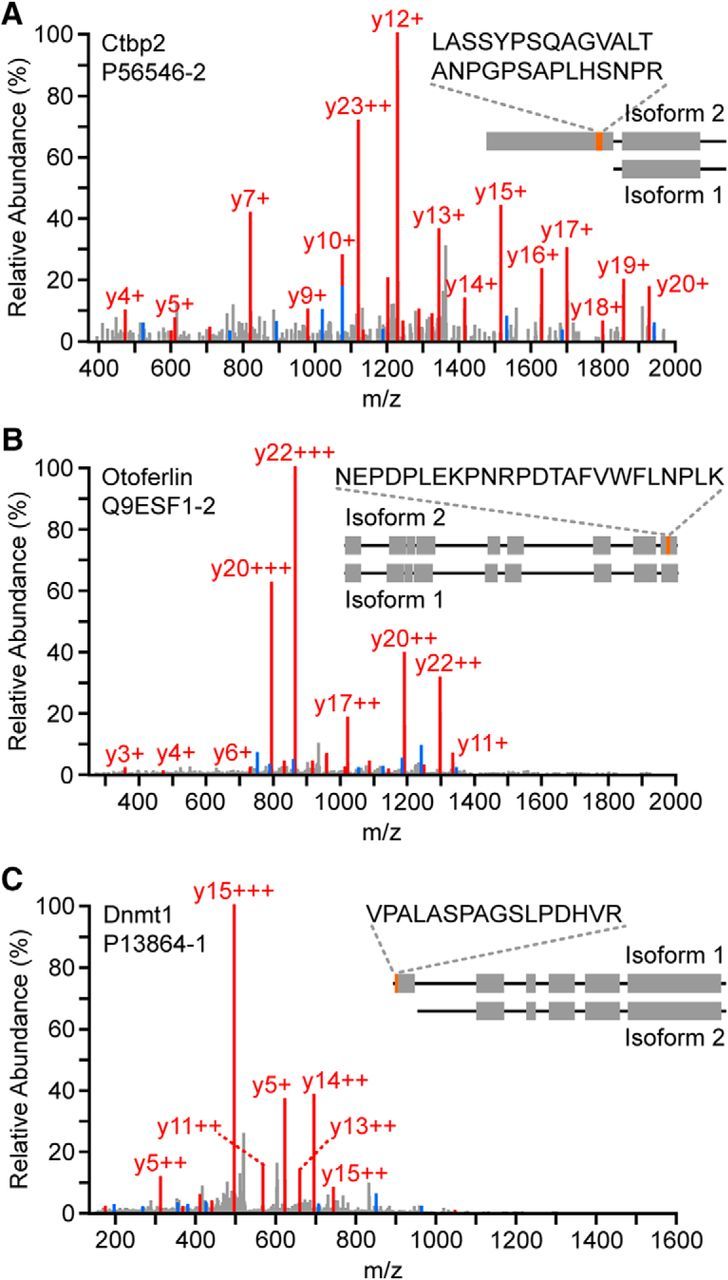
Representative tandem mass spectra acquired from the HC sample that uniquely map to the indicated HC-only isoforms. A, Isoform 2 of C-terminal binding protein 2 (Ctbp2), an integral component of HC presynaptic ribbons. B, Isoform 2 of otoferlin, a protein critical for HC synaptic exocytosis. C, Isoform 1 of DNA methyltransferase 1, a potentially novel hair cell protein. Y-ions are shown in red and b-ions in blue. Peaks are normalized to highest peak amplitude. Protein name and UniProt accession number are indicated in upper left corners. Protein domains of each isoform are schematized with gray bars and peptide sequence identified by MS is indicated in orange.
Validation of HC proteins derived from HC proteomic analysis
We selected several proteins for validation of HC-specific expression by immunolabeling, based on criteria such as novelty to specific tissue type, novelty to IE, and/or candidacy for deafness genes. Several peptide sequences for Pak3 (serine/threonine-protein kinase PAK 3) were identified as HC-only (Table 1). We validated vestibular expression of Pak3 via immunolabeling of utricular whole mounts and observed highly specific expression in the HC cuticular plate region (Fig. 5A), consistent with the reported role for PAKs in development of stereocilia bundles in the cochlea (Grimsley-Myers et al., 2009). Neuroligin-3 (Nlgn3), a glutamatergic and GABAergic synaptic adhesion protein (Budreck and Scheiffele, 2007), was identified as an HC-only protein (Table 1) and, when mutated, can result in impaired auditory/vestibular phenotypes in mice (Chadman et al., 2008). We observed punctate expression of Nlgn3 at the base of cochlear inner and outer HCs (Fig. 5B), areas served by both afferent and efferent innervation that use a variety of neurotransmitters (Goutman et al., 2015). Zinc finger protein castor homolog 1 (Casz1), four-jointed box protein 1 (Fjx1), and cilia- and flagella-associated protein 36 (Cfap36, alias Ccdc104) were all identified as HC-only proteins of potential novel deafness genes (described below). We observed specific cytoplasmic labeling of Casz1 in vestibular and cochlear HCs (Fig. 5C), consistent with previous evidence for HC specificity at the transcript level (Cai et al., 2015). We also found Fjx1 expression in cochlear HC stereocilia (Fig. 5D) and Cfap36 expression in kinocilia and/or basal bodies in developing cochlear HCs (Fig. 5E).
Figure 5.
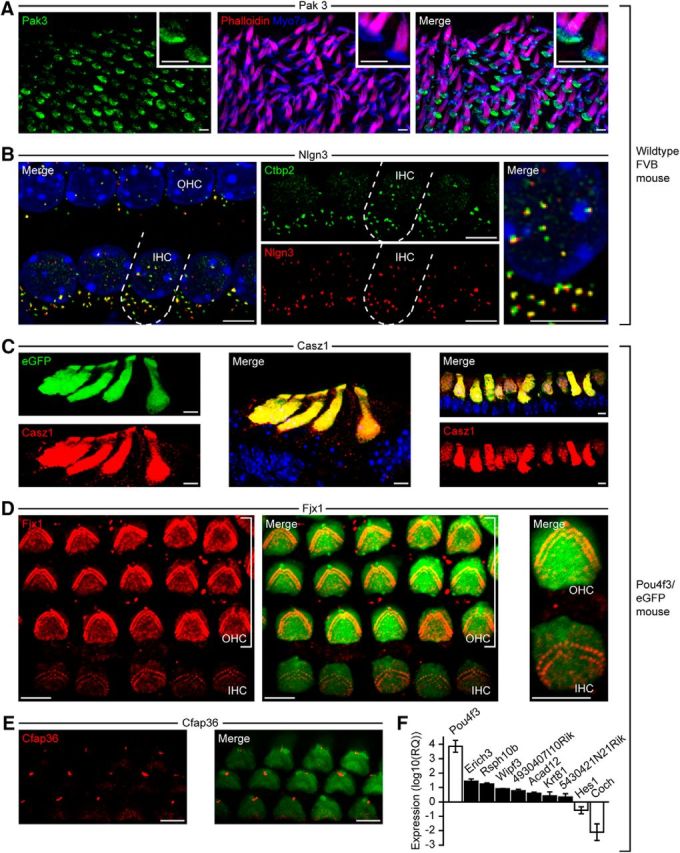
Validation of HC protein and transcript expression in cochlear and vestibular structures. A, Pak3 localizes to the HC cuticular plate region (P8 utricle; green: Pak3; red: phalloidin; blue: Myo7a). Inset, Detail of two HC apical surfaces and stereocilia bundles. B, Nlgn3 localizes to HC basolateral membranes near synaptic ribbons (P6 cochlea; green: Ctbp2; red: Nlgn3; blue: DAPI). Far right, Detail of inner HC outlined on left and middle panels. C, Casz1 colocalizes with HC-specific GFP expression in both cochlear (P4, left and middle) and vestibular (P4, right) tissue (green: eGFP; red: Casz1; blue: DAPI). D, Fjx1 localizes to the base of stereocilia in inner and outer HCs (P4 cochlea; green: eGFP; red: Fjx1). Far right, Detail of two HC apical surfaces. E, Cfap36 shows labeling in the kinocilia/basal body region of developing HCs (P4 cochlea; green: eGFP; red: Cfap36). F, Gene expression levels of target genes in FACS-purified GFP+ HCs relative to expression in GFP− supporting cells [qRT-PCR results shown as log10(RQ)]. Black bars, Target genes for validation of HC-specific or HC-enriched expression; white bars, target genes for positive (left) and negative (right) controls for HC-specific expression. Data in A and B are from wild-type FVB mice; data in C–F are from Pou4f3/eGFP mice. Scale bars, 5 μm.
Because multiple HC-only proteins identified by MS were not reported previously in HCs by P4–P7 RNA-seq analysis (Fig. 3D, bottom, purple), we used qRT-PCR to validate HC-specific or HC-enriched gene expression for several of these corresponding genes (Fig. 5F): Erich3 (“BC007180”), Rsph10b, Wipf3, 4930407I10Rik, Acad12, Krt81, and 5430421N21Rik.
Mutation-driven auditory/vestibular impairments arise preferentially from HC genes products
Hearing loss or vestibular impairment can arise from damage or mutations across different IE cell types; however, we hypothesized that changes in HCs are more likely to produce a measurable phenotype. To test this possibility, we compiled phenotype–genotype associations from the MGD (Eppig et al., 2015) from transgenic mouse assays related to IE structure and function and examined the distribution of these genes across our datasets. Genes related to transgenic mouse hearing/balance behavioral deficits, such as Espn, Grxcr1, and Tomt, were significantly overrepresented by gene products in the HC-only sample compared with IE- or SE-only samples (Fig. 6A) when referenced to the total number of genes found in each of these groups (Fig. 3B; Fisher's exact test, p = 0.0014). Similarly, HC-only genes related to aberrant IE physiology and to overall impaired hearing in transgenic mice, such as Ocm, Slc26a5, and Strc, were significantly overrepresented (Fisher's exact test, p = 0.0019 and p = 0.0015, respectively). In contrast, genes related to impaired eye physiology (used as a negative control), such as Bbs4, were not statistically overrepresented in the HC-only group (Fisher's exact test, p = 0.8127). Overall, proteins associated with impaired hearing/balance phenotypes are relatively more likely to derive from HCs based on their enrichment in the HC sample compared with IE or SE samples.
Figure 6.

Proteins enriched in HCs are strongly associated with genetic hearing/balance impairment. A, Distribution of identified genes associated with IE impairment in transgenic mice reveals a disproportionately high number of genes in the HC-only subgroup compared with SE- or IE-only subgroups relative to the total number of genes found in each subgroup (see Fig. 3B). Fisher's exact test, p = 0.0014. B, Transcriptomic data from P4–P7 GFP+ HCs from Scheffer et al. (2015), where fold change Coch/Utr represents differential gene expression levels between cochlear and utricular HCs. Number of transcripts identified only in cochlear or utricular samples are indicated with green and purple labels, respectively. C, Mapping of HC-only proteomic-derived genes (see Fig. 3B) to mRNA rank, where higher rank indicates more highly expressed in cochlear compared with utricular HCs (from B). D, Distribution of identified genes orthologous to human deafness genes reveals a disproportionately high number of genes in the HC-only subgroup compared with SE- or IE-only subgroups relative to the total number of genes found in each subgroup (see Fig. 3B). Fisher's exact test, p = 0.0024. E, Protein identification summary across organ of Corti replicates. Filled black circles indicate rank-ordered abundance of proteins identified in the replicate with the largest number of total proteins identified. The number of replicates in which a given protein was identified is indicated by the color of the line connecting the circle to the abscissa (white, purple, or orange for one, two, or three replicates, respectively). Bar plot (inset) summarizes number of proteins identified in one, two, or three replicates. Mouse orthologs of human deafness genes identified in additional organ of Corti replicates, but not identified in samples in D, are indicated with gray circles. For D and E, genes for nonsyndromic deafness are shown in bold, nonsyndromic and syndromic in bold italic, and syndromic in plain text.
Based on these results, we identified several HC-only genes, previously undercharacterized in the mammalian ear, as potential novel sources of mouse auditory/vestibular deficits when mutated, signifying gene products potentially uniquely important for HC function. HC-only genes Evl, Otud7b, and Pex5l were associated with Mammalian Phenotype (MP) “decreased startle reflex” (MP:0001489); Nlgn3 was associated with “decreased startle reflex” and “altered righting response” (MP:0002862); and Shank2 and Ugcg were associated with “impaired righting response” (MP:0001523). Although the HC sample comprises more vestibular than cochlear HCs, the group of 351 HC-only genes (Fig. 3B) is not preferentially enriched for vestibular-HC-specific genes when compared with differential expression of cochlear versus utricular HC transcripts (Scheffer et al., 2015) (cf. Fig. 6B,C), suggesting that these HC-only genes are equally likely to play roles in audition and/or balance.
More directly related to human health, we examined the distribution of known human deafness genes identified by MS. Deafness gene orthologs found with our proteomic approach were significantly overrepresented in the HC-only group compared with the SE and IE groups (Fig. 6D) when referenced to the total number of genes found in each of these groups (Fig. 3B; Fisher's exact test, p = 0.0024), representing genes with products enriched in or exclusive to HCs, including: HC differentiation transcription factor Pou4f3, outer HC somatic motility protein Slc26a5, and stereocilia proteins Myo3a, Grxcr1, Grxcr2, Espn, and Strc (Erkman et al., 1996; Schneider et al., 2006; Sekerková et al., 2006; Verpy et al., 2008; Peng et al., 2011; Takahashi et al., 2016). Other examples of deafness genes known to be enriched in or specific to HCs were found in all sample types, indicating a relatively high protein abundance in HCs to be accessible by MS in analyzing the more complex SE and IE samples, including: Serpinb6, Actg1, Gipc3, Rdx, Myo6, and Otof (Fig. 6D) (Avraham et al., 1997; Kitajiri et al., 2004; Roux et al., 2006; Sirmaci et al., 2010; Vona et al., 2015). Additional deafness gene products were identified in organ of Corti replicates (Fig. 6E), including genes with known HC-specific expression (Yoon et al., 2011).
Because of the significant enrichment for deafness-related genes in the HC-only group and the fact that the proportion of deafness genes identified in GFP+ HCs through proteomics (37 of 2853 genes, 1.30%) is double that identified in age-matched transcriptomic data (Scheffer et al., 2015) (117 of 17,742 genes, 0.66%), we thus sought to identify potential novel deafness genes by mapping our GFP+ only, HC-only genes (Fig. 3C, right, bottom) to deafness loci with unknown causative genes. We found 30 such gene products that potentially underlie 19 documented forms of nonsyndromic deafness in humans (Fig. 7, Table 4). At least two of these genes have recently been proposed as possible deafness genes (e.g., Mrpl9 and Mrps11; Sylvester et al., 2004). However, the majority of these candidate deafness genes are proposed for the first time here based on our HC-only proteomic data. HC and HC-stereocilia expression of several candidate deafness genes (Casz1, Fjx1, and Cfap36) (Fig. 5C–E) supports their putative roles in HC function and, ultimately, when mutated, potential roles as sources of human deafness.
Figure 7.

Thirty candidate genes uniquely found in HCs map to 19 loci of nonsyndromic, recessive, or dominant human hearing impairment. Deafness loci within respective chromosomes are indicated in purple or, where overlapping with another locus, in hatched orange. Deafness loci names are given in purple or orange above the names of candidate deafness genes residing within the loci.
Table 4.
Candidate deafness genes identified uniquely in the GFP+ HC sample
| Human deafness locus/loci (chromosomal position) | Human gene location | Mouse gene name | UniProt accession no. | Description |
|---|---|---|---|---|
| DFNA7 (1q21-q23) DFNA49 (1q21-q23) | 1q21.2 | Otud7b | B2RUR8 | OTU domain containing 7B |
| 1q21.2 | Plekho1(2) | F6XQM2 | Pleckstrin homology domain containing, family O member 1 | |
| 1q21.2 | Tars2 | Q3TP97 | Threonyl-tRNA synthetase 2, mitochondrial (putative) | |
| 1q21.3 | Fam63a | Q76LS9 | Family with sequence similarity 63, member A | |
| 1q21.3 | Mrpl9(1) | Q99N94 | Mitochondrial ribosomal protein L9 | |
| 1q23.3 | Ppox | P51175 | Protoporphyrinogen oxidase | |
| 1q23.3 | Sdhc | D3Z1A8 | Succinate dehydrogenase complex, subunit C, integral membrane protein | |
| 1q23.3 | Fcrlb | Q5DRQ8 | Fc receptor-like B | |
| DFNA16 (2q23-q24.3) DFNB27 (2q23-q31) | 2q24.1 | Pkp4 | A2AS47 | Plakophilin 4 |
| DFNA24 (4q35-qter) | 4q35.1 | Trappc11 | B2RXC1 | Trafficking protein particle complex 11 |
| DFNA30 (15q25-q26) | 15q25.3 | Mrps11(1) | Q3U8Y1 | Mitochondrial ribosomal protein S11 |
| DFNA31 (6p21.3) | 6p21.31 | Uqcc2 | D3Z4D6 | Ubiquinol-cytochrome c reductase complex assembly factor 2 |
| 6p21.31 | Tcp11 | B2KF24 | T-complex protein 11 | |
| DFNA33 (13q34) | 13q34 | Adprhl1 | Q8BGK2 | ADP-ribosylhydrolase like 1 |
| DFNA53 (14q11.2-q12) | 14q11.2 | Chd8 | Q09XV5 | Chromodomain helicase DNA binding protein 8 |
| DFNA53 (14q11.2-q12) DFNB5 (14q12) | 14q12 | Tgm1(2) | Q9JLF6 | Transglutaminase 1, K polypeptide |
| 14q12 | Nfatc4 | Q8K120 | Nuclear factor of activated T cells, cytoplasmic, calcineurin dependent 4 | |
| DFNA58 (2p21-p12) | 2p16.2 | Asb3 | A8Y5I6 | Ankyrin repeat and SOCS box-containing 3 |
| 2p16.1 | Cfap36 | Q8C6E0 | Cilia and flagella associated protein 36 | |
| 2p14 | Lgalsl | Q8VED9 | Lectin, galactoside binding-like | |
| 2p14 | Aftph | H3BJH7 | Aftiphilin | |
| DFNA59 (11p14.2-q12.3) DFNB51 (11p13-p12) | 11p13 | Fjx1 | Q8BQB4 | Four jointed box 1 (Drosophila) |
| DFNB13 (7q34-q36) | 7q34 | D630045J12Rik | F7ATU7 | RIKEN cDNA D630045J12 gene |
| 7q34 | E330009J07Rik | Q3UHG7 | RIKEN cDNA E330009J07 gene | |
| 7q36.3 | Rbm33 | D3Z5I9 | RNA binding motif protein 33 | |
| DFNB38 (6q26-q27) | 6q27 | Mpc1 | D3Z786 | Mitochondrial pyruvate carrier 1 |
| DFNB45 (1q43-q44) | 1q44 | Ahctf1 | F6SJR1 | AT hook containing transcription factor 1 |
| DFNB46 (18p11.32-p11.31) | 18p11.31 | Lpin2 | Q99PI5 | Lipin 2 |
| DFNB85 (17p12-q11.2) | 17q11.2 | Poldip2 | F6SQH7 | Polymerase (DNA-directed), delta interacting protein 2 |
| DFNB96 (1p36.31-p36.13) | 1p36.22 | Casz1 | Q9CWL2 | Castor zinc finger 1 |
Human nonsyndromic deafness loci with unknown causative genes, along with their chromosomal locations, were compiled from the Hereditary Hearing Loss Homepage and from OMIM. Human gene location is the chromosomal site of human ortholog (GRCh38.p3 human assembly, Ensembl). For genes with more than one protein found in the HC sample, the UniProt accession number represents the protein with the highest abundance (based on NSAF). Descriptions are from the Mouse Genome Database. Genes previously suggested as candidate deafness genes are from Sylvester et al. (2004); genes with proteins previously reported to be enriched in mouse stereocilia bundles are from Krey et al. (2015).
Discussion
The senses of hearing and balance each rely on specialized sensory HCs in the IE that respond to sound, acceleration, and orientation and faithfully convey these signals to afferent sensory fibers of the eighth cranial nerve. Both acute and life-long accumulation of damage to the protein machinery of HCs, including the stereocilia transduction apparatus, presynaptic signaling complexes, and intracellular mechanisms for supporting highly metabolically active processes, can result in significant auditory or vestibular impairment. Genetic bases for hearing loss are continually being discovered with the maturation of high-throughput genomic approaches, although many documented but poorly understood forms of hereditary deafness remain uncharacterized (Vona et al., 2015). The molecular bases of acquired hearing loss, such as through overexposure to noise or through ototoxins, are similarly poorly understood and an area of active research, and many HC-specific genes and gene products likely remain to be identified. Because HCs are necessary for auditory and vestibular sensation, a thorough understanding of HC gene expression at the proteomic level is critical to clarifying normal and aberrant HC structure and function (Ebrahim et al., 2016), sources of dysfunction in hereditary deafness, and developing potential therapeutic treatments (Alagramam et al., 2016).
Here, we used HC reporter mice to produce a population of FACS-purified cochlear and vestibular HCs, as well as the SE, whole IEs, and GFP− control cells to define the most complete IE hair cell proteome to date. Although we have used multiple strategies to minimize the number of proteins incorrectly assigned to being expressed in HCs, there is no way to be completely confident that our datasets lack false-positives. However, we hope that our results can provide a strategic starting point for other investigators to build on. Previous MS-based investigations of IE tissues have produced excellent proteomic characterization of chicken SE (Spinelli et al., 2012), as well as chicken and mouse vestibular HCs and stereocilia bundles (Shin et al., 2013; Krey et al., 2015) or mouse organ of Corti (Peng et al., 2012; Darville and Sokolowski, 2013). We analyzed several tiers of mammalian IE tissue with progressive enrichment for HCs to generate, not only whole-ear and SE proteomes, but ultimately a characterization of the mammalian cochlear/vestibular HC proteome defined by proteins unique to or specifically enriched in HCs. Overall, we identified thousands of proteins expressed in HCs, hundreds of which were uniquely expressed or highly enriched in HCs. However, it is important to point out that this description of the IE proteome is far from complete and many important proteins remain to be identified. This is due to several factors, including very low abundances of many proteins, potentially poor extraction of multipass transmembrane proteins, proteins with amino acid sequences lacking the appropriately sized tryptic peptide fragments, and the absence of protein amino acid sequences in the reference protein database. Our description also lacks any mention of the posttranslational modifications that decorate nearly all IE proteins. Proteomic MS also admittedly is much less sensitive than RNA-seq-based analyses. However, proteomic analysis in combination with RNA-seq-based analysis are together beginning to determine the comprehensive gene and protein expression of all IE cell types.
We found strong correspondence between proteins unique to HCs identified by MS and genes highly differentially expressed in HCs compared with supporting cells identified by RNA-seq (data from Scheffer et al., 2015) and additionally found many HC gene products not previously identified in this transcriptome. Several of these newly identified HC gene products are based on observations of peptides with as few as one to three spectral counts, indicating a high level of sensitivity in the MS-based approach for assessing low abundance proteins. This suggests that, although we cannot rule out a small degree of contamination in our HC sample by proteins from adjacent cell types, it is highly likely that low-abundance proteins in our HC dataset are truly associated with HCs. Among the 170 genes identified only through MS-based gene-product identification (corresponding to 250 gene products; Fig. 3E, bottom, purple), one-third code for histones or structural proteins. This suggests that one reason for detection of gene products by MS but not by RNA-seq may be identification of long-lived proteins (Savas et al., 2012; Zhang et al., 2012) of high abundance that may not require high mRNA levels to maintain protein abundance (Liu et al., 2016). Together, these comparisons reflect the complex nature of transcript–protein expression relationships and demonstrate the contribution of proteomic characterization to fuller understanding of specialized cell populations such as HCs.
Key HC proteins can have distinct localization and roles within the sensory receptor cell related to expression of different isoforms (Ebrahim et al., 2016), underscoring the importance of understanding splice variant expression within HCs. With our combined approach of analyzing purified HCs with high-resolution MS, the resulting HC proteome provides isoform-specific information of gene expression. Among the specific HC protein isoforms that we identified (Table 3) is the synaptic ribbon-associated form of Ctbp2 known to be expressed in HCs, suggesting that other HC isoforms in this subgroup may have specific roles in these sensory cells. For example, we identified isoform 2 of the HC protein otoferlin based on several observations of a unique peptide sequence (Fig. 4B). This peptide sequence partially overlaps an alternative sequence near the transmembrane domain, where several documented missense mutations and deletions reside (Pangršič et al., 2012). This particular isoform may contribute to the unique characteristics of IE afferent synapses, which are characterized by rapid release of neurotransmitter (Jung et al., 2015). We also identified the canonical isoform 1 of Dnmt1, a protein with a role in the IE that is not yet characterized. Mutations in DNMT1 are virtually always associated with progressive hearing loss in two related neurodegenerative diseases: hereditary sensory autonomic neuropathy with dementia and hearing loss and cerebellar ataxia, deafness, and narcolepsy (Baets et al., 2015). Our results suggest for the first time that at least one specific isoform of Dnmt1 exists in HCs and that the frequently observed hearing loss in these syndromes may have cochlear as well as neural origins.
Toward an understanding of the functional relevance of HC-specific proteins to auditory and vestibular function, we examined HC proteins in the context of genes that, when mutated, are known to lead to impaired hearing or balance in mice (through the Mouse Genome Informatics database) or in humans (through compilation of known deafness genes). In each case, we found that genes implicated in aberrant IE function were overrepresented in the proteomic-derived dataset of genes identified only in HCs compared with predictions based on the total number of HC-only genes. Although this is not surprising, it does suggest that the pool of HC-only proteins may provide a resource for discovery of novel proteins critical for normal audition and balance. We localized one such protein, Nlgn3, to the base of cochlear HCs at presumed glutamatergic synapses (based on colocalization with anti-Ctbp2-labeled synaptic ribbons; Fig. 5B). Conventionally, a postsynaptic adhesion protein, the identification of Nlgn3 in the HC sample could reflect the unintended capture of synaptic boutons attached to the HC basolateral membrane. Alternatively, it is possible that Nlgn3 may be expressed in the HC membrane, postsynaptic to GABAergic innervation from medial olivocochlear efferent fibers that transiently innervate inner HCs during development (Wedemeyer et al., 2013). In either case, we suggest that Nlgn3, largely studied for its putative role in autism, may play a previously unappreciated role at HC synapses that potentially underlies auditory and vestibular behavioral anomalies reported as a consequence of a Nlgn3 point mutation (Chadman et al., 2008). We further propose a significant role for many HC proteins in human hearing through association with deafness loci. By mapping our HC-only, GFP+ only genes to corresponding human genes and chromosomal locations, we propose 30 genes as candidates for sources of hereditary nonsyndromic deafness. We confirmed expression of three candidates in cochlear HCs: expression of Casz1 in HC cytoplasm (Fig. 5C), as well as localization of Fjx1 and Cfap36 to HC stereocilia (Fig. 5D,E), a necessary structure for HC function that is often the site of perturbation in genetic deafness. Together, our results suggest that HC proteomic data, in particular the HC-only dataset, provide an opportunity to use cell-specific expression patterns to reveal potential deafness genes.
In summary, by combining HC reporter mice, FACS, and semiquantitative proteomic analysis, we compiled the most complete mammalian IE protein expression catalog to date (MASSIVE, accession number MSV000079756, and ProteomeXchange, accession number PXD004210). In total, we found evidence for protein expression from >5000 genes within the IE. Proteomic analysis of purified HCs revealed key details on isoform-specific protein expression, novel HC gene products, and, overall, products from >2500 genes, 313 of which were identified exclusively in GFP+ HCs. Based on our finding that a disproportionately high number of deafness genes are identified only in HCs, other, as yet unrealized deafness genes are likely present in our datasets. We propose that proteins expressed exclusively in HCs represent a previously underused source of vulnerable deafness-causing substrates.
Footnotes
This work was supported by the National Institute on Deafness and Other Communication Disorders–National Institutes of Health (Grant R00 DC-013805 to J.N.S.), the Veterans Administration Research Service (BLS Grant BX001295 to A.F.R.), and the Garnett Passe and Rodney Williams Memorial Foundation (Research Fellowship to A.C.Y.W.). J.R.Y. is supported by the National Institutes of Health (Grants P41 GM103533 and R01 MH067880). We thank Jaime Garcia-Añoveros, Ann Hogan, Kazuaki Homma, and Jing Zheng for helpful comments and feedback on manuscript content and clarity.
The authors declare no competing financial interests.
References
- Alagramam KN, et al. (2016) A small molecule mitigates hearing loss in a mouse model of Usher syndrome III. Nat Chem Biol 12. [DOI] [PMC free article] [PubMed] [Google Scholar]
- Avraham KB, Hasson T, Sobe T, Balsara B, Testa JR, Skvorak AB, Morton CC, Copeland NG, Jenkins NA (1997) Characterization of unconventional MYO6, the human homologue of the gene responsible for deafness in Snell's waltzer mice. Hum Mol Genet 6:1225–1231. 10.1093/hmg/6.8.1225 [DOI] [PubMed] [Google Scholar]
- Baets J, et al. (2015) Defects of mutant DNMT1 are linked to a spectrum of neurological disorders. Brain 138:845–861. 10.1093/brain/awv010 [DOI] [PMC free article] [PubMed] [Google Scholar]
- Budreck EC, Scheiffele P (2007) Neuroligin-3 is a neuronal adhesion protein at GABAergic and glutamatergic synapses. Eur J Neurosci 26:1738–1748. 10.1111/j.1460-9568.2007.05842.x [DOI] [PubMed] [Google Scholar]
- Burns JC, Kelly MC, Hoa M, Morell RJ, Kelley MW (2015) Single-cell RNA-Seq resolves cellular complexity in sensory organs from the neonatal inner ear. Nat Commun 6:8557. 10.1038/ncomms9557 [DOI] [PMC free article] [PubMed] [Google Scholar]
- Cai T, Jen HI, Kang H, Klisch TJ, Zoghbi HY, Groves AK (2015) Characterization of the transcriptome of nascent hair cells and identification of direct targets of the Atoh1 transcription factor. J Neurosci 35:5870–5883. 10.1523/JNEUROSCI.5083-14.2015 [DOI] [PMC free article] [PubMed] [Google Scholar]
- Chadman KK, Gong S, Scattoni ML, Boltuck SE, Gandhy SU, Heintz N, Crawley JN (2008) Minimal aberrant behavioral phenotypes of neuroligin-3 R451C knockin mice. Autism Res 1:147–158. 10.1002/aur.22 [DOI] [PMC free article] [PubMed] [Google Scholar]
- Chen EI, McClatchy D, Park SK, Yates JR 3rd (2008) Comparisons of mass spectrometry compatible surfactants for global analysis of the mammalian brain proteome. Anal Chem 80:8694–8701. 10.1021/ac800606w [DOI] [PMC free article] [PubMed] [Google Scholar]
- Cociorva D, L Tabb D, Yates JR, Tabb DL (2007) Validation of tandem mass spectrometry database search results using DTASelect. Curr Protoc Bioinformatics Chapter 13:Unit 13.4. 10.1002/0471250953.bi1304s16 [DOI] [PubMed] [Google Scholar]
- Darville LNF, Sokolowski BHA (2013) In-depth proteomic analysis of mouse cochlear sensory epithelium by mass spectrometry. J Proteome Res 12:3620–3630. 10.1021/pr4001338 [DOI] [PMC free article] [PubMed] [Google Scholar]
- Ebrahim S, Ingham NJ, Lewis MA, Rogers MJC, Cui R, Kachar B, Pass JC, Steel KP (2016) Alternative splice forms influence functions of Whirlin in mechanosensory hair cell stereocilia. Cell Rep 15:935–943. 10.1016/j.celrep.2016.03.081 [DOI] [PMC free article] [PubMed] [Google Scholar]
- Elkan-Miller T, Ulitsky I, Hertzano R, Rudnicki A, Dror AA, Lenz DR, Elkon R, Irmler M, Beckers J, Shamir R, Avraham KB (2011) Integration of transcriptomics, proteomics, and microRNA analyses reveals novel microrna regulation of targets in the mammalian inner ear. PLoS One 6:1–12. [DOI] [PMC free article] [PubMed] [Google Scholar]
- Eng JK, Mccormack AL, Yates JR (1994) An approach to correlate tandem mass spectral data of peptides with amino acid sequences in a protein database. Am Soc Mass Spectrom 5:976–989. 10.1016/1044-0305(94)80016-2 [DOI] [PubMed] [Google Scholar]
- Eppig JT, Blake JA, Bult CJ, Kadin JA, Richardson JE (2015) The Mouse Genome Database (MGD): facilitating mouse as a model for human biology and disease. Nucleic Acids Res 43:D726–D736. 10.1093/nar/gku967 [DOI] [PMC free article] [PubMed] [Google Scholar]
- Erkman L, McEvilly RJ, Luo L, Ryan a K, Hooshmand F, O'Connell SM, Keithley EM, Rapaport DH, Ryan a F, Rosenfeld MG (1996) Role of transcription factors Brn-3.1 and Brn-3.2 in auditory and visual system development. Nature 381:603–606. 10.1038/381603a0 [DOI] [PubMed] [Google Scholar]
- Finn RD, Bateman A, Clements J, Coggill P, Eberhardt RY, Eddy SR, Heger A, Hetherington K, Holm L, Mistry J, Sonnhammer ELL, Tate J, Punta M (2014) Pfam: the protein families database. Nucleic Acids Res 42:D222–D230. 10.1093/nar/gkt1223 [DOI] [PMC free article] [PubMed] [Google Scholar]
- Flicek P, et al. (2014) Ensembl 2014. Nucleic Acids Res 42:D749–D755. 10.1093/nar/gkt1196 [DOI] [PMC free article] [PubMed] [Google Scholar]
- Goutman JD, Elgoyhen AB, Gómez-Casati ME (2015) Cochlear hair cells: the sound-sensing machines. FEBS Lett 589:3354–3361. 10.1016/j.febslet.2015.08.030 [DOI] [PMC free article] [PubMed] [Google Scholar]
- Grimsley-Myers CM, Sipe CW, Geleoc GSG, Lu X (2009) The small GTPase Rac1 regulates auditory hair cell morphogenesis. J Neurosci 29:15859–15869. 10.1523/JNEUROSCI.3998-09.2009 [DOI] [PMC free article] [PubMed] [Google Scholar]
- He L, Diedrich J, Chu YY, Yates JR (2015) Extracting accurate precursor information for tandem mass spectra by RawConverter. Anal Chem 87:11361–11367. 10.1021/acs.analchem.5b02721 [DOI] [PMC free article] [PubMed] [Google Scholar]
- Herget M, Scheibinger M, Guo Z, Jan TA, Adams CM, Cheng AG, Heller S (2013) A simple method for purification of vestibular hair cells and non-sensory cells, and application for proteomic analysis. PLoS One 8. [DOI] [PMC free article] [PubMed] [Google Scholar]
- Housley GD, Marcotti W, Navaratnam D, Yamoah EN (2006) Hair cells: beyond the transducer. J Membr Biol 209:89–118. 10.1007/s00232-005-0835-7 [DOI] [PubMed] [Google Scholar]
- Jung S, Maritzen T, Wichmann C, Jing Z, Neef A, Revelo NH, Al-Moyed H, Meese S, Wojcik SM, Panou I, Bulut H, Schu P, Ficner R, Reisinger E, Rizzoli SO, Neef J, Strenzke N, Haucke V, Moser T (2015) Disruption of adaptor protein 2μ (AP-2μ) in cochlear hair cells impairs vesicle reloading of synaptic release sites and hearing. EMBO J 34:2686–2702. 10.15252/embj.201591885 [DOI] [PMC free article] [PubMed] [Google Scholar]
- Kazmierczak P, Mu U (2012) Sensing sound: molecules that orchestrate mechanotransduction by hair cells. Trends Neurosci 35:220–229. 10.1016/j.tins.2011.10.007 [DOI] [PMC free article] [PubMed] [Google Scholar]
- Khimich D, Nouvian R, Pujol R, Dieck S tom, Egner A, Gundelfinger ED, Moser T (2005) Hair cell synaptic ribbons are essential for synchronous auditory signalling. Nature 434:889–894. 10.1038/nature03418 [DOI] [PubMed] [Google Scholar]
- Kinsella RJ, Kähäri A, Haider S, Zamora J, Proctor G, Spudich G, Almeida-King J, Staines D, Derwent P, Kerhornou A, Kersey P, Flicek P (2011) Ensembl BioMarts: a hub for data retrieval across taxonomic space. Database 2011:1–9. [DOI] [PMC free article] [PubMed] [Google Scholar]
- Kitajiri SI, Fukumoto K, Hata M, Sasaki H, Katsuno T, Nakagawa T, Ito J, Tsukita S, Tsukita S (2004) Radixin deficiency causes deafness associated with progressive degeneration of cochlear stereocilia. J Cell Biol 166:559–570. 10.1083/jcb.200402007 [DOI] [PMC free article] [PubMed] [Google Scholar]
- Krey JF, Sherman NE, Jeffery ED, Choi D, Barr-Gillespie PG, Keck WM (2015) The proteome of mouse vestibular hair bundles over development. Sci Data 2:150047. 10.1038/sdata.2015.47 [DOI] [PMC free article] [PubMed] [Google Scholar]
- Link AJ, Eng J, Schieltz DM, Carmack E, Mize GJ, Morris DR, Garvik BM, Yates JR 3rd (1999) Direct analysis of protein complexes using mass spectrometry. Nat Biotechnol 17:676–682. 10.1038/10890 [DOI] [PubMed] [Google Scholar]
- Liu Y, Beyer A, Aebersold R (2016) Review on the dependency of cellular protein levels on mRNA abundance. Cell 165:535–550. 10.1016/j.cell.2016.03.014 [DOI] [PubMed] [Google Scholar]
- Masuda M, Dulon D, Pak K, Mullen LM, Li Y, Erkman L, Ryan AF (2011) Regulation of POU4F3 gene expression in hair cells by 5′ DNA in mice. Neuroscience 197:48–64. 10.1016/j.neuroscience.2011.09.033 [DOI] [PMC free article] [PubMed] [Google Scholar]
- Mi H, Muruganujan A, Thomas PD (2013) PANTHER in 2013: modeling the evolution of gene function, and other gene attributes, in the context of phylogenetic trees. Nucleic Acids Res 41:D377–D386. 10.1093/nar/gks1118 [DOI] [PMC free article] [PubMed] [Google Scholar]
- Moser T, Brandt A, Lysakowski A (2006) Hair cell ribbon synapses. Cell Tissue Res 326:347–359. 10.1007/s00441-006-0276-3 [DOI] [PMC free article] [PubMed] [Google Scholar]
- Pangršič T, Reisinger E, Moser T (2012) Otoferlin: a multi-C2 domain protein essential for hearing. Trends Neurosci 35:671–680. 10.1016/j.tins.2012.08.002 [DOI] [PubMed] [Google Scholar]
- Peng AW, Belyantseva IA, Hsu PD, Friedman TB, Heller S (2009) Twinfilin 2 regulates actin filament lengths in cochlear stereocilia. J Neurosci 29:15083–15088. 10.1523/JNEUROSCI.2782-09.2009 [DOI] [PMC free article] [PubMed] [Google Scholar]
- Peng AW, Salles FT, Pan B, Ricci AJ (2011) Integrating the biophysical and molecular mechanisms of auditory hair cell mechanotransduction. Nat Commun 2:523. 10.1038/ncomms1533 [DOI] [PMC free article] [PubMed] [Google Scholar]
- Peng H, Liu M, Pecka J, Beisel KW, Ding SJ (2012) Proteomic analysis of the organ of corti using nanoscale liquid chromatography coupled with tandem mass spectrometry. Int J Mol Sci 13:8171–8188. 10.3390/ijms13078171 [DOI] [PMC free article] [PubMed] [Google Scholar]
- Peng J, Elias JE, Thoreen CC, Licklider LJ, Gygi SP (2003) Evaluation of multidimensional chromatography coupled with tandem mass spectrometry (LC/LC-MS/MS) for large-scale protein analysis: the yeast proteome. J Proteome Res 2:43–50. 10.1021/pr025556v [DOI] [PubMed] [Google Scholar]
- R Core Team (2015) R: A language and environment for statistical computing. Vienna, Austria: R Foundation for Statistical Computing. [Google Scholar]
- Rosenbloom KR, et al. (2015) The UCSC Genome Browser database: 2015 update. Nucleic Acids Res 43:D670–D681. 10.1093/nar/gku1177 [DOI] [PMC free article] [PubMed] [Google Scholar]
- Roux I, Safieddine S, Nouvian R, Grati M, Simmler MC, Bahloul A, Perfettini I, Le Gall M, Rostaing P, Hamard G, Triller A, Avan P, Moser T, Petit C (2006) Otoferlin, Defective in a human deafness form is essential for exocytosis at the auditory ribbon synapse. Cell 127:277–289. 10.1016/j.cell.2006.08.040 [DOI] [PubMed] [Google Scholar]
- Savas JN, Toyama BH, Xu T, Yates JR, Hetzer MW (2012) Extremely long-lived nuclear pore proteins in the rat brain. Science 335:942. 10.1126/science.1217421 [DOI] [PMC free article] [PubMed] [Google Scholar]
- Scheffer DI, Shen J, Corey DP, Chen Z-Y (2015) Gene expression by mouse inner ear hair cells during development. J Neurosci 35:6366–6380. 10.1523/JNEUROSCI.5126-14.2015 [DOI] [PMC free article] [PubMed] [Google Scholar]
- Schneider ME, Dose AC, Salles FT, Chang W, Erickson FL, Burnside B, Kachar B (2006) A new compartment at stereocilia tips defined by spatial and temporal patterns of myosin IIIa expression. J Neurosci 26:10243–10252. 10.1523/JNEUROSCI.2812-06.2006 [DOI] [PMC free article] [PubMed] [Google Scholar]
- Sekerková G, Zheng L, Loomis PA, Mugnaini E, Bartles JR (2006) Espins and the actin cytoskeleton of hair cell stereocilia and sensory cell microvilli. Cell Mol Life Sci 63:2329–2341. 10.1007/s00018-006-6148-x [DOI] [PMC free article] [PubMed] [Google Scholar]
- Sharma K, Schmitt S, Bergner CG, Tyanova S, Kannaiyan N, Manrique-Hoyos N, Kongi K, Cantuti L, Hanisch U-K, Philips M-A, Rossner MJ, Mann M, Simons M (2015) Cell type-and brain region-resolved mouse brain proteome. Nat Neurosci 18:1–16. 10.1038/ncb3293 [DOI] [PMC free article] [PubMed] [Google Scholar]
- Shen J, Scheffer DI, Kwan KY, Corey DP (2015) SHIELD: An integrative gene expression database for inner ear research. Database 2015:1–9. [DOI] [PMC free article] [PubMed] [Google Scholar]
- Shin J-B, Krey JF, Hassan A, Metlagel Z, Tauscher AN, Pagana JM, Sherman NE, Jeffery ED, Spinelli KJ, Zhao H, Wilmarth PA, Choi D, David LL, Auer M, Barr-Gillespie PG (2013) Molecular architecture of the chick vestibular hair bundle. Nat Neurosci 16:365–374. 10.1038/nn.3312 [DOI] [PMC free article] [PubMed] [Google Scholar]
- Sirmaci A, et al. (2010) A truncating mutation in SERPINB6 is associated with autosomal-recessive nonsyndromic sensorineural hearing loss. Am J Hum Genet 86:797–804. 10.1016/j.ajhg.2010.04.004 [DOI] [PMC free article] [PubMed] [Google Scholar]
- Spinelli KJ, Klimek JE, Wilmarth PA, Shin J, Choi D, David LL, Gillespie PG (2012) Distinct energy metabolism of auditory and vestibular sensory epithelia revealed by quantitative mass spectrometry using MS2 intensity. Proc Natl Acad Sci U S A 109:E268–E277. 10.1073/pnas.1115866109 [DOI] [PMC free article] [PubMed] [Google Scholar]
- Sylvester JE, Fischel-Ghodsian N, Mougey EB, O'Brien TW (2004) Mitochondrial ribosomal proteins: candidate genes for mitochondrial disease. Genet Med 6:73–80. 10.1097/01.GIM.0000117333.21213.17 [DOI] [PubMed] [Google Scholar]
- Tabb DL, McDonald WH, Yates JR (2002) DTASelect and Contrast: tools for assembling and comparing protein identifications from shotgun proteomics. J Proteome Res 1:21–26. 10.1021/pr015504q [DOI] [PMC free article] [PubMed] [Google Scholar]
- Takahashi S, Cheatham MA, Zheng J, Homma K (2016) The R130S mutation significantly affects the function of prestin, the outer hair cell motor protein. J Mol Med (Berl) 94:1053–1062. 10.1007/s00109-016-1410-7 [DOI] [PMC free article] [PubMed] [Google Scholar]
- Tong B, Hornak AJ, Ste X, Maison F, Ohlemiller KK, Liberman MC (2016) Oncomodulin, an EF-hand Ca2+ buffer, is critical for maintaining cochlear function in mice. J Neurosci 36:1631–1635. 10.1523/JNEUROSCI.3311-15.2016 [DOI] [PMC free article] [PubMed] [Google Scholar]
- UniProt Consortium (2015) UniProt: a hub for protein information. Nucleic Acids Res 43:D204–D212. 10.1093/nar/gku989 [DOI] [PMC free article] [PubMed] [Google Scholar]
- Verger A, Quinlan KG, Crofts LA, Spanò S, Corda D, Kable EP, Braet F, Crossley M (2006) Mechanisms directing the nuclear localization of the CtBP family proteins. Mol Cell Biol 26:4882–4894. 10.1128/MCB.02402-05 [DOI] [PMC free article] [PubMed] [Google Scholar]
- Verpy E, Weil D, Leibovici M, Goodyear RJ, Hamard G, Houdon C, Lefèvre GM, Hardelin JP, Richardson GP, Avan P, Petit C (2008) Stereocilin-deficient mice reveal the origin of cochlear waveform distortions. Nature 456:255–258. 10.1038/nature07380 [DOI] [PMC free article] [PubMed] [Google Scholar]
- Verpy E, Leibovici M, Michalski N, Goodyear RJ, Houdon C, Weil D, Richardson GP, Petit C (2011) Stereocilin connects outer hair cell stereocilia to one another and to the tectorial membrane. J Comp Neurol 519:194–210. 10.1002/cne.22509 [DOI] [PMC free article] [PubMed] [Google Scholar]
- Vona B, Nanda I, Hofrichter MA, Shehata-Dieler W, Haaf T (2015) Non-syndromic hearing loss gene identification: a brief history and glimpse into the future. Mol Cell Probes 29:260–270. 10.1016/j.mcp.2015.03.008 [DOI] [PubMed] [Google Scholar]
- Washburn MP, Wolters D, Yates JR 3rd (2001) Large-scale analysis of the yeast proteome by multidimensional protein identification technology. Nat Biotechnol 19:242–247. 10.1038/85686 [DOI] [PubMed] [Google Scholar]
- Wedemeyer C, Zorrilla de San Martín J, Ballestero J, Gómez-Casati ME, Torbidoni AV, Fuchs PA, Bettler B, Elgoyhen AB, **Katz E (2013) Activation of presynaptic GABAB(1a,2) receptors inhibits synaptic transmission at mammalian inhibitory cholinergic olivocochlear-hair cell synapses. J Neurosci 33:15477–15487. 10.1523/JNEUROSCI.2554-13.2013 [DOI] [PMC free article] [PubMed] [Google Scholar]
- Wichmann C, Moser T (2015) Relating structure and function of inner hair cell ribbon synapses. Cell Tissue Res 361:95–114. 10.1007/s00441-014-2102-7 [DOI] [PMC free article] [PubMed] [Google Scholar]
- Xu T, Venable JD, Park SK, Cociorva D, Lu B, Liao L, Wohlschlegel J, Hewel J, Yates JR III (2006) ProLuCID, a fast and sensitive tandem mass spectra-based protein identification program. Mol Cell Proteomics 5:S174. [Google Scholar]
- Yoon H, Lee DJ, Kim MH, Bok J (2011) Identification of genes concordantly expressed with Atoh1 during inner ear development. Anat Cell Biol 44:69–78. 10.5115/acb.2011.44.1.69 [DOI] [PMC free article] [PubMed] [Google Scholar]
- Zhang DS, Piazza V, Perrin BJ, Rzadzinska AK, Poczatek JC, Wang M, Prosser HM, Ervasti JM, Corey DP, Lechene CP (2012) Multi-isotope imaging mass spectrometry reveals slow protein turnover in hair-cell stereocilia. Nature 481:520–524. 10.1038/nature10745 [DOI] [PMC free article] [PubMed] [Google Scholar]
- Zheng J, Shen W, He DZ, Long KB, Madison LD, Dallos P (2000) Prestin is the motor protein of cochlear outer hair cells. Nature 405:149–155. 10.1038/35012009 [DOI] [PubMed] [Google Scholar]
- Zybailov B, Mosley AL, Sardiu ME, Coleman MK, Florens L, Washburn MP (2006) Statistical analysis of membrane proteome expression changes in Saccharomyces cerevisiae. J Proteome Res 5:2339–2347. 10.1021/pr060161n [DOI] [PubMed] [Google Scholar]