

Abstract
Objective
The aim of this study was to explore the tape strip sampling technique in the assessment of stratum corneum levels of inflammatory mediators in a clinical trial setting.
Methods
Thirty-eight inflammatory mediators were analyzed by a multiplex-assay in the stratum corneum, collected by adhesive tapes before and after 6 weeks of therapy, in mild and moderate atopic dermatitis (AD) patients (n = 90). Treatment was a ceramide- and magnesium-containing emollient.
Results
Twenty-four mediators could quantitatively be determined. The Th2 mediators interleukin (IL)-4, IL-13, CCL2 (monocyte chemotactic protein-1), CCL22 (macrophage-derived chemokine), and CCL17 [thymus and activation-regulated chemokine (TARC)] were significantly decreased after therapy as well as IL-1β, IL-2, IL-8 (CXCL8), IL-10, acute-phase protein serum amyloid A, C-reactive protein, and vascular adhesion molecule-1. The decrease of CCL17 and IL-8 was correlated with the decrease in disease severity in a subgroup of moderate AD individuals.
Conclusion
Stratum corneum tape stripping offers a minimally invasive approach for studying local levels of immunomodulatory molecules in the skin. CCL17 (TARC) and IL-8 were found to be the most promising biomarkers of AD and might be useful for investigating the course of skin diseases and the effect of local therapy.
Key Words: Cytokines, Chemokines, Tape strips, Dermalex
Introduction
Atopic dermatitis (AD) is a chronic, remitting, inflammatory skin disorder. It has a complex etiology in which immunological dysregulation and skin barrier alterations play an important role [1,2,3]. The fact that mutations in the gene encoding for the epidermal protein filaggrin predispose for AD points toward the skin barrier as an important factor in the pathophysiology of the disease [4]. In addition to genetic factors, filaggrin expression is downregulated by Th2 cytokines [5]. This further emphasizes the interaction between the immune system and skin barrier in AD, particularly since flares of AD are characterized by activation of Th2 pathways [6,7]. The profile of inflammatory mediators might provide more insight into specific immunopathological pathways, offering potential targets for more personalized therapy, the subclassification of AD, and for the monitoring of therapy [8]. Clinical assessment of AD lesions is often hampered by symptoms such as erythema and lichenification. Furthermore, as addressed by Mansouri and Guttman-Yassky [8], AD has a high placebo response rate, which might influence assessment of the efficacy of therapeutics in clinical trials. The profiles of inflammatory mediators in AD skin lesions during exacerbation or after treatment have been insufficiently investigated because most studies are based on blood samples, and thus only provide information on systemic profiles and not on the cutaneous microenvironment [9,10]. The lack of data on the local milieu of inflammatory mediators is partly due to the invasive and laborious nature of many procedures used to obtain skin samples, such as biopsies, harvesting of skin-derived interstitial fluid or cutaneous microdialysis [11]. In contrast, the collection of the stratum corneum (SC), the uppermost layer of the epidermis, by adhesive tape offers the advantage of obtaining skin samples in a simple and noninvasive manner. This technique has been used to determine different skin biomarkers such as interleukin (IL)-1 cytokines, enzymes, lipids, and filaggrin degradation products [12,13,14,15,16]. However, so far the poor sensitivity of the analytical methods used in this approach has hampered the analysis of inflammatory mediators relevant to AD. Recently, several multiplex assays have been introduced, which are more sensitive and also permit the determination of a broad range of inflammatory mediators in a single (tape strip) sample [17].
In the present study, we used the SC tape stripping technique to determine various inflammatory mediators in lesional skin of AD patients before and after treatment with an emollient containing ceramides and magnesium. Both ingredients are involved in the maintenance of the skin barrier. Furthermore, as a control, inflammatory mediators of 20 healthy, non-AD individuals were measured. We analyzed 38 different cytokines, chemokines, and vascular growth factors, most of which, to our knowledge, have not previously been determined in the SC.
Methods
Patients
Ninety adult patients from the VU Medical Center Amsterdam outpatient clinic (average age 33 years; 57 females, 33 males) with AD as defined by the Hanifin and Rajka criteria entered the study after their written informed consent had been obtained [18]. Only patients with mild-to-moderate AD based on the OSCORAD (Objective SCORing AD) score (range 12.5-50) were included [19,20]. Apart from the emollient used in the study, patients were not allowed to apply local steroids or other products such as calcineurin inhibitors and over-the-counter emollients on the investigated lesions. Patients undergoing systemic immunosuppressive or antibiotic therapy were excluded. SC samples were collected before and after 6 weeks of topical treatment with the study emollient. A healthy population of twenty individuals without a history of AD was included as a control group. The research was conducted according to the principles of the Declaration of Helsinki and was approved by the Ethics Committee of the Academic Medical Center (study number: METC 2014_090).
Emollient
The AD patients were asked to apply an emollient containing ceramides and magnesium chloride hexahydrate (Dermalex® Eczema; Omega Pharma, Nazareth, Belgium) twice daily. Other components of the emollient included water, cholesterol, zeolite, glycerol, cocoglycerides, cetyl alcohol, isopropyl myristate, emulsifiers, and preservatives. The total lipid content was 30%. The control population was asked not to use any cream for at least 3 days preceding the study.
Tape Stripping of the SC
Tape stripping was performed as previously described [12,13]. Briefly, adhesive tapes (3.8 cm2, D-Squame; CuDerm, Dallas, Tex., USA) were placed on a skin site affected by AD, e.g. the volar forearm or popliteal fossa, and briefly pressed with a standardized pressure pen of 225 g/cm2 (D-Squame pressure instrument D500; CuDerm). Eight consecutive tapes were collected from the same skin site. Six weeks later, another eight consecutive tapes were taken from an adjacent AD-affected and emollient-treated area as close as possible to the skin site sampled during the first visit. For the analysis, the 6th tape was used (stored at -80°C). The tape strips of the control group were taken from the upper back of the participant and the 6th and 7th strip (1.5 cm2 D-squames) were used for analysis. These strips represent the middle part of the SC where the cytokine concentrations reach stable levels [14].
Sample Preparation and Analysis
The SC samples were extracted from the tapes by ultrasonification (15 min) with 0.5 ml of phosphate-buffered saline containing 0.05% Tween 20. After vortexing, the extract aliquots were distributed in vials and stored at -80°C. Analysis was performed using the MESO QuickPlex SQ 120 assay (MSD, Rockville, Md., USA). If more than 50% of the samples were under the level of detection, no further analysis was performed for that specific mediator [21]. An overview of the inflammatory mediators can be found in table 1 and online supplementary table 1 (for all online suppl. material, see www.karger.com/doi/10.1159/000448400). All panels used human antibodies. For the analysis, 50 µl of the SC extract and a calibrator (provided by MSD) were incubated overnight on the sealed plate at 2-8°C. Reading was done after washing with phosphate-buffered saline with Tween 20 and after adding the provided reading buffer. The extracts of tapes 6 and 7 of the control group were pooled, as smaller D-squame tapes were used. Concentrations of all cytokines in both groups were corrected by the total protein content of the extract, which has been determined by the Pierce assay [22]. Samples under the limit of detection were substituted for by a value of half the level of the detection limit.
Table 1.
Concentrations of inflammatory mediators in the SC before and after topical therapy
| Before therapy | After therapy | n | Healthy control (n = 20) | Before vs. after |
Before vs. healthy |
After vs. healthy |
|
|---|---|---|---|---|---|---|---|
| p value | p value | p value | |||||
| CRPa | 3.799 (0.9; 12.7) | 3.516 (1.0; 8.3) | 75 | ND | 0.0006 | ||
| CCL11/eotaxin-1 | 270.2 (146.70; 439.9) | 313.5 (179.5; 443.7) | 75 | 209 (127; 314.6) | 0.6841 | 0.0721 | 0.0072 |
| CSF2/GM-CSF | 9.20 (3.60; 21.58) | 7.0 (2.91; 19.24) | 88 | 4.6 (2.5; 11.5) | 0.0705 | 0.04 | 0.1752 |
| IFN-γ | 49.9 (38.0; 80.2) | 44.3 (31.3; 79.5) | 57 | 33.4 (17.5; 42.2) | 0.1596 | <0.0001 | 0.0002 |
| IL-10 | 8.7 (5.6; 13.9) | 6.6 (4.6; 12.3) | 57 | 0.8 (0.01; 1.67) | 0.0069 | <0.0001 | <0.0001 |
| IL-13 | 80.9 (53.7; 114.8) | 67.1 (45.2; 94.8) | 90 | 2.0 (1.6; 8.2) | 0.0016 | <0.0001 | <0.0001 |
| IL-16 | 171.2 (83.4; 363.3) | 186.5 (71.3; 334.9) | 90 | 18.3 (1.3; 42.0) | 0.3914 | <0.0001 | <0.0001 |
| IL-17a | 74.3 (40.9; 120.4) | 84.5 (42.2; 118.5) | 88 | 13.7 (9.6; 24.3) | 0.4250 | <0.0001 | <0.0001 |
| IL-1αa | 2.3 (0.08; 5.6) | 2.4 (0.6; 6.3) | 88 | 42.1 (35.1; 59.9) | 0.1475 | <0.0001 | <0.0001 |
| IL-1β | 93.5 (37.7; 243.6) | 59.7 (31.8; 137.6) | 88 | 137.4 (48.3; 523.5) | 0.0008 | 0.2149 | 0.0156 |
| IL-2 | 20.14 (12.2; 56.8) | 19.4 (11; 39.3) | 90 | 17 (0.04; 4.0) | 0.0359 | <0.0001 | <0.0001 |
| IL-4 | 11.4 (8.4; 16.5) | 9.7 (6.1; 16.0) | 41 | 0.3 (0.3; 0.3) | 0.0026 | <0.0001 | <0.0001 |
| IL-5 | 25.0 (13.0; 43.3) | 26.0 (15.0; 46.8) | 88 | 10 (7.4; 14.7) | 0.7831 | <0.0001 | <0.0001 |
| IL-8 | 97.8 (33.5; 320.3) | 46.1 (16.3; 152.8) | 90 | 14.2 (2.7; 35.6) | 0.0011 | <0.0001 | 0.0002 |
| IL-12_23p40 | 54.8 (28.7; 124) | 58.0 (18.9; 147.1) | 49 | 34.8 (13.2; 49.8) | 0.1143 | 0.0009 | 0.0079 |
| CCL2/MCP-1 | 16.5 (8.4; 32.8) | 11.4 (6.2; 21.7) | 90 | 7.4 (3.2; 13.8) | 0.0074 | <0.0001 | <0.0001 |
| CCL13/MCP-4 | 247.4 (166.5; 472.4) | 295.8 (160.2; 534.1) | 90 | 67.3 (25.0; 95.6) | 0.3369 | <0.0001 | <0.0001 |
| CCL22/MDC | 1,152 (656.2; 1941) | 955.4 (522.1; 1,465) | 90 | 716.7 (465.2; 1,325) | 0.0153 | 0.0908 | 0.5992 |
| CCL3/MIP-1a | 210.8 (137.7; 325.7) | 245.5 (167.7; 335.7) | 88 | 5.82 (1.79; 139.1) | 0.7352 | <0.0001 | <0.0001 |
| CCL4/MIP-1b | 164.6 (102.6; 335.6) | 179 (94.6; 318.8) | 90 | 22.6 (7.3; 29.2) | 0.9669 | <0.0001 | <0.0001 |
| SAAa | 9.8 (102.6; 335.6) | 8,430 (94.62; 318.8) | 75 | ND | 0.0276 | ||
| CCL17/TARC | 85.0 (35.7; 187.2) | 56.3 (34.1; 105.1) | 90 | 26.1 (35.6; 52.7) | 0.0047 | 0.0002 | 0.0067 |
| TNF-β | 8.0 (4.6; 20.5) | 8.2 (4.3; 18.4) | 51 | 1.16 (3.41; 5.3) | 0.2611 | <0.0001 | <0.0001 |
| VCAM-1a | 3.8 (1.2; 10.7) | 2.4 (0.7; 6.7) | 57 | ND | 0.0087 |
Values are expressed as medians (interquartile ranges), unless otherwise indicated. ‘Before vs. after’ was tested by a two-sided Wilcoxon signed rank test and ‘before vs. healthy’ and ‘after vs. healthy’ by a Mann-Whitney test. n = Number of samples in which the inflammatory mediators’ concentration could quantitatively be determined; p = level of significance (significant differences are highlighted in bold). CSF2 = Colony-stimulating factor 2; GM-CSF = granulocyte-macrophage colony-stimulating factor; IFN = interferon; MCP = monocyte chemotactic protein; MDC = macrophage-derived chemokine; MIP =macrophage inflamenatory protein; TNF = tumor necrosis factor; ND = not determined.
All concentrations are expressed as ng/µg protein, except CRP, IL-1 α, SAA and VCAM-1 that are expressed in µg/µg protein.
Clinical and Biophysical Parameters
The OSCORAD was used to determine the clinical severity of AD lesions [19]. Since only isolated skin sites were treated and clinically assessed, the body surface area was set to 1% when calculating the OSCORAD. To assess the skin barrier function, transepidermal water loss (TEWL) was measured using a Tewameter 300 (Courage and Khazaka Electronic GmbH, Cologne, Germany).
Statistics
Statistical calculations were performed using Graphpad Prism 6.0 (Graphpad software, La Jolla, Calif., USA). The Shapiro-Wilk test was used to check for data distribution. In the case of deviation from normal distribution, a nonparametric two-sided Wilcoxon signed-rank test was used. For normally distributed data, a two-sided t test was applied. A p value of <0.05 was considered statistically significant. Because of the explorative character of the study, no correction for multiple testing was applied. Spearman's rank correlation coefficient was used to perform correlation analysis of individual immunomodulators, clinical, and biophysical parameters.
Results
In total, 90 AD patients and 20 healthy controls completed the study, and their samples were analyzed. The concentrations of 24 out of 38 measured inflammatory mediators could be quantitatively determined (i.e. the concentrations were above the detection limit of the method) in the majority of the samples (table 1). Immunomodulators of which the concentrations in the majority of samples (>50%) were below the detection limit were not further analyzed. A summary of these mediators can be found in supplementary table 1. The levels of eleven inflammatory mediators were significantly decreased after the 6-week topical emollient treatment. Among them were the Th2 inflammatory mediators IL-4 (p = 0.0033), IL-13 (p = 0.0016), CC chemokine ligand (CCL)2/monocyte chemotactic protein-1 (p = 0.0025), CCL22/macrophage-derived chemokine (p = 0.0153) and CCL17/thymus and activation-regulated chemokine (TARC) (p = 0.0047). A significant decrease was also found for the levels of the regulatory cytokines IL-1β (p = 0.0008), IL-2 (p = 0.0359), IL-4 (p = 0.0033), IL-8 (p = 0.0011), and IL-10 (p = 0.0069) as well as the acute-phase protein serum amyloid A (SAA) (p = 0.0276) and C-reactive protein (CRP) (p = 0.0006) and vascular adhesion molecule (VCAM-1) (p = 0.0087). The other mediators did not show a significant change over time. When compared with healthy controls most of the inflammatory mediators were significantly higher in the treatment group, both before and after therapy (table 1).
Both the clinical severity as assessed by OSCORAD and the skin barrier function as measured by TEWL improved significantly after 6 weeks of therapy (table 2). The OSCORAD decreased from 14.20 to 10.70 (p < 0.0001) and the TEWL from 29.91 to 28.2 g/m2/h (p = 0.008). The decrease in OSCORAD was 14.0 units (p < 0.0001) in the patients with moderate AD and 3.5 (p < 0.0001) in patients with mild AD (table 2). A representative picture of lesions in patients with a mild and moderate disease severity is shown in figure 1.
Table 2.
Clinical and biophysical parameters measured at baseline and after 6 weeks of therapy
| Before therapy | After therapy | n | p | |
|---|---|---|---|---|
| Total OSCORAD | 14.2 (10.7; 21.2) | 10.7 (7.2; 14.2) | 90 | <0.0001 |
| Mild OSCORAD | 14.2 (l0.7; 17.70) | 10.7 (7.2; 14.20) | 69 | <0.0001 |
| Moderate OSCORAD | 28.2 (26.45; 31.70) | 14.2 (10.7; 22.95) | 21 | <0.0001 |
| TEWL, g/m2/h | 29.91 (23.29; 39.37) | 28.2 (19.73; 36.18) | 90 | 0.008 |
Values are expressed as medians (interquartile ranges), unless otherwise indicated. p = level of significance for the difference between the baseline and after treatment (two-sided Wilcoxon signed-rank test).
Fig. 1.
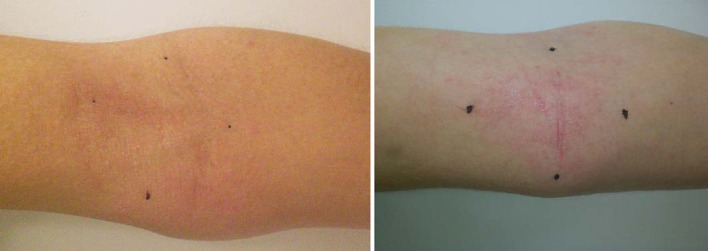
Representative pictures of the studied lesions. Tape strip samples were taken in the center of the marked region. Left: mild AD, right: moderate AD.
Correlation Analysis
In order to investigate relationships between the various inflammatory mediators, TEWL and OSCORAD, a correlation analysis was performed (online suppl. tables 2.1 and 2.2). A strong and significant correlation was found between the change in Th1 cytokines CCL11/Eotaxin-1 and IL-5 (r = 0.61, p < 0.001), the Th2 cytokines IL-4 and IL-13 (r = 0.72, p < 0.001), and tumor necrosis factor-β and IL-12 (r = 0.75, p < 0.001). The acute-phase proteins SAA and CRP both correlated well with VCAM-1 (r = 0.90; p < 0.001 and r = 0.74; p < 0.001, respectively). There was no correlation in changes of any of the investigated mediators with changes in OSCORAD and TEWL. However, in a subgroup analysis of moderate AD cases (OSCORAD >25), CCL17 and IL-8 showed to be significantly correlated with the decrease of OSCORAD (r = 0.56; p = 0.01 and r = 0.45; p = 0.05). Furthermore, significant correlations between the values of various inflammatory mediators and OSCORAD and TEWL at baseline as well as after the therapy (online suppl. tables 3.1 and 3.2) were found.
Discussion
In the present study, we explored the potential of a minimally invasive sampling technique for the determination of inflammatory mediators in the SC of the lesional skin of AD patients with mild-to-moderate AD before and after treatment with an emollient. In total, 24 out of 38 investigated mediators could quantitatively be determined. The absolute levels of various inflammatory mediators correlated with the skin severity (OSCORAD) and skin barrier function (TEWL) at baseline and/or after therapy (online suppl. table 3).
After 6 weeks of topical therapy with an emollient containing magnesium and ceramides, both the severity of skin lesions and the skin barrier function improved. This was consistent with a significant decrease in the levels of various inflammatory mediators, mainly Th2-related cytokines and chemokines characteristic of acute AD lesions [23,24,25,26], including IL-4, IL-13, CCL2, CCL22, and CCL17. As expected, the levels of most inflammatory mediators were significantly higher in AD patients (before and after therapy) than in the healthy control group [7]. Furthermore the levels of IL-4 and IL-13 were strongly correlated (r = 0.70). IL-4 and IL-13 are known as drivers of key pathogenic mechanisms of AD such as the survival of Th2 cells, differentiation and activation of myeloid and dendritic cells, activation of B cells, stimulation of the IgE class switch, and recruitment of eosinophils [27,28]. Furthermore, they suppress lipid production, filaggrin expression, and keratinocyte differentiation, impairing the skin's barrier function [5,29]. The importance of IL-4 and IL-13 in AD has been previously confirmed in clinical studies. Thus, systemic therapy of AD patients with dupilumab, a monoclonal IL-4 and IL-13 receptor antagonist, resulted in a rapid improvement of disease activity [5,30,31,32,33,34,35].
In the present study, there was no significant change in the levels of the Th1 mediator interferon-γ. However, the levels of IL-1β and IL-2 decreased significantly during the 6 weeks of therapy. The latter is associated with pruritus, a key symptom of AD [36,37,38]. Apart from the Th2- and Th1-mediated molecules, significant changes were observed for the more general inflammatory mediators SAA, CRP, and VCAM-1 during therapy. Similarly, Caproni et al. [39] found a decrease of VCAM-1 in lesional skin biopsies of AD patients after local therapy with tacrolimus. Elevated CRP serum levels have previously been reported in AD [40]. However, to the best of our knowledge, this is the first time that CRP was measured directly in human AD skin lesions.
Data on the local cytokine and chemokine milieu in AD are scarce [30]. Morita et al. [41] showed a significant correlation between the SC levels of CCL17 and disease severity, Amarbayasgalan et al. [42] showed that IL-8 was correlated with AD-severity. Szegedi et al. [7] determined a wide range of Th1 and Th2 cytokines in dermal interstitial fluid collected from healthy subjects, and in the lesional and nonlesional skin of AD patients. IL-8 and the levels of Th2 cytokines/chemokines IL-13, CCL2, and CCL17 were lower in healthy skin compared to lesional skin. Data on inflammatory mediators obtained from skin samples (i.e. SC tapes and interstitial fluid) are consistent with those from blood samples. Utilizing a multiplex analysis, Thijs et al. [43] found a significant decrease in the levels of 7 out of 31 investigated biomarkers, including CCL17 and CCL22, in blood samples from patients with moderate-to-severe AD who were treated with a potent corticosteroid [44]. This is in line with the results of the present study in which a significant decrease in CCL17 and IL-8 was found after the therapy with the emollient containing magnesium and ceramides. CCL17 and CCL22 act via the Th2 cell chemokine receptor CCR4 [44,45,46,47]. In a recent meta-analysis, serum levels of CCL17 were the most reliable available biomarker of AD disease severity, showing correlation coefficients of 0.60 (95% CI 0.48-0.70) and 0.64 (95% CI 0.57-0.70) in longitudinal and cross-sectional studies, respectively [41,43,44,48,49].
Although the levels of several immunomodulators in the present study were significantly decreased after therapy and were associated with the OSCORAD and TEWL at baseline and/or after therapy, there was no correlation between the changes in their levels and an improvement of clinical symptoms (OSCORAD) or skin barrier function (TEWL). One of the reasons for this might be the inclusion of patients with mild-to-moderate AD who showed a slight but significant reduction of OSCORAD from 14.2 to 10.7. For instance, patients in the study conducted by Thijs et al. [43] had more severe AD, and the study showed a large decrease of the severity index SASSAD (‘six area, six sign AD’) from 36.9 at baseline to 8.0 at the endpoint. Indeed, in the present study a subgroup analysis of moderate-AD individuals did show that declining concentrations of CCL17 and IL-8 were significantly correlated with the decrease in symptoms as assed by OSCORAD. The performance of these inflammatory mediators as biomarkers of disease activity should therefore be further investigated in patients with more severe AD. One of the limitations of the present study is that the SC samples of the control group were collected from the upper back. However, Amarbayasgalan et al. [42] have shown no regional differences for various inflammatory mediators in healthy skin, including the back, neck, and arm. Furthermore, most of the investigated cytokines are produced upon inflammation due to AD and are not constitutively present in healthy skin.
In conclusion, tape stripping of the SC is a simple, minimally invasive approach to the study of local levels of various immunomodulatory molecules relevant to AD. CCL17 (TARC) and IL-8 were found to be the most promising biomarkers for AD. These biomarkers provide not only a better understanding of the pathogenesis of AD but also information on treatment efficacy, further enabling more targeted clinical care.
Acknowledgments
This work was supported by COST Action TD1206 StanDerm. Omega Pharma provided study medication free of charge.
References
- 1.Bieber T. Atopic dermatitis. N Engl J Med. 2008;358:1483–1494. doi: 10.1056/NEJMra074081. [DOI] [PubMed] [Google Scholar]
- 2.Elias PM, Steinhoff M. ‘Outside-to-inside’ (and now back to ‘outside’) pathogenic mechanisms in atopic dermatitis. J Invest Dermatol. 2008;128:1067–1070. doi: 10.1038/jid.2008.88. [DOI] [PMC free article] [PubMed] [Google Scholar]
- 3.Boguniewicz M, Leung DY. Atopic dermatitis: a disease of altered skin barrier and immune dysregulation. Immunol Rev. 2011;242:233–246. doi: 10.1111/j.1600-065X.2011.01027.x. [DOI] [PMC free article] [PubMed] [Google Scholar]
- 4.Palmer CNA, Irvine AD, Terron-Kwiatkowski A, et al. Common loss-of-function variants of the epidermal barrier protein filaggrin are a major predisposing factor for atopic dermatitis. Nat Genet. 2006;38:441–446. doi: 10.1038/ng1767. [DOI] [PubMed] [Google Scholar]
- 5.Howell MD, Kim BE, Gao P, et al. Cytokine modulation of atopic dermatitis filaggrin skin expression. J Allergy Clin Immunol. 2009;124(3 suppl 2):R7–R12. doi: 10.1016/j.jaci.2009.07.012. [DOI] [PubMed] [Google Scholar]
- 6.Eyerich K, Novak N. Immunology of atopic eczema: overcoming the Th1/Th2 paradigm. Allergy. 2013;68:974–982. doi: 10.1111/all.12184. [DOI] [PubMed] [Google Scholar]
- 7.Szegedi K, Lutter R, Res PC, et al. Cytokine profiles in interstitial fluid from chronic atopic dermatitis skin. J Eur Acad Dermatol Venereol. 2015;29:2136–2144. doi: 10.1111/jdv.13160. [DOI] [PubMed] [Google Scholar]
- 8.Mansouri Y, Guttman-Yassky E. Immune pathways in atopic dermatitis, and definition of biomarkers through broad and targeted therapeutics. J Clin Med. 2015;4:858–873. doi: 10.3390/jcm4050858. [DOI] [PMC free article] [PubMed] [Google Scholar]
- 9.Brandt EB, Sivaprasad U. Th2 cytokines and atopic dermatitis. J Clin Cell Immunol. 2011;2:110. doi: 10.4172/2155-9899.1000110. [DOI] [PMC free article] [PubMed] [Google Scholar]
- 10.Zhao X, Delgado L, Weiner R, Laterza OF. An ultra-sensitive clinical biomarker assay: quantitation of thymus and activation-regulated chemokine in human plasma. Bioanalysis. 2014;6:1069–1080. doi: 10.4155/bio.14.72. [DOI] [PubMed] [Google Scholar]
- 11.Schnetz E, Fartasch M. Microdialysis for the evaluation of penetration through the human skin barrier - a promising tool for future research? Eur J Pharm Sci. 2001;12:165–174. doi: 10.1016/s0928-0987(00)00155-x. [DOI] [PubMed] [Google Scholar]
- 12.Kezic S, Kammeyer A, Calkoen F, Fluhr JW, Bos JD. Natural moisturizing factor components in the stratum corneum as biomarkers of filaggrin genotype: evaluation of minimally invasive methods. Br J Dermatol. 2009;161:1098–1104. doi: 10.1111/j.1365-2133.2009.09342.x. [DOI] [PubMed] [Google Scholar]
- 13.Breternitz M, Flach M, Prassler J, Elsner P, Fluhr JW. Acute barrier disruption by adhesive tapes is influenced by pressure, time and anatomical location: integrity and cohesion assessed by sequential tape stripping. A randomized, controlled study. Br J Dermatol. 2007;156:231–240. doi: 10.1111/j.1365-2133.2006.07632.x. [DOI] [PubMed] [Google Scholar]
- 14.De Jongh CM, Verberk MM, Spiekstra SW, Gibbs S, Kezic S. Cytokines at different stratum corneum levels in normal and sodium lauryl sulphate-irritated skin. Skin Res Technol. 2007;13:390–398. doi: 10.1111/j.1600-0846.2007.00242.x. [DOI] [PubMed] [Google Scholar]
- 15.Van Smeden J, Hoppel L, Van Der Heijden R, Hankemeier T, Vreeken RJ, Bouwstra JA. LC/MS analysis of stratum corneum lipids: ceramide profiling and discovery. J Lipid Res. 2011;52:1211–1221. doi: 10.1194/jlr.M014456. [DOI] [PMC free article] [PubMed] [Google Scholar]
- 16.Mohammed D, Matts PJ, Hadgraft J, Lane ME. Variation of stratum corneum biophysical and molecular properties with anatomic site. AAPS J. 2012;14:806–812. doi: 10.1208/s12248-012-9400-3. [DOI] [PMC free article] [PubMed] [Google Scholar]
- 17.Chowdhury F, Williams A, Johnson P. Validation and comparison of two multiplex technologies, luminex and mesoscale discovery, for human cytokine profiling. J Immunol Methods. 2009;340:55–64. doi: 10.1016/j.jim.2008.10.002. [DOI] [PubMed] [Google Scholar]
- 18.Rudzki E, Samochocki Z, Ofofw W, et al. Frequency and significance of the major and minor features of Hanifin and Rajka among patients with atopic dermatitis. Dermatology. 1994;189:41–46. doi: 10.1159/000246781. [DOI] [PubMed] [Google Scholar]
- 19.Wolkerstorfer A, De Waard Van Der Spek FB, Glazenburg EJ, Mulder PG, Oranje AP. Scoring the severity of atopic dermatitis: three item severity score as a rough system for daily practice and as a pre-screening tool for studies. Acta Derm Venereol. 1999;79:356–359. doi: 10.1080/000155599750010256. [DOI] [PubMed] [Google Scholar]
- 20.Schram ME, Spuls PI, Leeflang MM, Lindeboom R, Bos JD, Schmitt J. EASI, (objective) SCORAD and POEM for atopic eczema: responsiveness and minimal clinically important difference. Allergy. 2012;67:99–106. doi: 10.1111/j.1398-9995.2011.02719.x. [DOI] [PubMed] [Google Scholar]
- 21.Jain RB, Caudill SP, Wang RY, Monsell E. Evaluation of maximum likelihood procedures to estimate left censored observations. Anal Chem. 2008;80:1124–1132. doi: 10.1021/ac0711788. [DOI] [PubMed] [Google Scholar]
- 22.Krohn RI. The colorimetric detection and quantitation of total protein. Curr Protoc Cell Biol. 2002 doi: 10.1002/0471143030.cba03hs15. Appendix 3: Appendix 3H. [DOI] [PubMed] [Google Scholar]
- 23.Proksch E, Folster-Holst R, Jensen JM. Skin barrier function, epidermal proliferation and differentiation in eczema. J Dermatol Sci. 2006;43:159–169. doi: 10.1016/j.jdermsci.2006.06.003. [DOI] [PubMed] [Google Scholar]
- 24.Danso MO, Van Drongelen V, Mulder A, et al. TNF-alpha and Th2 cytokines induce atopic dermatitis-like features on epidermal differentiation proteins and stratum corneum lipids in human skin equivalents. J Invest Dermatol. 2014;134:1941–1950. doi: 10.1038/jid.2014.83. [DOI] [PubMed] [Google Scholar]
- 25.Soumelis V, Reche PA, Kanzler H, et al. Human epithelial cells trigger dendritic cell-mediated allergic inflammation by producing TSLP. Nature Immunol. 2002;3:673–680. doi: 10.1038/ni805. [DOI] [PubMed] [Google Scholar]
- 26.Bogiatzi SI, Fernandez I, Bichet JC, et al. Cutting edge: proinflammatory and Th2 cytokines synergize to induce thymic stromal lymphopoietin production by human skin keratinocytes. J Immunol. 2007;178:3373–3377. doi: 10.4049/jimmunol.178.6.3373. [DOI] [PubMed] [Google Scholar]
- 27.Thaçi D, Simpson EL, Beck LA, et al. Efficacy and safety of dupilumab in adults with moderate-to-severe atopic dermatitis inadequately controlled by topical treatments: a randomised, placebo-controlled, dose-ranging phase 2b trial. Lancet. 2016;387:40–52. doi: 10.1016/S0140-6736(15)00388-8. [DOI] [PubMed] [Google Scholar]
- 28.Hamilton JD, Suárez-Fariñas M, Dhingra N, et al. Dupilumab improves the molecular signature in skin of patients with moderate-to-severe atopic dermatitis. J Allergy Clin Immunol. 2014;134:1293–1300. doi: 10.1016/j.jaci.2014.10.013. [DOI] [PubMed] [Google Scholar]
- 29.Sehra S, Yao Y, Howell MD, et al. IL-4 regulates skin homeostasis and the predisposition toward allergic skin inflammation. J Immunol. 2010;184:3186–3190. doi: 10.4049/jimmunol.0901860. [DOI] [PMC free article] [PubMed] [Google Scholar]
- 30.Beck LA, Thaçi D, Hamilton JD, et al. Dupilumab treatment in adults with moderate-to-severe atopic dermatitis. N Engl J Med. 2014;371:130–139. doi: 10.1056/NEJMoa1314768. [DOI] [PubMed] [Google Scholar]
- 31.Hamid Q, Naseer T, Minshall EM, Song YL, Boguniewicz M, Leung DY. In vivo expression of IL-12 and IL-13 in atopic dermatitis. J Allergy Clin Immunol. 1996;98:225–231. doi: 10.1016/s0091-6749(96)70246-4. [DOI] [PubMed] [Google Scholar]
- 32.Akdis M, Akdis CA, Weigl L, Disch R, Blaser K. Skin-homing, CLA+ memory T cells are activated in atopic dermatitis and regulate IgE by an IL-13-dominated cytokine pattern: IgG4 counter-regulation by CLA-memory T cells. J Immunol. 1997;159:4611–4619. [PubMed] [Google Scholar]
- 33.Jeong CW, Ahn KS, Rho NK, et al. Differential in vivo cytokine mRNA expression in lesional skin of intrinsic vs. extrinsic atopic dermatitis patients using semiquantitative RT-PCR. Clin Exp Allergy. 2003;33:1717–1724. doi: 10.1111/j.1365-2222.2003.01782.x. [DOI] [PubMed] [Google Scholar]
- 34.Di Cesare A, Di Meglio P, Nestle FO. A role for Th17 cells in the immunopathogenesis of atopic dermatitis? J Invest Dermatol. 2008;128:2569–2571. doi: 10.1038/jid.2008.283. [DOI] [PubMed] [Google Scholar]
- 35.Grewe M, Walther S, Gyufko K, Czech W, Schopf E, Krutmann J. Analysis of the cytokine pattern expressed in situ in inhalant allergen patch test reactions of atopic dermatitis patients. J Invest Dermatol. 1995;105:407–410. doi: 10.1111/1523-1747.ep12321078. [DOI] [PubMed] [Google Scholar]
- 36.Gaspari AA, Lotze MT, Rosenberg SA, Stern JB, Katz SI. Dermatologic changes associated with interleukin 2 administration. JAMA. 1987;258:1624–1629. [PubMed] [Google Scholar]
- 37.Lee RE, Gaspari AA, Lotze MT, Chang AE, Rosenberg SA. Interleukin 2 and psoriasis. Arch Dermatol. 1988;124:1811–1815. [PubMed] [Google Scholar]
- 38.Kremer AE, Feramisco J, Reeh PW, Beuers U, Oude Elferink RP. Receptors, cells and circuits involved in pruritus of systemic disorders. Biochim Biophys Acta. 2014;1842:869–892. doi: 10.1016/j.bbadis.2014.02.007. [DOI] [PubMed] [Google Scholar]
- 39.Caproni M, Torchia D, Antiga E, Volpi W, Fabbri P. Expression of adhesion molecules in atopic dermatitis is reduced by tacrolimus, but not by hydrocortisone butyrate: a randomized immunohistochemical study. Clin Exp Dermatol. 2006;31:813–817. doi: 10.1111/j.1365-2230.2006.02214.x. [DOI] [PubMed] [Google Scholar]
- 40.Khandaker GM, Zammit S, Lewis G, Jones PB. A population-based study of atopic disorders and inflammatory markers in childhood before psychotic experiences in adolescence. Schizophr Res. 2014;152:139–145. doi: 10.1016/j.schres.2013.09.021. [DOI] [PMC free article] [PubMed] [Google Scholar]
- 41.Morita E, Takahashi H, Niihara H, et al. Stratum corneum TARC level is a new indicator of lesional skin inflammation in atopic dermatitis. Allergy. 2010;65:1166–1172. doi: 10.1111/j.1398-9995.2010.02361.x. [DOI] [PubMed] [Google Scholar]
- 42.Amarbayasgalan T, Takahashi H, Dekio I, Morita E. Interleukin-8 content in the stratum corneum as an indicator of the severity of inflammation in the lesions of atopic dermatitis. Int Arch Allergy Immunol. 2013;160:63–74. doi: 10.1159/000339666. [DOI] [PubMed] [Google Scholar]
- 43.Thijs JL, Nierkens S, Herath A, et al. A panel of biomarkers for disease severity in atopic dermatitis. Clin Exp Allergy. 2015;45:698–701. doi: 10.1111/cea.12486. [DOI] [PubMed] [Google Scholar]
- 44.Thijs J, Krastev T, Weidinger S, et al. Biomarkers for atopic dermatitis: a systematic review and meta-analysis. Curr Opin Allergy Clin Immunol. 2015;15:453–460. doi: 10.1097/ACI.0000000000000198. [DOI] [PubMed] [Google Scholar]
- 45.Shimada Y, Takehara K, Sato S. Both Th2 and Th1 chemokines (TARC/CCL17, MDC/CCL22, and Mig/CXCL9) are elevated in sera from patients with atopic dermatitis. J Dermatol Sci. 2004;34:201–208. doi: 10.1016/j.jdermsci.2004.01.001. [DOI] [PubMed] [Google Scholar]
- 46.Jahnz-Rozyk K, Targowski T, Paluchowska E, Owczarek W, Kucharczyk A. Serum thymus and activation-regulated chemokine, macrophage-derived chemokine and eotaxin as markers of severity of atopic dermatitis. Allergy. 2005;60:685–688. doi: 10.1111/j.1398-9995.2005.00774.x. [DOI] [PubMed] [Google Scholar]
- 47.Fujisawa T, Fujisawa R, Kato Y, et al. Presence of high contents of thymus and activation-regulated chemokine in platelets and elevated plasma levels of thymus and activation-regulated chemokine and macrophage-derived chemokine in patients with atopic dermatitis. J Allergy Clin Immunol. 2002;110:139–146. doi: 10.1067/mai.2002.126079. [DOI] [PubMed] [Google Scholar]
- 48.Imai T, Baba M, Nishimura M, Kakizaki M, Takagi S, Yoshie O. The T cell-directed CC chemokine TARC is a highly specific biological ligand for CC chemokine receptor 4. J Biol Chem. 1997;272:15036–15042. doi: 10.1074/jbc.272.23.15036. [DOI] [PubMed] [Google Scholar]
- 49.Wakugawa M, Nakamura K, Kakinuma T, Onai N, Matsushima K, Tamaki K. CC chemokine receptor 4 expression on peripheral blood CD4+ T cells reflects disease activity of atopic dermatitis. J Invest Dermatol. 2001;117:188–196. doi: 10.1046/j.0022-202x.2001.01430.x. [DOI] [PubMed] [Google Scholar]