Abstract
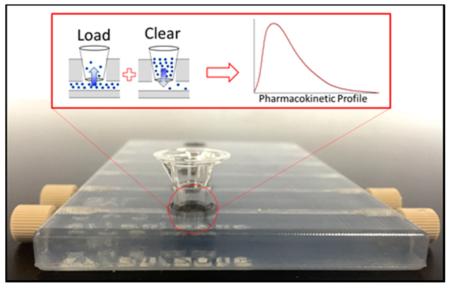
The process of bringing a drug to market involves many steps, including the preclinical stage, where various properties of the drug candidate molecule are determined. These properties, which include drug absorption, distribution, metabolism, and excretion, are often displayed in a pharmacokinetic (PK) profile. While PK profiles are determined in animal models, in vitro systems that model in vivo processes are available, although each possesses shortcomings. Here, we present a 3D-printed, diffusion-based, and dynamic in vitro PK device. The device contains six flow channels, each with integrated porous membrane-based insert wells. The pores of these membranes enable drugs to freely diffuse back and forth between the flow channels and the inserts, thus enabling both loading and clearance portions of a standard PK curve to be generated. The device is designed to work with 96-well plate technology and consumes single-digit milliliter volumes to generate multiple PK profiles, simultaneously. Generation of PK profiles by use of the device was initially performed with fluorescein as a test molecule. Effects of such parameters as flow rate, loading time, volume in the insert well, and initial concentration of the test molecule were investigated. A prediction model was generated from this data, enabling the user to predict the concentration of the test molecule at any point along the PK profile within a coefficient of variation of ~5%. Depletion of the analyte from the well was characterized and was determined to follow first-order rate kinetics, indicated by statistically equivalent (p > 0.05) depletion half-lives that were independent of the starting concentration. A PK curve for an approved antibiotic, levofloxacin, was generated to show utility beyond the fluorescein test molecule.
The ever-rising cost of a drug passing clinical trials1–3 and becoming market-available4–6 results in a continuous demand for the development of tools to increase efficiency during the drug development process. A key step in the drug development process is the preclinical stage, where the pharmacokinetic (PK) profile of a drug candidate molecule is determined. Currently, PK profiles are a standard determination in pharmaceutical research and yield important information about a drug’s in vivo absorption, distribution, metabolism, and excretion (ADME).
A typical protocol for generating a PK profile is to inject the drug candidate molecule into an animal model, followed by composite sampling; that is, at every time point along the PK profile, whole blood from a different animal is sampled before being analyzed by mass spectrometry for the drug or its metabolites. These concentrations are then plotted as a function of time to generate a PK curve, which contains information about minimum effective concentration (MEC), therapeutic range, and duration of action. In vivo animal studies, while providing a living system comparable to that of humans, consume large quantities of materials and time and are highly technical, and the obtained data do not often translate to human scale and metabolism.7–9 Recently, there has been interest in further developing in vitro systems for use in tandem with current in vivo methodology to increase efficiency of study design while reducing material costs. While in vitro PK profiles will never be able to incorporate all of the variables present in an in vivo model, nor the pharmacodynamic (PD) response, recent reviews10 and reports11,12 in the literature clearly demonstrate the need for improved in vitro models for PK/PD studies.
There are several established in vitro PK systems, which are categorized by the environment in which the samples interact with the drug. The most basic environment is a static in vitro model that monitors samples in a stationary environment where a fixed concentration of drug is administered.13–17 Static models are ideal for PD profiling, which emphasize the drug’s effect on the body. Unfortunately, static models are not ideal for PK profiling due to challenges in manipulation of the drug concentration, a key feature in generating PK profiles.7,10,18–20 Dynamic in vitro models (DIVMs) offer more flexibility in manipulating drug concentrations by incorporating a flow component into the system. The drug concentrations are usually altered by dilution methods, but the flow is in direct contact with the sample and therefore this method may result in a loss of sample.7,10,19,21–25 In order to counteract the loss of sample, diffusion-based DIVMs offer perhaps a more practicable in vivo mimic.15,26–39 The sample is conserved in a diffusion-based DIVM by separating the direct flow from the sample through the use of a membrane filter that allows for fresh nutrients, drugs, and oxygen to diffuse to the sample, while simultaneously allowing the removal of created waste.10,26 Unfortunately, even diffusion-based DIVMs have shortcomings such as labor-intensive sampling, consumption of high volumes (up to liters) of perfusate to complete the profile, difficult recovery of the cells affected by the drug for analysis, and low throughput.10,19
Microfluidic technologies40,41 may help overcome the volume consumption and sample recovery challenges associated with diffusion-based DIVMs.42,43 However, nonstandardized fluidic devices developed by soft-lithographic procedures lack the automation potential and ruggedness required for PK profile generation. Three-dimensional (3D) printing has the potential to bridge the gap between microfluidics and the rigidity and reusability required for automated infrastructure.44–47 Here, we describe a 3D-printed fluidic device capable of generating dynamic, in vitro PK profiles that also enables direct access to cells for measurement of cellular PDs. The device utilized in this study is coupled with a disposable Transwell insert whose bottom is composed of a porous semipermeable membrane that separates a flowing stream of drug-containing buffer in the fluidic channels from a standardsized microplate well.46 These fluidic devices provide a rigid reusable platform, whereupon seeding specific cell types in the disposable cell culture inserts creates a biomimetic system. Therefore, PK profiles obtained from animal models have the potential to be recreated and further optimized. Prior to increasing the complexity of the system by incorporation of cells into the inserts, the device was first characterized without cells by using a fluorescent probe (fluorescein) and a well-established antibiotic, levofloxacin.48–50
MATERIALS AND METHODS
Three-Dimensional Device Fabrication
An Objet Connex 350 printer housed in the Department of Electrical and Computer Engineering at Michigan State University was used to simultaneously print FullCure 810 VeroClear (Objet Geometries Ltd., Rehovot, Israel) and Fullcure 980 Tango-BlackPlus (Objet Geometries Ltd., Rehovot, Israel) materials. The composition of both materials is proprietary; however, the optically transparent FullCure 810 VeroClear material is composed of isobornyl acrylate (15–30%), acrylic monomer (15–30%), urethane acrylate (10–30%), acrylic monomer (10–15%), epoxy acrylate (10–15%), acrylate oligomer (10–15%), and a photoinitiator (0.1–2%). The composition of the black, rubberlike Fullcure 980 TangoBlackPlus is urethane acrylate oligomer (30–60%), exo-1,7,7-trimethylbicyclo[2.2.1]-hept-2-yl acrylate (1–20%), methacrylate oligomer (1–20%), resin polyurethane (1–20%), and a photoinitiator (0.1–1%).
The 3D-printed devices were composed mostly of the Vero Clear material, with the Fullcure 980 TangoBlackPlus material used to fabricate an O-ring that lined the inside of the wells to create a seal between Transwell inserts and the fluidic device. Postprint, the devices were opaque, requiring fine sanding and either polishing or application of a clear lacquer to the outside of the device (Rust-Oleum, Vernon Hills, IL) to achieve optical transparency.
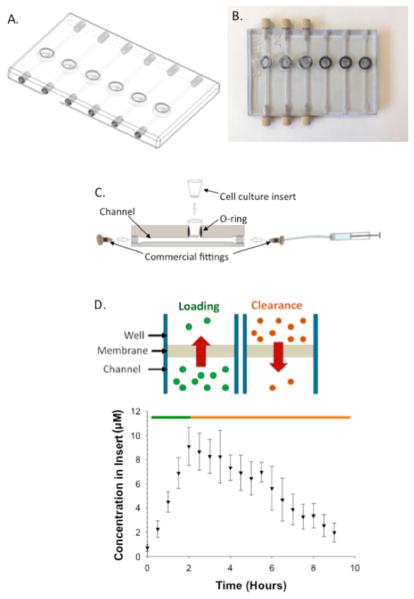
The designs for device development were created in-house by use of AutoDesk Inventor Professional Student Edition (AutoDesk, San Rafael, CA). Figure 1A is an image of the .STL file, while Figure 1B is an image of the polished 3D device. Devices were fabricated in a 24-well plate format, containing six fluidic channels (2 mm × 2 mm). The device was designed such that each channel contained a single Transwell insert, as shown in Figure 1C. Threaded inlets and outlets were printed into the device to enable connections with pumps. The threaded inlets and outlets also enabled a male luer fitting (F-120, IDEX Health and Science, Oak Harbor, WA) to be directly screwed into the device without the need of a female adaptor. The male luer fitting was connected to 5 mL syringes (Hamilton Co., Reno, NV) by use of fused silica capillary tubing (536 μm i.d., 669.7 μm o.d.; Polymicro Technologies, Phoenix, AZ). The syringes were then fitted to syringe pumps that were used to administer drug(s) or reagent(s) to the device at controlled flow rates. All experiments were performed at room temperature, approximately 22 °C.
Figure 1.
Three-dimensional printed device and general operating principle (A) .STL file of the dynamic in vitro model (DIVM) after it was designed in Autodesk Inventor Professional Student Edition. (B) Top view image of the polished 3D printed device composed of VeroClear body and TangoBlack O-rings. The left three channels demonstrate the integration of commercially available fittings into the 3D printed threads and Transwell membrane inserts into the O-rings. (C) Cross section of a channel of the DIVM, illustrating the integration of commercially available inserts and fittings. (D) (Top) Schematic demonstrating the concepts of loading (green) and depletion (orange) within the device based on concentration gradients. (Bottom) Pharmacokinetic curve obtained on the device by loading with 30 μM fluorescein for 2 h (green) before flushing the system with water for the remaining 7 h (orange). n ≥ 4; error standard deviation.
Sample Preparation and Plate Reader Analysis of Fluorescein
Diffusion from the channels through the porous insert was first characterized with fluorescein. Various concentrations (7.5, 15, and 30 μM) of fluorescein were prepared by diluting a stock solution of fluorescein with deionized (DI) water. A representative PK curve generated with 30 μM fluorescein is shown in Figure 1D. The concentrated fluorescein solutions were pumped through the device at various flow rates (5, 10, and 15 μL/min), but most studies were performed at a constant flow rate of 10 μL/min. Cell culture inserts (0.4 μm pore diameter polyester, Corning Incorporated, Corning, NY) were placed into the wells and filled with 75 μL of DI water. When fluorescein was being pumped, 5 μL aliquots were sampled from the insert, added to a 96-well plate, and diluted with 100 μL of DI water. Depending on the desired Cmax, the fluorescein solution flowing through the device channels was changed over to DI water (Figure 1D), starting the depletion process; 5 μL aliquots were still removed during this stage in order to quantitatively determine the diffusion of fluorescein from the well insert back into the channel. Fluorescence was detected by use of a commercial plate reader (excitation/emission 480/520 nm; Spectramax M4, Molecular Devices, Sunnyvale, CA).
Sample Preparation and Multiple Reaction Monitoring Mass Spectrometric Analysis of Levofloxacin
After characterization of the device with fluorescein, levofloxacin, an antibiotic, was used to generate a PK curve with a commercially available drug. Levofloxacin (361.37 g/mol) was also chosen as the drug molecule on the basis of its established PK profiles and similar molecular weight as fluorescein. Prior to generation of PK curves, levofloxacin standard solutions were prepared at concentrations ranging from 100 nM to 4 μM in a physiological salt solution (PSS) [2.0 mM CaCl2, 4.7 mM KCl, 11.1 mM dextrose, 12 mM MgSO4, 21.0 mM tris(hydroxymethyl)-aminomethane, and 140.5 mM NaCl (final pH 7.4)]. Similar to the fluorescein characterization studies, a flow rate of 10 μL/min was used to propel the drug solutions, although 75 μL of PSS (rather than water) was added to the well insert. Aliquots of 5 μL were sampled every 30 min and diluted with 80 μL of cold acetonitrile (Mallinckrodt Chemicals, Phillipsburg, NJ) containing an internal standard, ciprofloxacin (750 nM). Upon centrifugation (500g for 10 min) to remove any precipitants, the supernatant was removed, and the samples were added to a 96-well polycarbonate plate (Denville, Metuchen, NJ). After the polycarbonate plate was sealed with a RapidEPS seal (BioChromato, Fujisawa, Japan), the samples were analyzed on a Shimadzu high performance liquid chromatograph (HPLC) coupled to a multiple reaction monitoring (MRM) tandem mass spectrometer (MS/MS) with electrospray ionization (ESI) using a Waters Quattro Micro triple-quadrupole mass spectrometer. A 10 μL sample from the sealed 96-well plate was injected into a Supelco Ascentis precolumn that preceded a Supelco Ascentis Express C18 column (length 3 cm, i.d. 2.1 mm, particles 2.7 μm; Supelco, Bellefonte, PA). The samples were partitioned through the following gradient at 0.45 mL/min: 95% A, 0% B for 0.25 min; 2% A, 0% B at 1.00 min; 2% A, 0% B at 1.25 min; 30% A, 15% B at 1.75 min; 30% A, 15% B at 1.90 min; 95% A, 0% B at 2.00 min. Solvent A is methanol, solvent B is acetonitrile, and solvent C is 1% formic acid in water. The retention times were 1.51 and 1.48 min for ciprofloxacin and levofloxacin, respectively. Cone voltages were 25 and 30 V while collision energies were 40 and 30 eV for ciprofloxacin and levofloxacin, respectively. The collision gas, argon, had a pressure of 1.96 × 10⁻³ Torr. The monitored MRM transitions were 332.11 > 231.06 (ciprofloxacin) and 362.11 > 234.05 (levofloxacin). Calibration was obtained by plotting the ratio of levofloxacin peak area to ciprofloxacin peak area against the concentration of standard by use of the Waters MassLynx software (Milford, MA). Linear regression was used to obtain an equation from which concentrations in samples were obtained from the response ratios.
RESULTS AND DISCUSSION
Characterization of Device Parameters
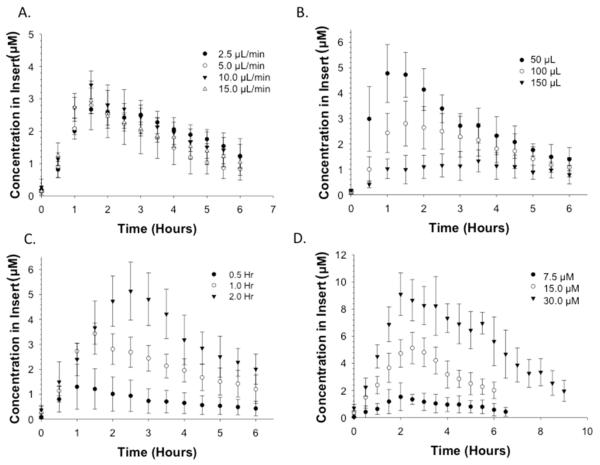
Various parameters affecting the front portion of the PK curve including flow rate, initial volume in the insert well, time, and initial concentrations are shown in Figure 2. Because the device itself is designed to function as a diffusion-based model, flow rate should not be a determinant in the generated profile. All of the aforementioned parameters were investigated for validation purposes with fluorescein as a test molecule (diffusion coefficient of fluorescein in water is 4.25 × 10⁻⁶ cm2·s−1).51
Figure 2.
PK profiles resulting from varying device parameters. (A) Varying flow rate (2.5, 5.0, 10, and 15 μL/min) with fixed initial concentration of fluorescein (15 μM), loading time (1 h), and volume in insert (75 μL). PK curves were statistically the same (p > 0.05). (B) Varying volume in insert (50, 100, and 150 μL) with identical loading time (1 h), flow rate (10 μL/min), and initial concentration (15 μM) (p < 0.01). (C) Varying loading time (0.5, 1.0, and 2.0 h) of fluorescein with fixed initial concentration (15 μM), flow rate (10 μL/min), and volume in insert (75 μL). (p < 0.01). (D) Varying initial concentration of fluorescein (7.5, 15, and 30 μM) with fixed loading time (1 h), flow rate (10 μL/min), and volume in insert (75 μL). p ≤ 0.001; n ≥ 4; error standard deviation for all curves shown.
The effect of flow rate (Figure 2A) on the PK profile was determined by maintaining the initial concentration of fluorescein in the delivery syringe at 15 μM, the volume of buffer in the insert at 75 μL, and the loading time at 1 h while the flow rate was varied (2.5, 5.0, 10, and 15 μL/min). Aliquots (5 μL) were removed from the solution in the insert every 0.5 h, stored, and quantitatively determined by fluorescence emission signals from the fluorescein that had diffused from the device channel through the pores of the insert and into the well. The PK profiles obtained at different flow rates are shown in Figure 2A. The average Cmax value (2.96 ± 0.33 μM) for each of these profiles was determined and, importantly, each Cmax value was statistically equal (p > 0.05), even at different flow rates. Therefore, the flow rate, within the indicated range, does not have an impact on the overall Cmax.
The starting volume of solvent in the insert will influence the overall PK profile, and subsequent Cmax, due to differences in dilution experienced by the molecule diffusing from the channel. Molecules diffusing into a larger volume will yield an overall lower Cmax, in comparison to an insert containing a smaller volume over equivalent loading times. The loading time (1 h), initial concentration of fluorescein (15 μM), and flow rate (10 μL/min) were all held constant while the initial volume of DI water in the insert (50, 100, and 150 μL) at the beginning of the experiment was varied. As the initial volume of water in the insert well decreased, the measured concentration of fluorescein in the insert increased. As shown in Figure 2B, a Cmax of 4.8 ± 1.1 μM was determined after an hour of loading when the initial volume in the insert was 50 μL. When the volume in the insert was increased to 150 μL, under the same conditions, the Cmax was significantly reduced to 1.0 ± 0.4 μM (p < 0.01, n ≥ 4). Therefore, it was determined that the starting volume of the liquid in the insert is crucial to the overall design and associated predictive models of the PK curves obtained from the diffusion-based DIVM.
The Cmax values were also determined as a function of loading time, or the duration of time fluorescein was pumped through the device channels prior to delivery of a fluorescein-free buffer. A longer loading time will enable an increased amount of material to diffuse through the membrane pores and into the well insert. Loading times of 0.5, 1.0, and 2.0 h were investigated, and aliquots of sample were collected and quantitatively determined as described above for the flow rate studies. The initial concentration (15 μM) and flow rate (10 μL/min) were held constant through the duration of the experiment, the results of which are shown in Figure 2C. After 0.5 h of flow, there was a measured Cmax of 1.3 ± 0.9 μM, whereas after delivery of the fluorescein solution for 2 h, the Cmax increased almost 4-fold to 5.1 ± 1.2 μM.
The concentration of the diffusing molecule in the syringe (and thus, that delivered through the device channels) will also have an effect on the concentration in the well. This effect was determined by varying the concentration of fluorescein loaded in the syringe, while maintaining a constant flow rate (10 μL/min), loading time (1 h), and volume in the insert (75 μL). As shown in Figure 2D, the Cmax values in the well insert increased as the starting concentration of fluorescein in the syringe pump was increased. A Cmax of 1.5 ± 1.0 μM was reached when the starting concentration of fluorescein was 7.5 μM, while the syringe containing 30 μM fluorescein resulted in a Cmax of 9.1 ± 1.6 μM.
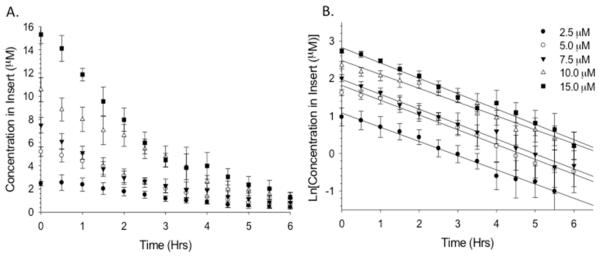
Other parameters affecting the depletion portion of the PK curve, Cmax, and t1/2 were examined and are shown in Figure 3. Elimination of the drug from the body is represented by depletion curves, most of which display first-order kinetics. Therefore, it is necessary that the diffusion-based DIVM display characteristics of a first-order elimination. The elimination profile of the device was determined by adding 75 μL of fluorescein (ranging from 2.5 to 15 μM) to the insert well, followed by delivery of DI water through the channel for 6 h. This allowed determination of the rate of fluorescein depletion (diffusion) from the insert into the channel (Figure 3A). The linearity of the elimination curves, generated by plotting the natural log of the concentration in the insert (Figure 3B) as a function of time, indicates that the depletion is a first-order elimination. The slope of the aforementioned lines is the elimination rate constant, KEL, which can be used to determine the half-life (t1/2) of the drug (t1/2 = 0.693/KEL). The half-life, a key PK parameter, is the time required for the drug to reach half of its original concentration, with five half-lives indicating total clearance. The half-lives corresponding to 2.5, 5, 7.5, 10, and 15 μM were 2.2 ± 0.8, 1.9 ± 0.8, 1.8 ± 0.5, 1.9 ± 0.3, and 1.73 ± 0.3 h, respectively (n ≥ 4; errors indicate standard deviation). The measured half-lives were statistically equal (p > 0.05), thus indicating first-order elimination profiles.
Figure 3.
Depletion profiles of fluorescein in the 3D printed device demonstrating first-order elimination. (A) Depletion profile generated from loading various concentrations of fluorescein into the insert while DI water flowed through the channel. (B) Natural log of concentration in the insert vs time, yielding information such as reaction order, elimination rate constant, and half-life. The resulting half-lives were all statistically the same, indicating first-order elimination (p > 0.05). n ≥ 4; error and error bars indicate standard deviation.
Generation of Predictive Models
A key component to the success of the device is the need to predict concentrations, such as Cmax, at different time points along the PK profile. Such a model would enable one to control the area under the curve (AUC), or a Cmax that would affect cells or tissues of interest. The empirically generated parameters, reported in Figure 2, were used to generate a predictive model of Cmax. Initially, the predicted concentration of fluorescein in the insert at a specific time point was determined using regression statistics from the data in Figure 2. For example, the slopes derived from the loading portions of the PK curves shown in Figure 2D were obtained and denoted as the loading rates. The loading rates were plotted with respect to the corresponding concentration in the syringe. The slope from the plot of loading rate as a function of starting concentration was then used to predict the initial concentration that should be delivered through the channel to generate a specific concentration at a particular time in the PK profile. To test the model, a concentration of 6.5 μM was desired in the insert wells at time points of 5, 10, 15, 20, and 25 min, thereby requiring the initial concentrations of fluorescein in the syringe to be 508.8, 254.4, 169.3, 127.3, and 101.8 μM, respectively (Figure 4). Table 1 shows the predicted values falling within statistical agreement with the obtained values, with error ranging from <1% to <8% of the predicted value.
Figure 4.
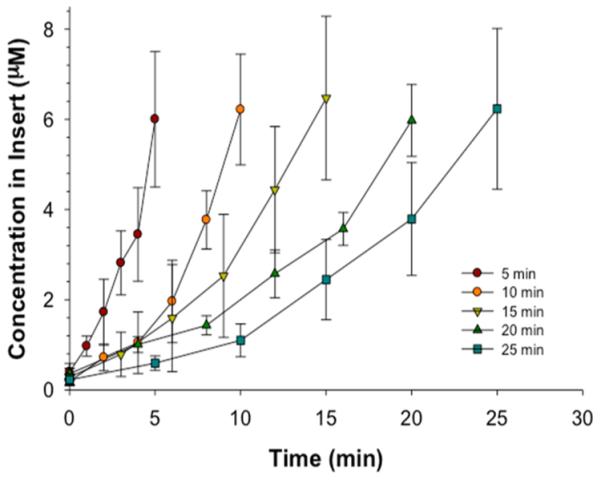
Control of loading profile demonstrated with empirically determined relationships. Based upon loading times of 5, 10, 15, 20, 25 min and a theoretical desired concentration of 6.5 μM, various initial concentrations of fluorescein were obtained. At each loading time, the observed concentration was statistically equivalent to 6.5 μM (p > 0.05); n ≥ 4; error bars indicate standard deviation.
Table 1.
Robustness of Empirical Prediction Modela
| concn (μM) |
||
|---|---|---|
| loading time (min) | initial | exptl |
| 5 | 508.8 | 6.0 ± 1.5 |
| 10 | 254.4 | 6.2 ± 1.2 |
| 15 | 169.3 | 6.5 ± 1.8 |
| 20 | 127.3 | 6.0 ± 0.8 |
| 25 | 101.8 | 6.2 ± 1.8 |
Loading times and corresponding starting concentrations of fluorescein in the syringe represent the experimental parameters and results of Figure 4. The experimental concentration in the insert was equivalent to the theoretical desired concentration of 6.5 μM within the required loading time (p > 0.05); n ≥ 4; error bars indicate standard deviation.
Next, the prediction model was implemented to apply to a full PK curve with depletion (Figure 5) for the antibiotic levofloxacin. Levofloxacin was chosen due to its similar molecular weight to fluorescein, as well as a comparable diffusion coefficient in water52 (5.01 × 10⁻⁶ cm2·s−1); therefore, a solution of levofloxacin having a concentration of 167.7 μM was prepared by use of the prediction model. Based on the model, a concentration of 25.6 μM was predicted at 1 h, with the determined experimental value statistically equal to 29.3 ± 5.2 μM.
Figure 5.
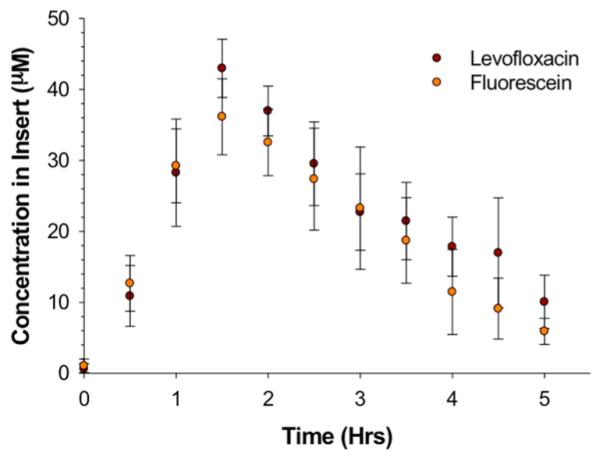
Proof of concept for the prediction model for concentration along the loading portion of the PK curve. The proof of concept of the prediction model is tested by choosing a drug that has a molecular mass comparable to that of fluorescein, here levofloxacin. The desired concentration was 25.6 μM with a loading time of 1 h. The concentration in the syringes, derived from the prediction model for 1 h of flow, was 167.3 μM. Experimentally, fluorescein and levofloxacin were statistically the same, and at 1 h the concentration was within error of the theoretical concentration. Importantly, the experimental Cmax is 43.0 ± 4.1 μM. n ≥ 4; p > 0.05; error bars indicate standard deviation.
While the model seems capable of predicting accurate concentrations at particular points in the PK profile based on starting concentrations in the pumping syringe, there are limitations to the current method. For example, although the model was able to predict concentrations at various times along the PK curve, Cmax generally occurred at times beyond our predicted values. For the levofloxacin PK curve shown in Figure 5, Cmax occurred at 1.5 h and at a concentration of 36.1 ± 5.3 μM. In other words, despite having stopped the flow of concentrated levofloxacin, clearing the channels with buffer, and pumping levofloxacin-free buffer at exactly 1 h, the amount of drug diffusing through the membrane pores into the insert well continued to increase for an additional 30 min. Figure 6 provides evidence that the molecules of interest, being pumped through the device, are readily being absorbed into the material from which the device is fabricated, resulting in molecules leaching out of the device into the channels during the depletion period and subsequently continuing to diffuse through the insert pores. One of the main drawbacks of 3D printing is a limitation of materials, with the composition of the aforementioned materials being proprietary. To correct for analyte absorption (2.5 μM) in the device walls (Table 2), adjusted concentrations were determined by use of Figure 6 (4.33 μM) to obtain the desired experimental concentration (2.97 ± 0.50 μM) in the open well. A future manipulation of the device to limit the absorbance of compounds into the material would entail coating with channels of the device with polymers, such as polystyrene, to reduce compound transfer.
Figure 6.
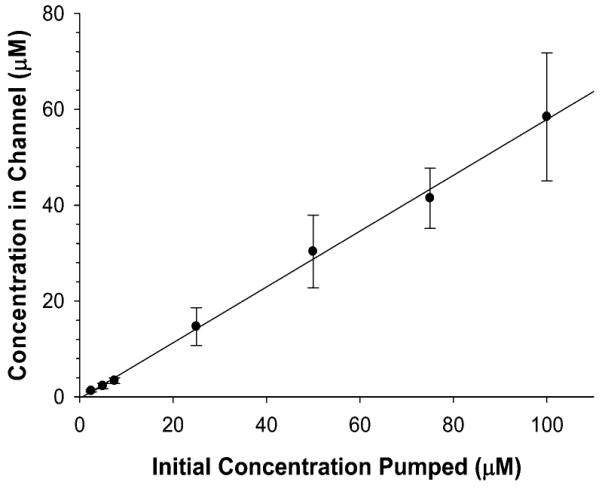
Impact of absorption of fluorescein into the material of the device, analyzed by flowing various concentrations (2.5–100 μM) through the 3D printed device and sampling from open well, which generally contains the insert. The linear effect observed in the graph enables a mathematical model to be applied to correct for the absorption of fluorescein. n ≥ 4; error bars indicate standard deviation.
Table 2.
Desired Experimental Concentration in the Open Well, Corrected for Analyte Absorption in the Device Wallsa
| concn (μM) | |||
|---|---|---|---|
| desired | prev exptl | corr initial | corr exptl |
| 2.5 | 1.25 ± 0.22 | 4.33 | 2.97 ± 0.50 |
| 5.0 | 2.24 ± 0.56 | 8.66 | 4.66 ± 0.45 |
| 7.5 | 3.35 ± 0.60 | 12.99 | 7.89 ± 1.42 |
Upon choosing various desired concentrations in the channel (e.g., 2.5, 5.0, and 7.5 μM) and correcting the concentrations by use of slope derived from Figure 6, solutions were flowed through the device, and experimental concentrations in the open well were obtained. Each experimental concentration was theoretically within error of the desired concentration. n ≥ 4; p > 0.05; error standard deviation.
CONCLUSIONS
There is great potential for in vitro PK models to significantly impact the drug discovery process by supplementing in vivo studies in the preclinical stage. Current in vitro PK platforms consume large quantities of medium and have low throughput. The described device reduces the volume consumption from liters to milliliters, while the device’s amenability to automation enables the simultaneous collection of six PK profiles. Various parameters, such as Cmax, loading concentration, depletion, and t1/2, were characterized on this device, which mimics certain aspects of in vivo PK curves. Along with characterization, the concentration and Cmax values could be both manipulated and predicted depending upon loading time and initial concentration. The aforementioned device, when coupled with in vivo studies, has the potential to increase the efficiency of the drug discovery process while simultaneously reducing the materials and cost associated with the preclinical approval process.
ACKNOWLEDGMENTS
This work was supported by funding from Merck and from NIH (R01-GM110406). We acknowledge Brian Wright and the Department of Electrical and Computer Engineering at Michigan State University for their assistance in 3D printing of the devices. We thank the Michigan State University RTSF Mass Spectrometry Core for their assistance with the sample analysis.
Footnotes
Notes
The authors declare no competing financial interest.
REFERENCES
- (1).PhRMA 2013 Industry Profile. Pharmaceutical Research and Manufacturers of America; 2013. pp. 1–78. http://www.phrma.org/sites/default/files/pdf/PhRMA%20Profile%202013.pdf. [Google Scholar]
- (2).Paul SM, Mytelka DS, Dunwiddie CT, Persinger CC, Munos BH, Lindborg SR, Schacht AL. Nat. Rev. Drug Discovery. 2010;9:203–214. doi: 10.1038/nrd3078. [DOI] [PubMed] [Google Scholar]
- (3).DiMasi JA, Grabowski HG. Manag. Decis. Econ. 2007;28:469–479. [Google Scholar]
- (4).Kaitin K. Clin. Pharmacol. Ther. 2010;87:356–361. doi: 10.1038/clpt.2009.293. [DOI] [PMC free article] [PubMed] [Google Scholar]
- (5).Adams CP, Brantner VV. Health Affair. 2006;25:420–428. doi: 10.1377/hlthaff.25.2.420. [DOI] [PubMed] [Google Scholar]
- (6).Dickson M, Gagnon JP. Nat. Rev. Drug Discovery. 2004;3:417–429. doi: 10.1038/nrd1382. [DOI] [PubMed] [Google Scholar]
- (7).Gloede J, Scheerans C, Derendorf H, Kloft C. J. Antimicrob. Chemother. 2010;65:186–201. doi: 10.1093/jac/dkp434. [DOI] [PubMed] [Google Scholar]
- (8).Boshoff HIM, Barry CE. Nat. Rev. Microbiol. 2005;3:70–80. doi: 10.1038/nrmicro1065. [DOI] [PubMed] [Google Scholar]
- (9).Dudley MN, Griffith D. In: Antimicrobial Pharmacodynamics in Theory and Clinical Practice. Nightingale CH, Murakawa T, Ambrose PG, editors. Marcel Dekker; New York: 2001. pp. 67–97. [Google Scholar]
- (10).Vaddady PK, Lee RE, Meibohm B. Future Med. Chem. 2010;2:1355–1369. doi: 10.4155/fmc.10.224. [DOI] [PMC free article] [PubMed] [Google Scholar]
- (11).Mehta PK, King CH, White EH, Murtagh JJ, Jr., Quinn FD. Infect. Immun. 1996;64:2673–2679. doi: 10.1128/iai.64.7.2673-2679.1996. [DOI] [PMC free article] [PubMed] [Google Scholar]
- (12).MacGowan A, Bowker K. Int. J. Antimicrob. Agents. 2002;19:291–298. doi: 10.1016/s0924-8579(02)00027-4. [DOI] [PubMed] [Google Scholar]
- (13).Garrett ER, Wright OK, Miller GH, Smith KL. J. Med. Chem. 1966;9:203–208. doi: 10.1021/jm00320a011. [DOI] [PubMed] [Google Scholar]
- (14).Li RC, Zhu M, Schentag JJ. Clin. Pharmacokinet. 1999;37:1–16. doi: 10.2165/00003088-199937010-00001. [DOI] [PubMed] [Google Scholar]
- (15).Nolting A, Dalla Costa T, Rand KH, Derendorf H. Pharm. Res. 1996;13:91–96. doi: 10.1023/a:1016085402278. [DOI] [PubMed] [Google Scholar]
- (16).Schentag J. J. Chemother. 1999;11:426–439. doi: 10.1179/joc.1999.11.6.426. [DOI] [PubMed] [Google Scholar]
- (17).Schentag JJ. Am. J. Health-Syst. Pharm. 1999;56:S21–S24. doi: 10.1093/ajhp/56.suppl_3.S21. [DOI] [PubMed] [Google Scholar]
- (18).Mueller M, de la Pena A, Derendorf H. Antimicrob. Agents Chemother. 2004;48:369–377. doi: 10.1128/AAC.48.2.369-377.2004. [DOI] [PMC free article] [PubMed] [Google Scholar]
- (19).White RL. Pharmacotherapy. 2001;21:292S–301S. doi: 10.1592/phco.21.18.292s.33906. [DOI] [PubMed] [Google Scholar]
- (20).Katsube T, Yano Y, Yamano Y, Munekage T, Kuroda N, Takano M. J. Pharm. Sci. 2008;97:4108–4117. doi: 10.1002/jps.21265. [DOI] [PubMed] [Google Scholar]
- (21).Nishida M, Murakawa T, Kamimura T, Okada N, Sakamoto H, Fukada S, Nakamoto S, Yokota Y, Miki K. J. Antibiot. 1976;29:444–459. [Google Scholar]
- (22).Bergan T, Carlsen MI, Fuglesang J. Infection. 1980;8:S96–S102. [Google Scholar]
- (23).Nies B. Eur. J. Clin. Microbiol. Infect. Dis. 1989;8:558–561. doi: 10.1007/BF01967481. [DOI] [PubMed] [Google Scholar]
- (24).Haller I. Infection. 1982;10:S229–S233. doi: 10.1007/BF01640679. [DOI] [PubMed] [Google Scholar]
- (25).Grasso S, Meinardi G, De Carneri I, Tamassia V. Antimicrob. Agents Chemother. 1978;13:570–576. doi: 10.1128/aac.13.4.570. [DOI] [PMC free article] [PubMed] [Google Scholar]
- (26).Löwdin E, Odenholt I, Bengtsson S, Cars O. Antimicrob. Agents Chemother. 1996;40:2478–2482. doi: 10.1128/aac.40.11.2478. [DOI] [PMC free article] [PubMed] [Google Scholar]
- (27).Toothaker RD, Welling PG, Craig WA. J. Pharm. Sci. 1982;71:861–864. doi: 10.1002/jps.2600710805. [DOI] [PubMed] [Google Scholar]
- (28).Drugeon H, Maurisset B, Chung S, Courtieu A. Pathol. Biol. 1982;30:837–839. [PubMed] [Google Scholar]
- (29).Guggenbichler JP, Semenitz E, König P. J. Antimicrob. Chemother. 1985;15:139–146. doi: 10.1093/jac/15.suppl_a.139. [DOI] [PubMed] [Google Scholar]
- (30).Konig P, Guggenbichler J, Semenitz E, Foisner W. Chemotherapy. 1986;32:44–58. doi: 10.1159/000238388. [DOI] [PubMed] [Google Scholar]
- (31).Vance-Bryan K, Larson TA, Garrison MW, Toscano JP, Canafax DM, Rotschafer JC. Pharm. Res. 1992;9:920–924. doi: 10.1023/a:1015857117433. [DOI] [PubMed] [Google Scholar]
- (32).Hulten K, Rigo R, Gustafsson I, Engstrand L. Antimicrob. Agents Chemother. 1996;40:2727–2731. doi: 10.1128/aac.40.12.2727. [DOI] [PMC free article] [PubMed] [Google Scholar]
- (33).Birkness KA, Swisher BL, White EH, Long EG, Ewing E, Quinn FD. Infect. Immun. 1995;63:402–409. doi: 10.1128/iai.63.2.402-409.1995. [DOI] [PMC free article] [PubMed] [Google Scholar]
- (34).Birkness K, Deslauriers M, Bartlett J, White E, King C, Quinn F. Infect. Immun. 1999;67:653–658. doi: 10.1128/iai.67.2.653-658.1999. [DOI] [PMC free article] [PubMed] [Google Scholar]
- (35).Shaw J, Falkow S. Infect. Immun. 1988;56:1625–1632. doi: 10.1128/iai.56.6.1625-1632.1988. [DOI] [PMC free article] [PubMed] [Google Scholar]
- (36).Shaw JH, Hayes F, Brooks GF, Falkow S. In: Gonococci and Meningococci. Poolman JT, editor. Kluwer; Dordrecht, The Netherlands: 1988. pp. 441–447. [Google Scholar]
- (37).Blaser J, Stone B, Zinner S. Antimicrob. Agents Chemother. 1985;27:343–349. doi: 10.1128/aac.27.3.343. [DOI] [PMC free article] [PubMed] [Google Scholar]
- (38).Blaser J, Stone BB, Groner MC, Zinner SH. Antimicrob. Agents Chemother. 1987;31:1054–1060. doi: 10.1128/aac.31.7.1054. [DOI] [PMC free article] [PubMed] [Google Scholar]
- (39).Blaser J, Vergères P, Widmer AF, Zimmerli W. Antimicrob. Agents Chemother. 1995;39:1134–1139. doi: 10.1128/aac.39.5.1134. [DOI] [PMC free article] [PubMed] [Google Scholar]
- (40).Duffy DC, McDonald JC, Schueller OJA, Whitesides GM. Anal. Chem. 1998;70:4974–4984. doi: 10.1021/ac980656z. [DOI] [PubMed] [Google Scholar]
- (41).McDonald JC, Duffy DC, Anderson JR, Chiu DT, Wu H, Schueller OJA, Whitesides GM. Electrophoresis. 2000;21:27–40. doi: 10.1002/(SICI)1522-2683(20000101)21:1<27::AID-ELPS27>3.0.CO;2-C. [DOI] [PubMed] [Google Scholar]
- (42).Kang L, Chung BG, Langer R, Khademhosseini A. Drug Discovery Today. 2008;13:1–13. doi: 10.1016/j.drudis.2007.10.003. [DOI] [PMC free article] [PubMed] [Google Scholar]
- (43).Neuži P, Giselbrecht S, Länge K, Huang TJ, Manz A. Nat. Rev. Drug Discovery. 2012;11:620–632. doi: 10.1038/nrd3799. [DOI] [PMC free article] [PubMed] [Google Scholar]
- (44).Erkal JL, Selimovic A, Gross BC, Lockwood SY, Walton EL, McNamara S, Martin RS, Spence DM. Lab Chip. 2014;14:2023–2032. doi: 10.1039/c4lc00171k. [DOI] [PMC free article] [PubMed] [Google Scholar]
- (45).Gross BC, Erkal JL, Lockwood SY, Chen C, Spence DM. Anal. Chem. 2014;86:3240–3253. doi: 10.1021/ac403397r. [DOI] [PubMed] [Google Scholar]
- (46).Anderson KB, Lockwood SY, Martin RS, Spence DM. Anal. Chem. 2013;85:5622–5626. doi: 10.1021/ac4009594. [DOI] [PubMed] [Google Scholar]
- (47).Chen C, Wang Y, Lockwood SY, Spence D. Analyst. 2014;139:3219–3226. doi: 10.1039/c3an02357e. [DOI] [PubMed] [Google Scholar]
- (48).Fish DN, Chow AT. Clin. Pharmacokinet. 1997;32:101–119. doi: 10.2165/00003088-199732020-00002. [DOI] [PubMed] [Google Scholar]
- (49).Davis R, Bryson H. Drugs. 1994;47:677–700. doi: 10.2165/00003495-199447040-00008. [DOI] [PubMed] [Google Scholar]
- (50).Preston S, Drusano G, Berman A, Fowler C, Chow AT, Dornseif B, Reichl V, Natarajan J, Corrado M. JAMA, J. Am. Med. Assoc. 1998;279:125–129. doi: 10.1001/jama.279.2.125. [DOI] [PubMed] [Google Scholar]
- (51).Culbertson CT, Jacobson SC, Ramsey JM. Talanta. 2002;56:365–373. doi: 10.1016/s0039-9140(01)00602-6. [DOI] [PubMed] [Google Scholar]
- (52).Vrany J, Stewart P, Suci P. Antimicrob. Agents Chemother. 1997;41:1352–1358. doi: 10.1128/aac.41.6.1352. [DOI] [PMC free article] [PubMed] [Google Scholar]


