

Abstract
Objective:
The main aim of this study was to investigate the factor structure and psychometric properties of the Brief Illness Perception Questionnaire (BIPQ) in Turkish cancer patients.
Methods:
This methodological study involved 135 cancer patients. Statistical methods included confirmatory or exploratory factor analysis and Cronbach alpha coefficients for internal consistency.
Results:
The values of fit indices are within the acceptable range. The alpha coefficients for emotional illness representations, cognitive illness representations, and total scale are 0.83, 0.80, and 0.85, respectively.
Conclusions:
The results confirm the two-factor structure of the Turkish BIPQ and demonstrate its reliability and validity.
Keywords: Cancer, factor structure, illness perception, oncology, patient, psychometric properties

Introduction
When individuals are diagnosed with any illness, they usually develop different beliefs about their own situation. These beliefs form the illness perceptions of individuals. The concept of illness perception is related to how a person perceives the illness as well as the cognitive structuring of the status of being ill. In other words, illness perception is the cognitive image of being ill or the cognitive and emotional representations or beliefs of patients about the illness.[1,2,3,4]
These cognitive and emotional models also include beliefs about the treatment and control of the situation. These models create the illness perception, which is shaped by the patients’ experiences, knowledge levels, values, beliefs, and needs. The patients’ interpretation, perception, and evaluation of their illness are the determinants of their emotional and behavioral reactions, how they handle their situation, the psychosocial stress, and the development of psychiatric disorders and quality of life. Thus, the concept of illness perception, which has gained importance in recent years, is are markable factor in understanding and managing cancer and other chronic diseases.[1,2,3,4] With an increase in its prevalence, cancer has negative effects on patients’ lives in the physical, psychological, and socioeconomic terms. The reason for this negative effect is that people perceive cancer as a serious and chronic disease that causes desperation and uncertainty. Illness perception has a direct influence on the emotional response to the illness, adaptation to the treatment and functional wellness state.[4,5,6] Patients who have a negative perception of their disease have more functional and emotional in sufficiencies in later stages, and their recovery process is slower than that of other patients.[7,8,9,10,11] Improvements in cancer diagnosis or treatment mean that more cancer patients will be come long-term survivors. Cancer patients face persistent difficulties with physical and psychological health as well as impaired quality of life because the late effects of cancer treatment may last a life time[12,13,14] and poor adaptation to these effects escalate health care demand and costs. Patients’ perceptions of their illness may influence illness outcomes.[15] The residual effects of cancer and its treatments can exert significant coping demand on survivors. Documenting the connections between cancer survivors’ illness perceptions and adaptation outcomes can inform cost-effective, targeted interventions, which can minimize stress and enhance long-term survivorship care.[16] Given these results, determining illness perception is necessary to better understand, control, and treat the current and possible psychosocial problems of cancer patients who have specific characteristics and other patients with physical illnesses. Accordingly, a positive change in the illness perceptions of patients with chronic diseases will enable them to manage themselves, handle the emotional state created by the illness, and overcome the daily stress that goes hand in hand with the illness. Downe-Wamboldt et al. investigated lung cancer patients and showed that perception of illness manage ability mainly determines the quality of life. Total QOL in patients with lung cancer is predicted most by meaning of illness, specifically, the illness being perceived as manageable. Quality of life in cancer patients and their caregivers is formed by meaning of illness[17] Sarna conducted a qualitative analysis of cancer patients and explained the serious disruptions in psychological and social aspects of quality of life. Negative effects of illness, depressed mood, distress, family distress, and sexual problems are highly prevalent.[18] Thong et al. reported that illness perceptions are associated with mortality among 1552 colorectal cancer survivors. These perceptions motivated the cancer patients’ self-management behavior toward symptoms and treatment that influence health outcomes. Negative illness perceptions have been associated with increased mortality in other chronically ill groups.[19] In all these studies, the survivors have completed the Brief Illness Perception Questionnaire (BIPQ). Richardson et al. assessed the changes overtime in head and neck cancer patients and the caregivers’ illness perceptions and relationships with quality of life. A total of 42 patient–caregiver dyads have completed the BIPQ during the diagnosis and again 6 months later. The perceptions of emotional effect and illness concern are reduced overtime inpatients and caregivers. The perceptions of treatment control and identity have increased in caregivers only. After controlling for the effects of baseline health-related quality of life (HRQL) and the individual contribution of patient and caregiver illness perceptions, greater discrepancy in perceptions of the timeline, personal control, and illness identity among dyads during the diagnosis had predicted lower patient HRQL at the 6-month follow-up.[20] Zhang et al. documented the cross-sectional associations among illness perceptions, physical symptom distress, and dispositional optimism in cancer survivors. Survivors of different cancers recruited within 6 months of completion of adjuvant therapy have completed the BIPQ. As a result, illness perceptions do not differ by cancer type. Higher levels of physical symptom distress and lower levels of optimism are shown with more negative illness perceptions.[16] Considering all these points, nurses, in particular, should have an in-depth understanding of the problems that may be experienced by patients with chronic diseases such as cancer, develop their coping mechanisms, and identify their illness perceptions. For this reason, the authors have conducted reliability and validity analyses of this scale, which was created to evaluate the illness perceptions of patients, so that it can be used in hospitals in Turkey to enable holistic evaluations of patients.
Methods
Participants and design
This methodological study intends to assess the validity and reliability of the Turkish version of the BIPQ. This study was conducted with 135 cancer patients in a university hospital in Turkey. The patients were older than 18 years of age, literate, agreed to participate in the study and did not exhibit any psychological/psychiatric problems.
Opinions about the sufficient size of a sample in the relevant literature differ. Hatcher argued that at least 500 items were sufficient for a sample of 100 participants.[21] Comrey and Lee stated that 100 was weak, 200 was moderate, 300 was good, 500 was very good, and 1000 was perfect for a sample size.[22] Guilford reported that the sample size was supposed to be at least 200 in sample creation studies.[23] Nunually argued that the sample size must be 10 times larger than the number of items in factor analysis,[24] Gorusch stated that it must be 15 times larger,[25] and Tavsancil reported that it should be between 5 and 10 times.[26] Based on these ideas, the authors included 135 patients in the study because the scale has 8 items; thus, the number of items must be at least 15 times larger, and unexpected losses can occur.[25] Among the participants, 43% (n = 58) were females and 57% (n = 77) were males. The average age of the participants was 56.37±12.15 years.
Data collection tools
The study data were collected using the participant information form and the BIPQ.
Participant information form
The participant information form includes queries about the participants’ social demographic characteristics, knowledge level of the illness process, and illness duration at diagnosis.
Brief Illness Perception Questionnaire
The BIPQ was developed by Broadbent et al. in 2006. This scale includes eight items and an additional item, which investigates the causal factors. Eight items on the scale, except for the ninth item investigating the causal factors, had a Likert- type scoring between 0 and 10. The first 5-item form the cognitive illness representations, namely, consequences (Item 1), timeline (Item 2), personal control (Item 3), treatment control (Item 4), and identity (Item 5). Two of the items form the emotional illness perceptions, namely, concern (Item 6) and emotions (Item 8). One item assesses illness coherence (Item 7). The assessment of the causal representation is through an open-ended response, which asks patients to list the most important causal factors of their illness (Item 9). Scores on the scales how threatening the illness is or how relaxed the person is regarding the illness. In computing the score, the scores of Items 3, 4, and 7 are reversed and added to that of Items 1, 2, 5, 6, and 8. A higher score reflects that a person feels more threatened by the illness.[27]
Language equivalence of the Brief Illness Perception Questionnaire
The questionnaire was translated into Turkish separately by three English and Turkish speakers to ensure the language equivalence of the scale. The authors evaluated the three translations, identified the most suitable statements, and made a single translation using them. Then, the authors prepared a presentation form and asked the opinions of the experts about the questionnaire. The experts were asked to score each item on the presentation form to determine the consistency between the English and Turkish items of the questionnaire as well as the comprehensibility of the Turkish statements, which is between 1 and 4 according to the content validity index (CVI). In the scoring of the CVI, 1 point indicated “inappropriate,” 2 points indicated “nearly appropriate” (the item needs to be revised to be appropriate), 3 points indicated “appropriate, but needs minor changes,” and 4 points indicated “very appropriate.” Seven experts who were consulted about the questionnaire provided their opinions about its language equivalence. The authors revised the questionnaire items based on their own opinions. An English expert translated the items from Turkish to English. The expert also compared the original questionnaire, its Turkish translation, and its back-translation with each other and evaluated their appropriateness. At this stage, the expert reported that the three forms were consistent with each other.
Content validity of the Brief Illness Perception Questionnaire
The authors verified the content validity of the questionnaire items by creating a presentation form for consulting expert opinion and consulting the opinions of seven experts for language equivalence. The experts were asked to score each item on the scale between 1 and 4 regarding content validity. The authors utilized the same scoring system used for language equivalence. All of the experts provided their thoughts about the content validity of the scale. All of the experts also scored all of the items on the scale with 4-point regarding content validity. This analysis verified the content validity of the questionnaire.
Data collection
The authors conducted a pilot study to evaluate the comprehensibility of the BIPQ items and to verify the reliability of the questionnaire by computing its internal consistency. Thus, the authors asked 27 cancer patients and obtained their informed consent. The patients agreed to participate in the study on a voluntary basis. These 27 patients filled out the questionnaire and information forms and provided feed back about the comprehensibility of the items on the questionnaire. The patients did not provide any negative feed back and filled out the forms accurately. Their responses to the questionnaire form and participant information form were excluded from the results of this study. After the pilot study was completed, 135 patients who met the study criteria read and responded to the forms.
Statistical analysis
The authors analyzed the data using the IBM Corp. Released 2011. IBM SPSS Statistics for Windows, Version 20.0. Armonk, NY: IBM Corp. program and computed the distributions of frequencies and percentages and the means and standard deviations (SDs) for the variables of age and diagnosis duration. The authors tested the validity of the BIPQ by conducting validity analyses for language, content, and structure (i.e., explanatory and confirmatory factor analyses and component validity). Confirmatory factor analysis was conducted using the LISREL 8.80 program. The reliability of the BIPQ was examined using Cronbach's alpha and total item correlations. The authors used the Pearson correlation coefficient for total item correlation.
Ethical consideration
First, the authors contacted Elizabeth Broadbent, who developed the questionnaire and obtained her written consent to translate the scale into Turkish. The authors also obtained institutional approval from Gazi University Health Research and Application Center, Gazi Hospital.
Results
Descriptive characteristics
The mean age of the participants was 56.37±12.15 years. Of the patients, 57% were males, 91.9% were married, 74.1% were unemployed, 54.8% lived with their spouses and children, and 91.9% had a caregiver. Among them, 17.8% (n = 24) had gastric cancer, 16.3% (n = 22) had lung cancer, and 14.1% (n = 19) had breast cancer. The ninth question of the BIPQ, which inquired about the causal factors of the illness, asked the patients to enumerate the causes in the order of what they thought were the three most important causes of their illness. The most important cause of the illness was stress, with 33.3%.
Validity of the Brief Illness Perception Questionnaire
The authors used exploratory factor analysis (EFA) to determine the factor structure of the BIPQ. In this study, the Kaiser–Meyer–Olkin coefficient was 0.86 and Bartlett's sphericitytest (χ2) value was 472.019 (P < 0.001). The authors conducted the principal component analysis rotated to varimax (25) axis rotation using an eigen value of 1 for the eight items. The results of the EFA indicated that the factor load of one item (Item 2) was overlapped; thus, Item 2 was excluded from the questionnaire. The EFA generated a two-factor structure, which explained 67.125% of the total variance.
The results of factor analysis, which used an eigen value of 1, indicate that the scale comprises two factors, as shown in the scree plot. Factor analysis in this study showed that the emotional illness representations consisted of Items 1 (consequences), 4 (illness identity), 5 (concern), and 7 (emotions). The loadings of the items in this factor ranged between 0.697 and 0.844. Emotional illness representations explained 52.609% of the total variance. Cognitive illness representations included three items, and its factor loadings ranged between 0.694 and 0.885. Cognitive illness representations explained 14.516% of the total variance and consisted of Items 2 (personal control), 3 (treatment control), and 6 (coherence). The acceptance level for the factor loading values was limited, with 0.40.[19] Table 1 shows the factors, factor loadings, and explained variances acquired from the EFA. The authors decided that this questionnaire form was sufficient because the factor loadings of the items ranged between 0.694 and 0.885. The Cronbach's alpha coefficient of the questionnaire was 0.85.
Table 1.
The factors, factor loads and variances
| Items | Factor loads | Eigenvalues | Variance | Cumulative variance |
|---|---|---|---|---|
| Emotional illness representations | ||||
| Item 7 - How much does your illness affect you emotionally? (e.g., does it make you angry, scared, upset or depressed) (emotions) | 0.844 | 4.209 | 52.609 | 52.609 |
| Item 1 - How much does your illness affect your life? (consequences) | 0.789 | |||
| Item 5 - How concerned are you about your illness? (concern) | 0.750 | |||
| Item 4 - How much do you experience symptoms from your illness? (illness identity) | 0.697 | |||
| Cognitive ıllness representations | ||||
| Item 6 - How well do you feel you understand your illness? (coherence) | 0.885 | 1.161 | 14.516 | 67.125 |
| Item 2 - How much control do you feel you over your illness? (personal control) | 0.812 | |||
| Item 3 - How much do you think your treatment can help your illness? (treatment control) | 0.694 |
Table 2 shows the coefficients of the correlations between the two factors of the questionnaire. The acquired data show a moderately significant correlation between the two factors (P < 0.01).
Table 2.
Coefficients of the correlations
| Sub dimensions | Emotional illness representations | Cognitive illness representations |
|---|---|---|
| Emotional illness representations | 1.00 | 0.542 |
| Cognitive illness representations | 0.542 | 1.00 |
The goodness of fit indices (GFIs) generated by confirmatory factor analysis conducted on the two-factor structure before any modification on the model are as follows: χ2/df = 3.09 (P = 0.000), root mean square error of approximation (RMSEA)=0.12, GFI = 0.92, adjusted GFI (AGFI)=0.83, comparative fit index (CFI)=0.91, and normed fit index (NFI)=0.88. A review of the modifications proposed in the analyses indicated the need for a modification between Items 2 and 6. On theoretical grounds, the authors considered this suggestion because the RMSEA value was not in the acceptable level of consistence (0.12) and made a modification between Items 2 and 6. After the modification, the GFIs of the model were χ2/df = 1.72 (P = 0.05), RMSEA = 0.073, NFI = 0.94, CFI = 0.97, AGFI = 0.90, and GFI = 0.96 [Figure 1].
Figure 1.
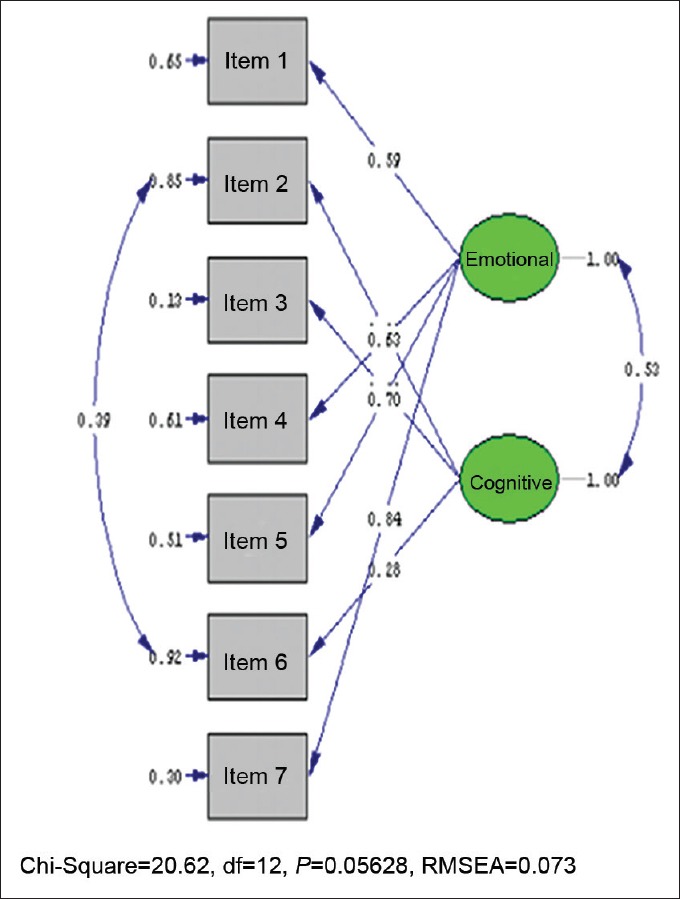
Confirmatory factor analysis
The authors analyzed the t values to determine whether the standardized solution values for each item on the questionnaire regarding the confirmatory factor analysis were significant. In this study, the t values of all of the items were significant at the 0.05 level.
Reliability of the Brief Illness Perception Questionnaire
The authors reviewed the correlation between the items and the total questionnaire as well as the Cronbach's alpha internal consistency coefficient with the aim of determining the capability of each item to measure the characteristics that they aimed to measure and the sufficiency in terms of the characteristic they measured. The Cronbach's alpha was 0.85, the emotional illness representation was 0.83, and the cognitive illness representation was 0.80. These findings show that the reliability of the scale is high. Table 3 shows the total item correlations and the Cronbach's alpha coefficients for both representations. The total item correlations in emotional illness representations ranged between r = 0.57 and r = 0.76, whereas the total item correlations in cognitive illness representations ranged between r = 0.62 and r = 0.70.
Table 3.
Total-ıtem correlations and Cronbach's alpha reliability coefficients
| Factors and items | Mean | SD | Total-item correlation | Cronbach's alpha coefficient without the item |
|---|---|---|---|---|
| Emotional illness representations (Cronbach's alpha: 0.83) | ||||
| Item 1 (consequences) | 6.73 | 2.49 | 0.572 | 0.815 |
| Item 4 (illness identity) | 5.42 | 2.53 | 0.607 | 0.800 |
| Item 5 (concern) | 4.85 | 2.95 | 0.678 | 0.769 |
| Item 7 (emotions) | 6.00 | 2.99 | 0.762 | 0.726 |
| Cognitive illness representations (Cronbach's alpha: 0.80) | ||||
| Item 2 (personal control) | 5.11 | 2.94 | 0.702 | 0.667 |
| Item 3 (treatment control) | 4.15 | 3.15 | 0.621 | 0.760 |
| Item 6 (coherence) | 4.57 | 2.68 | 0.624 | 0.753 |
SD: Standard deviation
Discussion
In this study, the authors conducted EFA to determine the factor structure of the BIPQ and determined that the scale had a two-factor structure that explained 67.125% of the total variance. The results of the EFA indicated that the factor loadings of one item (Item 2) were overlapping. Accordingly, and based on previous research, the authors excluded Item 2 from the BIPQ before conducting factor analysis and determined two factors. The first factor included four items, and the second factor included three items. In the original questionnaire, which was developed by Broadbent et al., cognitive illness representations consisted of Items 1 (consequences), 2 (timeline), 3 (personal control), 4 (treatment control), and 5 (illness identity). However, the factor analysis in this study showed that emotional illness representations consisted of Items 1 (consequences), 4 (illness identity), 5 (concern), and 7 (emotions). In the original form, the second factor was the emotional illness representations, which included Items 6 (concern) and 8 (emotional response). In this study, cognitive illness representations included three items, namely, Items 2 (personal control), 3 (treatment control), and 6 (coherence) in total, with factor loadings ranging between 0.694 and 0.885, and explained 14.516% of the total variance. This result shows that the factor structures of the questionnaire were affected by cultural characteristics. In addition, the patient population of the original BIPQ consisted of patients with diabetes mellitus, renal failure, asthma, myocardial infarction, chest pain, and minor illnesses (e.g., allergies and colds), whereas this study analyzed the illness perceptions of cancer patients. The illness perceptions of the patients are influenced by their experiences during illness and treatment, their symptoms, and their psychological characteristics. The authors believe that the factor changes in the study resulted from these variables. Illness perception affects not only psychological characteristics but also physical and social wellness. Considering all these points, the illness perceptions of cancer patients should be determined so that their physical, psychological, and social problems can be better understood, controlled, and treated. A review of the other versions of the Illness Perception Questionnaire (IPQ) indicated that the other versions of IPQs were too lengthy and difficult to use for determining the illness perceptions of cancer patients. For this reason, the shorter version of the IPQs will be used for determining their perceptions more easily and accurately. However, patients may get bored and avoid giving correct answers if the scale is too lengthy. Thus, the level of usability of the BIPQ for cancer patients is important.
In this study, the authors conducted confirmatory factor analysis after EFA. The acceptable consistency values for the indices GFI, CFI, NFI, RFI, IFI, and AGFI, which were generated by confirmatory factor analysis, is 0.90 and the ideal consistency level is 0.95.[28] For the RMSEA, the acceptable consistency value was 0.08 and the ideal consistency value was 0.05. In this study, the authors made some modifications to bring the RMSEA value to the acceptable consistency level and identified these values as χ2 = 20.62, SD = 12, P = 0.05, χ2/df = 1.72, RMSEA = 0.073, RMR = 0.47, NFI = 0.94, CFI = 0.97, IFI = 0.97, RFI = 0.89, AGFI = 0.90, GFI = 0.96, and SRMR = 0.055.
The authors evaluated these values based on the relevant study. Accordingly, the authors reported that the models, which had a χ2/df value <2.5, were ideal models.[29] Thus, the value 1.72 identified by this study appears to be ideal. According to the RMSEA criterion determined by Brown[28] and Jöreskog and Sörbom,[30] the modification was positive and brought the RMSEA value to a favorable level. A review of the CFI and NFI values in the study revealed that the CFI value was ≥0.97 and the NFI value was ≥0.95, and Brown indicated that these values were consistent.[28] The SRMR value being between the 0.00 and 0.05 interval shows that the consistency is acceptable.[31,32] Thus, the value determined by this study indicated a favorable consistency. The GFI and AGFI of more than 0.90 indicate that the consistency of the model was good.[28]
In this study, the total item correlations and the Cronbach's alpha coefficients were assessed to determine whether each item on the questionnaire measured the characteristics assigned to it and to what extent they were capable of measuring those characteristics. Generally, a reliability coefficient equal to or greater than 0.70 is seen as reliable.[25] If the Cronbach's alpha coefficients <0.40, then the measurement to orison reliable. If the Cronbach's alpha coefficients between 0.40 and 0.59, then the measurement tool has a low reliability. If the Cronbach's alpha coefficients between 0.60 and 0.79, then the measurement tool is very reliable. If the Cronbach's alpha coefficients between 0.80 and 1.00, then the tool is highly reliable.[33] The Cronbach's alpha value of the BIPQ was 0.85. The Cronbach's alpha value of emotional illness representations was 0.83, and that of cognitive illness representations was 0.80. These values indicated that the questionnaire is highly reliable. Broadbent et al. administered the BIPQ to the patients who had myocardial infraction (n = 103), renal failure (n = 132), type 2 diabetes mellitus (n = 119), asthma (n = 309), minor illnesses (i.e. allergies and colds; n = 166), and patients who experienced chest pain and were to have pre-diagnosis exercises tress test (n = 62). According to the reliability tests conducted by Broadbent et al., sub dimensions of consequences, timeline, treatment control, identity, understanding the illness, and emotional response had increased their correlations in the 6th week compared with that in the 3rd week. A decrease in the sub dimensions of personal control and no change in the dimension of concern were observed. The coefficients in the original BIPQ indicated that the questionnaire was reliable in both implementations in these 2 weeks.[27] According to the Cronbach's alpha, the BIPQ is highly reliable because its values range between 0.80 and 0.85.
The sufficiency level of the total item correlation coefficients differs in the relevant study. Although some authors argue that the sufficiency level should be at least 0.20, the most commonly used value is a total item correlation of ≥0.30.[29] The higher the correlation coefficient is the better the reliability of the items.[25,26] In this study, the test correlations are at least r = 0.30 for each item on the questionnaire. This shows that the questionnaire items can measure what they are intended to measure.
Another major aspect, which should be sought in a measurement tool, is validity because a measurement tool may not necessarily be valid even though it is reliable. Accordingly, for a questionnaire or a scale to be translated into a target language, the language equivalence should be achieved first. In this study, the authors consulted expert opinion about the language equivalence and content validity of the BIPQ and determined that the BIPQ achieved language equivalence and content validity. The aim of validity analysis is to evaluate the capacity of the items to represent the characteristics assigned to them and consist a meaningful total of these items. Content validity is a criterion that depends on experts’ subjective thoughts and professional skills. Accordingly, the CVI (0.98) of the questionnaire, which this study translated into Turkish, is higher than there commended reference value (minimum of 0.80) and shows that the questionnaire items accurately represent the illness perceptions of cancer patients. In conclusion, an analysis of the fit indices generated using confirmatory factor analysis indicates that the seven-item questionnaire in the study has good fitness and is suitable for use.
Conclusion
The original form of the questionnaire includes eight items in three factors, which were cognitive illness representations, emotional illness representations, and understanding of the illness. However, the Turkish version of the questionnaire includes seven items in two factors, which were cognitive illness representations and emotional illness representations. The BIPQ is easy to apply and reliable. Thus, the BIPQ can be used to determine the illness perceptions of cancer patients.
Financial support and sponsorship
Nil.
Conflicts of interest
There are no conflicts of interest.
References
- 1.Armay Z, Özkan M, Kocaman N, Özkan S. The Turkish Reliability and Validity Study in Cancer Patients of Illness Perception Questionnaire. Klin Psikiyatri. 2007;10:192–200. [Google Scholar]
- 2.Kocaman N, Özkan M, Armay Z, Özkan S. The reliability and the validity study of Turkish adaptation of the revised Illness Perception Questionnaire. Anadolu Psikiyatri Derg. 2007;8:271–80. [Google Scholar]
- 3.Norfazilah A, Samuel A, Law P, Ainaa A, Nurul A, Syahnaz MH, et al. Illness perception among hypertensive patients in primary care centre UKMMC. Malays Fam Physician. 2013;8:19–25. [PMC free article] [PubMed] [Google Scholar]
- 4.Petrie KJ, Jago LA, Devcich DA. The role of illness perceptions in patients with medical conditions. Curr Opin Psychiatry. 2007;20:163–7. doi: 10.1097/YCO.0b013e328014a871. [DOI] [PubMed] [Google Scholar]
- 5.Howard C, Hallas CN, Wray J, Carby M. The relationship between illness perceptions and panic in chronic obstructive pulmonary disease. Behav Res Ther. 2009;47:71–6. doi: 10.1016/j.brat.2008.10.004. [DOI] [PubMed] [Google Scholar]
- 6.İbrahim N, Desa A, Chiew-Tong NK. Illness perception and depression in patients with end-stage renal disease on chronic haemodialysis. Soc Sci. 2011;6:221–6. [Google Scholar]
- 7.Awasthi P, Mishra RC. Illness beliefs of women cancer patients and their relationships with social support. J Indian Acad Appl Psychol. 2010;36:317–27. [Google Scholar]
- 8.Hopman P, Rijken M. Illness perceptions of cancer patients: Relationships with illness characteristics and coping. Psychooncology. 2015;24:11–8. doi: 10.1002/pon.3591. [DOI] [PubMed] [Google Scholar]
- 9.de Castro EK, Marina K, Clarissa P, Machado-Meneghetti B, Chem C. Longitudinal assessment of ıllness perceptions in young adults with cancer. Psicol Reflexão Crít. 2012;25:671–8. [Google Scholar]
- 10.Petrie KJ, Weinman J. Why illness perceptions matter. Clin Med. 2006;6:536–9. doi: 10.7861/clinmedicine.6-6-536. [DOI] [PMC free article] [PubMed] [Google Scholar]
- 11.Scharloo M, Baatenburg de Jong RJ, Langeveld TP, van Velzen-Verkaik E, Doorn-op den Akker MM, Kaptein AA. Quality of life and illness perceptions in patients with recently diagnosed head and neck cancer. Head Neck. 2005;27:857–63. doi: 10.1002/hed.20251. [DOI] [PubMed] [Google Scholar]
- 12.Sánchez-Jiménez A, Cantarero-Villanueva I, Delgado-García G, Molina-Barea R, Fernández-Lao C, Galiano-Castillo N, et al. Physical impairments and quality of life of colorectal cancer survivors: A case-control study. Eur J Cancer Care (Engl) 2015;24:642–9. doi: 10.1111/ecc.12218. [DOI] [PubMed] [Google Scholar]
- 13.Davis KM, Kelly SP, Luta G, Tomko C, Miller AB, Taylor KL. The association of long-term treatment-related side effects with cancer-specific and general quality of life among prostate cancer survivors. Urology. 2014;84:300–6. doi: 10.1016/j.urology.2014.04.036. [DOI] [PMC free article] [PubMed] [Google Scholar]
- 14.Schmitz KH, Speck RM, Rye SA, DiSipio T, Hayes SC. Prevalence of breast cancer treatment sequelae over 6 years of follow-up: The pulling through study. Am Cancer Soc. 2012;118(8 Suppl):2217–25. doi: 10.1002/cncr.27474. [DOI] [PubMed] [Google Scholar]
- 15.Leventhal H, Meyer D, Nerenz D. The common sense representation of illness danger. In: Rachman S, editor. Medical Psychology. Vol. 2. New York: Pergamon Press; 1980. pp. 7–30. [Google Scholar]
- 16.Zhang N, Fielding R, Soong I, Chan KK, Tsang J, Lee V, et al. Illness perceptions among cancer survivors. Support Care Cancer. 2016;24:1295–304. doi: 10.1007/s00520-015-2914-3. [DOI] [PubMed] [Google Scholar]
- 17.Downe-Wamboldt B, Butler L, Coulter L. The relationship between meaning of illness, social support, coping strategies, and quality of life for lung cancer patients and their family members. Cancer Nurs. 2006;29:111–9. doi: 10.1097/00002820-200603000-00006. [DOI] [PubMed] [Google Scholar]
- 18.Sarna L, Brown JK, Cooley ME, Williams RD, Chernecky C, Padilla G, et al. Quality of life and meaning of illness of women with lung cancer. Oncol Nurs Forum. 2005;32:E9–19. doi: 10.1188/05.ONF.E9-E19. [DOI] [PubMed] [Google Scholar]
- 19.Thong MS, Kaptein AA, Vissers PA, Vreugdenhil G, van de Poll-Franse LV. Illness perceptions are associated with mortality among 1552 colorectal cancer survivors: A study from the population-based PROFILES registry. J Cancer Surviv. 2016;10:898–905. doi: 10.1007/s11764-016-0536-5. [DOI] [PMC free article] [PubMed] [Google Scholar]
- 20.Richardson AE, Morton RP, Broadbent EA. Changes over time in head and neck cancer patients’ and caregivers’ illness perceptions and relationships with quality of life. Psychol Health. 2016;31:1203–19. doi: 10.1080/08870446.2016.1203686. [DOI] [PubMed] [Google Scholar]
- 21.Hatcher L. A step-by-step approach to using the SAS ® system for factor analysis and structural equation modeling. Cary, NC: SAS Institute Inc; 1994. pp. 325–39. [Google Scholar]
- 22.Comrey AL, Lee HB. A First Course in Factor Analysis. Hillsdale, NJ: Erlbaum; 1992. p. 217. [Google Scholar]
- 23.Guilford JP. Psychometric Methods. New York: McGraw-Hill; 1954. p. 262. [Google Scholar]
- 24.Nunnally JC, Bernstein IH. Psychometric testing. New York: McGraw-Hill; 1978. [Google Scholar]
- 25.Gorusch RL. Factor analysis. 2nd ed. Hillsdale, NJ: Erlbaum; 1983. [Google Scholar]
- 26.Tavşancıl E. Measuring attitudesand data analysis with SPSS. Ankara: Nobel Akademik Yayincilik; 2014. [Google Scholar]
- 27.Broadbent E, Petrie KJ, Main J, Weinman J. The brief illness perception questionnaire. J Psychosom Res. 2006;60:631–7. doi: 10.1016/j.jpsychores.2005.10.020. [DOI] [PubMed] [Google Scholar]
- 28.Brown TA. Confirmatory Factor Analysis for Applied Research. New York: Guilford; 2006. [Google Scholar]
- 29.Akgül A, Çevik O. Statistical analysis techniques, “anagement practices in SPSS. Ankara: Emek Ofset Ltd. Şti; 2005. [Google Scholar]
- 30.Jöreskog KG, Sörbom D. LISREL 8: Structural Equation Modeling with the SIMPLIS Command Language. Chicago: SSI Scientific Software International Inc; 1993. [Google Scholar]
- 31.Byrne BM. Structural Equation Modeling with EQS and EQS/Windows: Basic Concepts, Applications, and Programming. Thousand Oaks, CA: Sage; 1994. [Google Scholar]
- 32.Nunnally JC, Bernstein I. Psychometric Theory. New York: McGraw-Hill; 1994. [Google Scholar]
- 33.Karasar N. Scientific Research Method- Concepts, Principles, Techniques. Ankara: 3A Araştırma, Eğitim, Danışmanlık Ltd; 1995. [Google Scholar]