Abstract
Previous studies suggested a close relationship between ruminant gut microbes and the mammary gland. In this study, shotgun metagenomic sequencing was used to reveal the differences in the intestinal microbiome potentially related to milk components in Murrah buffaloes and Chinese Holstein cattle. A PCoA based on the weighted Unifrac distances showed an apparent clustering pattern in the structure of intestinal microbiota between buffalo and cattle. We could attribute the structural difference to the genera of Sutterella, Coprococcus and Dorea. A further analysis of microbial functional features revealed that the biosynthesis of amino acids (including lysine, valine, leucine and isoleucine), lipopolysaccharide biosynthesis and cofactor/vitamin biosynthesis were enriched in the buffalo. In contrast, dairy cattle had higher levels of pyruvate metabolism and carbon fixation in photosynthetic organisms. A further correlation analysis based on different milk components and the typical microbiome uncovered a significant positive correlation between milk protein and the microbial biosynthesis of amino acids, which was also positively correlated in the genera of Parabacteroides, Dorea and Sutterella. This study will expand our understanding of the intestinal microbiome of buffalo and cattle as representative ruminants, as well as provide new views about how to improve the production and nutritional qualities of animal milk.
Murrah buffaloes (Bubalus bubalis) and Chinese Holstein cattle, which belong to the genus Bos (order: Artiodactyla; suborder: Ruminantia), are economically significant livestock that have been used as a source of dairy and meat, as well as draught power1. Due to their biological characteristics and the natural resources in China, dairy cattle and native swamp buffalo are mainly distributed in northern and southern China, respectively2,3,4. Compared to small poultry livestock, buffalo and dairy cattle have the advantage of high roughage feeding, anti-disease and anti-adversity, high reproductive rates and hereditary stability. Additionally, the milk is rich in various nutrients, including protein, fat, vitamins, and minerals. Milk is therefore considered a perfect food with a relatively complete nutritional structure5.
The animal gastrointestinal tract is a major habitat for numerous species of microbes. This cohort consists of at least 1014 members and is dominated by anaerobic bacteria6. Gut microbiota play important roles in extracting nutrients from the host diet, regulating host fat storage, stimulating intestinal epithelium renewal and directing maturation of the immune system7. In addition, previous studies suggested a close relationship between ruminant gut microbes and the mammary gland. Jimenez8 reported the oral administration of Lactobacillus strains isolated from breast milk as an alternative for the treatment of infectious mastitis during lactation. Another earlier study also clarified the potential mechanism between the occurrence/development of mastitis and intestinal microbiota9. The mammary gland is the only site of milk production in animals, so we hypothesized that the intestinal microbiota was able to influence the composition and nutrition of animal milk by acting on the mammary gland.
With the development of next-generation sequencing, we described the microbial diversity in any micro-ecosystem globally by high-throughput sequencing of bacterial 16S rRNA. Furthermore, the improvements in shotgun metagenomic sequencing allow us to explore the microbial interaction and functional features at the metabolic level. By combining the pyrosequencing of the metagenomic DNA and fibrolytic active BAC clones prepared with the same DNA pool, Xin Dai10 revealed the profile of the fibrolytic genes that are indicative of lignocellulose degradation mechanisms in the yak rumen. To characterize biomass-degrading relative functional genes, Hess et al.11 explored deeply sequenced metagenomic reads (268 G bases) from complex microbiota related to plant fibre incubated in cow rumen. From the results, they identified 27,755 carbohydrate-active genes and over 90 candidate proteins, of which more than 57% were enzymatically active against cellulosic substrates. To explore the relationship between bacterial taxa of the human gut microbiota and those in the gut microbiota of domestic and semi-wild animals, Ellis12 compared the distal gut microbiota of humans, cattle and semi-captive chimpanzees in communities that are geographically sympatric in Uganda. The results indicated a unique intestinal microbial profile in cattle, which characterized by abundant of the genus Ruminococcus and the high level of the ratio of Firmicutes and Bacteroidetes. Meanwhile, the genera Anoxybacillus, Clostridium and Enterobacteriaceae were identified closely related to the multiple carbohydrate fermentation.
China is the major milk producing country in Asia, and dairy cattle and buffalo are the most important cow species in the northern and southern regions of China. Based on a previous correlation study between the cow mammary gland and gut microbes13, we designed a study to investigate the differences in typical intestinal microbiomes and its potential correlation with milk components by shotgun metagenomic sequencing. This study will supply the theoretical foundation for further use of probiotics to modulate the balance of host intestinal microbiota. Moreover, we also provide a new view for increasing milk production and quality, as well as promoting the long-term development of China’s dairy industry.
Results
Sequencing coverage and estimation of bacterial alpha diversity
In this study, shotgun metagenomic sequencing and 16S rRNA high throughput sequencing were applied to reveal the differences in the intestinal microbiome between buffalo (n = 10) and dairy cattle (n = 10). The structure of intestinal microbiota was analysed by 16S rRNA gene sequencing reads, which revealed for each microbiota on average 2,165 operational taxonomic units (OTUs) from an average of 8,173 reads (Table 1). To characterize the functional profiles of the microbiota, all samples were selected for whole-metagenome shotgun sequencing, yielding 197.4 Giga base (Gb) of pair-end reads (averagely 61,837,672 high-quality reads for each microbiota; Table 1). By determining the alpha diversity within samples, we observed no significant difference in microbes between buffalo and cattle (Table 1).
Table 1. Metagenomic sequencing coverage and the alpha diversity.
| Sample | High quality reads# (metagenomic data) | Assembled Contig# | Average N50 length | Annotated Genes# | Average Length |
|---|---|---|---|---|---|
| Buffalo (n = 10) | 63456244 | 171549 | 4705 | 304800 | 594 |
| SEM (Buffalo) | 3236739 | 6325 | 835 | 100733 | 63 |
| Cattle (n = 10) | 60219098 | 100122 | 8182 | 191639 | 639 |
| SEM (Cattle) | 1579564 | 6146 | 553 | 83993 | 79 |
| Sample | OTU# (16S rRNA sequencing data) | Observed Species | Chao 1 Index | Shannon Index | Simpson Index |
| Buffalo (n = 10) | 2021 | 2003.19 | 4011.50 | 9.85 | 0.9973 |
| SEM (Buffalo) | 370 | 365.68 | 1065.66 | 0.40 | 0.0010 |
| Cattle (n = 10) | 2309 | 2294.62 | 4530.06 | 9.63 | 0.9952 |
| SEM (Yak) | 579 | 173.88 | 847.99 | 0.82 | 0.0039 |
The intestinal microbial diversity in buffalo and cattle
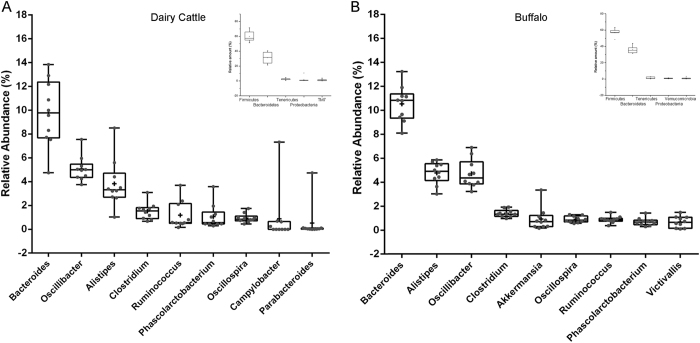
At the phylum level, the Firmicutes, Bacteroidetes, Tenericutes and Proteobacteria (contributing to 95.38% of the total number of sequences) dominated the intestinal microbiota in both buffalo and dairy cattle. At the genus level, Bacteroides was the most abundant genus (contributing to 9.77% of the total number of sequences) in dairy cattle, and the amounts of Oscillibacter, Alistipes, Clostridium, Ruminococcus and Phascolarctobacterium all exceeded 1% (Fig. 1A). In buffalo, the Bacteroides was also the predominant genus, followed by Alistipes, Oscillibacter, Clostridium, Akkermansia and Oscillospira (Fig. 1B). Thus, the predominant genera in buffalo and cattle were similar, but the amounts of these genera were different.
Figure 1.
The composition of intestinal microbiota of dairy cattle (A) and buffalo (B) at the phylum and genus level.
Differences in gut microbiota between buffalo and cattle
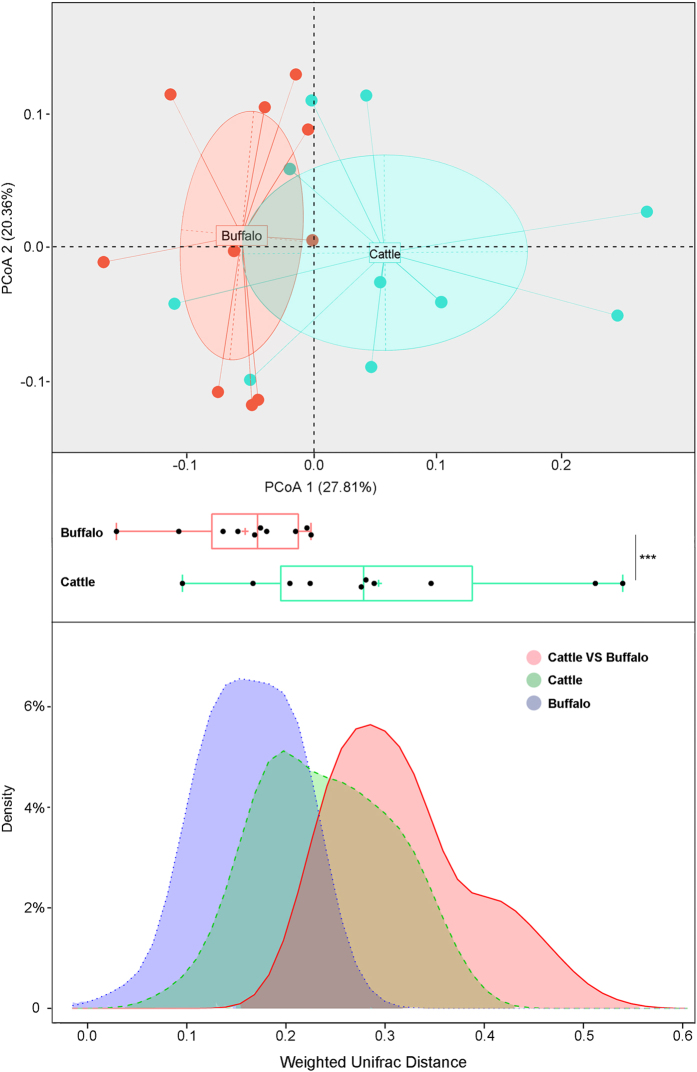
To test whether any differences in the organismal structure of intestinal microbiota were present, a principal coordinates analysis (PCoA) was performed based on the weighted Unifrac distances of 16S rRNA sequence profiles at the OTUs level. As shown in Fig. 2A (upper panel), an apparent clustering pattern was identified for the blue and red points, which represent intestinal samples from cattle and buffalo, respectively, and significant separation (P < 0.001) in PC 1 was observed (Fig. 2A, lower panel; Wilcoxon rank-sum tests). This result was confirmed by the kernel density distribution profile of weighted Unifrac distances between buffalo and cattle (Fig. 2B).
Figure 2. Differences in gut microbiota between buffalo and cattle.
(A) A principal component (PCoA) score plot based on weighted UniFrac metrics for all samples. Each point represents the composition of the intestinal microbiota of one sample. (B) The kernel density profile based on weighted UniFrac distance within and between buffalo and cattle.
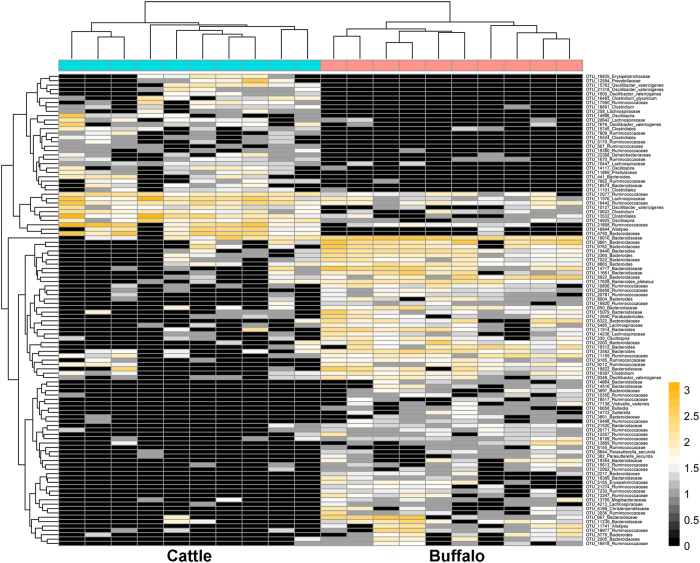
After confirming that there was an intrinsic difference in intestinal microbiota composition between buffalo and cattle, we further identified differences in specific bacteria at the genus and OTUs level (Table 2 and Fig. 3). At the genus level, the relative amount of Sutterella, Coprococcus, Parasutterella, Paludibacter and Dorea were significantly higher in the buffalo group, whereas Streptococcus, Pseudobutyrivibrio, Anaerorhabdus, Campylobacter and Blautia were enriched in the cattle group. A further analysis according to the OTUs profile revealed a total of 108 OTUs that were significantly different between buffalo and cattle. Among these OTUs, 70 OTUs mainly belonged to the order of Bacteroidaceae and Ruminococcaceae, and the genus of Bacteroides was enriched in the buffalo group. Meanwhile, 38 OTUs, mainly belonging to the Lachnospiraceae order, Clostridiales genus and Oscillibacter valericigenes, were enriched in the cattle group.
Table 2. Significantly different intestinal genera between cattle and buffalo.
| Genus | Relative contribution (%) | Median, range (%) | Enriched | Adjusted P-value | ||
|---|---|---|---|---|---|---|
| Cattle | Buffalo | Cattle | Buffalo | |||
| Streptococcus | 0.010 | 0.000 | 0.008 (0–0.038) | 0 (0–0) | Cattle | 0.006 |
| Pseudobutyrivibrio | 0.010 | 0.000 | 0.006 (0–0.038) | 0 (0–0) | Cattle | 0.015 |
| Anaerorhabdus | 0.044 | 0.010 | 0.038 (0–0.121) | 0 (0–0.036) | Cattle | 0.021 |
| Campylobacter | 0.888 | 0.000 | 0 (0–7.328) | 0 (0–0) | Cattle | 0.035 |
| Blautia | 0.014 | 0.005 | 0.011 (0–0.029) | 0 (0–0.033) | Cattle | 0.024 |
| Sutterella | 0.000 | 0.025 | 0 (0–0) | 0.018 (0–0.085) | Buffalo | 0.002 |
| Coprococcus | 0.125 | 0.035 | 0.122 (0.025–0.331) | 0.012 (0–0.147) | Buffalo | 0.005 |
| Parasutterella | 0.019 | 0.087 | 0.015 (0–0.057) | 0.061 (0–0.205) | Buffalo | 0.013 |
| Paludibacter | 0.147 | 0.464 | 0.044 (0–0.742) | 0.374 (0.075–1.615) | Buffalo | 0.026 |
| Dorea | 0.058 | 0.127 | 0.036 (0–0.154) | 0.122 (0.066–0.238) | Buffalo | 0.015 |
Note: Adjusted P values (P < 0.05) for the Wilcoxon rank-sum test are listed.
Figure 3. Heatmap constructed using the amount of significantly different OTUs between buffalo and cattle samples by the Wilcoxon rank-sum test.
Typical microbial functional features and metabolic pathways identified from cattle and buffalo samples
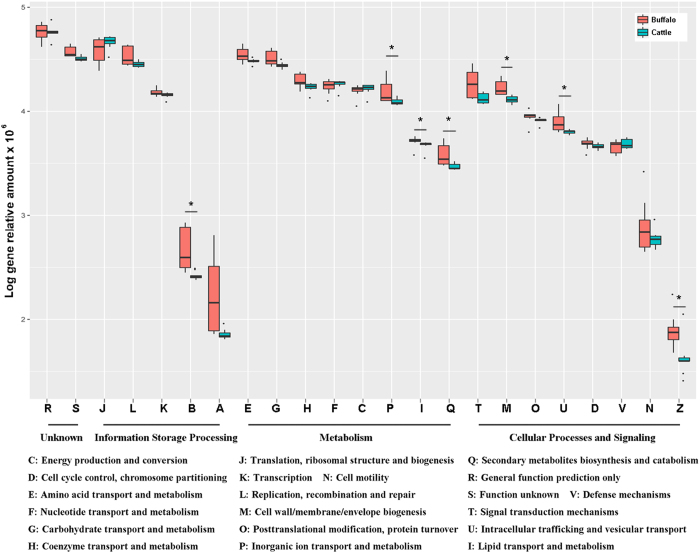
To identify the intestinal microbial functional differences between buffalo and cattle, the shotgun metagenomic data were annotated using the COG and the KEGG databases, and analysed at the functional and metabolic pathway levels. The results revealed that 7,409 KOs and 1,917 COGs were identified either in buffalo or cattle samples. By comparing the profile of COGs functional features, we found that the COGs that were enriched in buffalo include those implicated in chromatin structure and dynamics; cell wall biogenesis; intracellular trafficking, secretion, and vesicular transport; amino acid transport and metabolism; lipid transport and metabolism; and inorganic ion transport and metabolism. In contrast, only the COGs of translation, ribosomal structure and biogenesis were enriched in the cattle group (Fig. 4).
Figure 4. Comparison of the microbial functional features (COGs) between the buffalo and cattle groups.
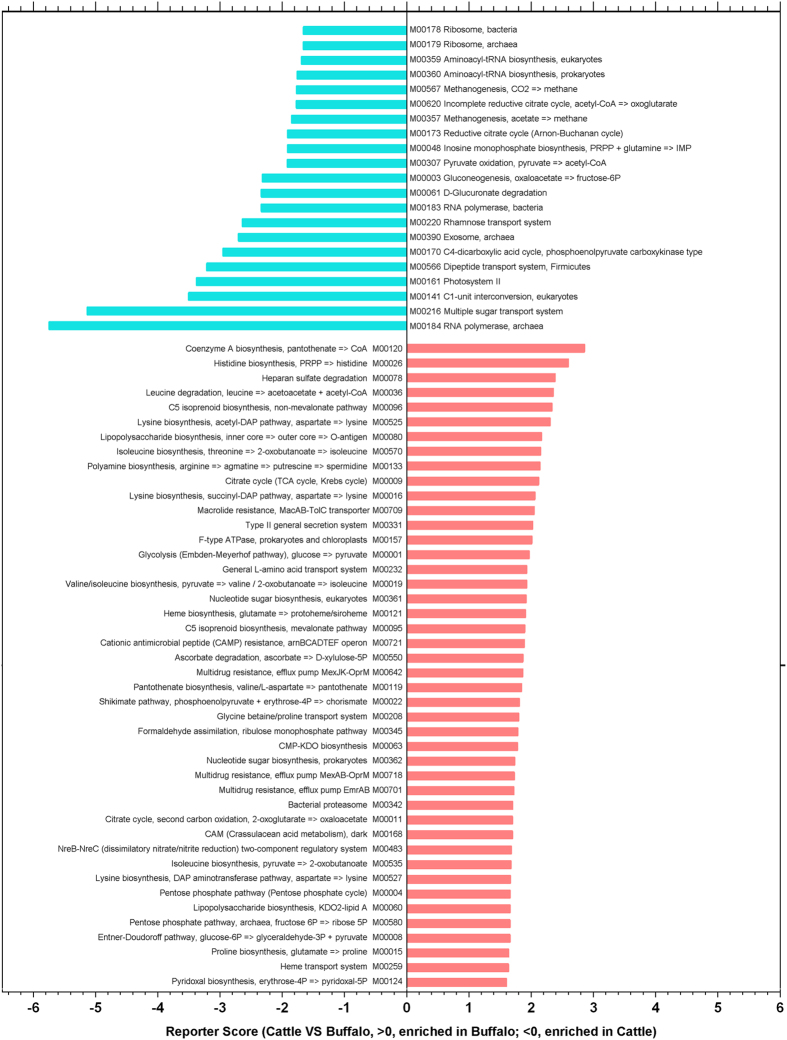
We further mapped the KOs to KEGG modules and pathways, and calculated the reporter Z scores of each pathway or module by using the reporter feature algorithm (Table 3 and Fig. 5). A reporter score = 1.6 (90% confidence according to the normal distribution) was used as the detection threshold for significantly differentiating modules or pathways. In particular, the biosynthesis of amino acids (including lysine, valine, leucine and isoleucine), lipopolysaccharide biosynthesis, cofactor and vitamin biosynthesis, phosphotransferase system (PTS), peptidoglycan biosynthesis, biotin metabolism and amino sugar and nucleotide sugar metabolism were enriched in the buffalo. In contrast, the intestinal microbiome of dairy cattle had higher levels of KO modules which were involved in pyruvate metabolism, glycolysis/gluconeogenesis, nitrotoluene degradation and carbon fixation in photosynthetic organisms. Generally, the predominant metabolism in gut was introduced by anaerobic bacteria, and the metabolic pathway of carbon fixation in photosynthetic organisms was mainly introduced by the photosynthetic bacteria and the phylum Cyanobacteria. Given present research, we annotated abundant Cyanobacteria in distal gut samples (Table S2), and observed the amount of the phylum Cyanobacteria in cattle was higher than that in buffalo. Then we can attribute the high level of the metabolic pathway of carbon fixation in photosynthetic organisms in cattle to the more abundant of Cyanobacteria in gut.
Table 3. The significantly different pathways of intestinal microbiota between cattle and buffalo.
| Pathway ID | Reporter score (>0, enriched in buffalo; <0, in cattle) | Number of all KOs in the pathway | Number of detected KOs in the pathway (coverage %) | Pathway annotation | Level 1-Pathway |
|---|---|---|---|---|---|
| Map01230 | 5.773 | 226 | 194 (85%) | Biosynthesis of amino acids | Metabolism |
| Map02040 | 3.245 | 37 | 37 (100%) | Flagellar assembly | Cellular Processes |
| Map00770 | 3.221 | 36 | 32 (89%) | Pantothenate and CoA biosynthesis | Metabolism |
| Map00540 | 3.147 | 38 | 36 (95%) | Lipopolysaccharide biosynthesis | Metabolism |
| Map02020 | 2.969 | 428 | 323 (75%) | Two-component system | Environmental Information |
| Map02060 | 2.592 | 79 | 67 (85%) | Phosphotransferase system (PTS) | Environmental Information |
| Map00550 | 2.522 | 40 | 35 (88%) | Peptidoglycan biosynthesis | Metabolism |
| Map00290 | 2.517 | 17 | 16 (94%) | Valine, leucine and isoleucine biosynthesis | Metabolism |
| Map00780 | 2.357 | 19 | 17 (89%) | Biotin metabolism | Metabolism |
| Map00020 | 2.284 | 56 | 46 (82%) | Citrate cycle (TCA cycle) | Metabolism |
| Map00531 | 2.062 | 15 | 14 (93%) | Glycosaminoglycan degradation | Metabolism |
| Map00520 | 2.060 | 144 | 113 (78%) | Amino sugar and nucleotide sugar metabolism | Metabolism |
| Map00500 | 1.934 | 101 | 78 (77%) | Starch and sucrose metabolism | Metabolism |
| Map00450 | 1.884 | 28 | 25 (89%) | Selenocompound metabolism | Metabolism |
| Map00511 | 1.884 | 18 | 16 (89%) | Other glycan degradation | Metabolism |
| Map00030 | 1.874 | 75 | 59 (79%) | Pentose phosphate pathway | Metabolism |
| Map02030 | 1.794 | 26 | 25 (96%) | Bacterial chemotaxis | Cellular Processes |
| Map00620 | −3.530 | 90 | 77 (86%) | Pyruvate metabolism | Metabolism |
| Map00010 | −3.337 | 93 | 76 (82%) | Glycolysis/Gluconeogenesis | Metabolism |
| Map03010 | −2.948 | 143 | 109 (76%) | Ribosome | Genetic Information |
| Map00633 | −2.674 | 17 | 17 (100%) | Nitrotoluene degradation | Metabolism |
| Map00710 | −1.971 | 36 | 29 (81%) | Carbon fixation in photosynthetic organisms | Metabolism |
Note: A reporter score of >1.6 (90% confidence according to normal distribution) could be used as a detection threshold for significantly different pathways.
Figure 5. Microbial KO modules enriched in buffalo or cattle samples.
The relative abundances of KO modules were compared between buffalo and cattle, and modules with a significant difference in reporter score (<−1.6, enriched in cattle; >1.6, enriched in buffalo) are shown.
The determination of milk components and correlation with the intestinal microbiome
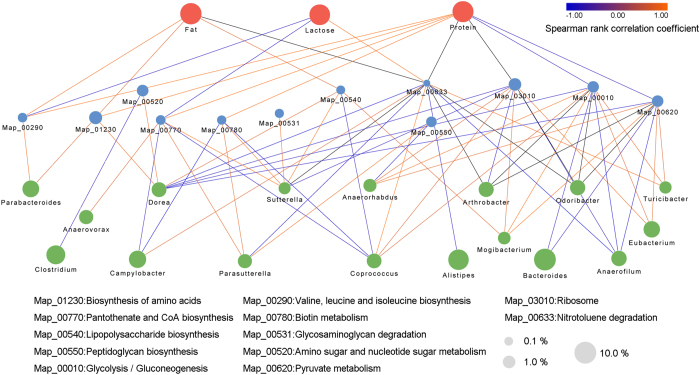
The common milk components, including protein, fat, lactose, total solids and major elements, between dairy cattle and buffalo were determined and compared (Table 4). The amounts of protein, fat, total solids and the elements Mg and Ca in the milk of buffalo were significantly higher than in dairy cattle. In contrast, lactose and vitamin K were enriched in cattle milk. To probe the potential mechanism underlying the milk differences, we determined the correlation among the different milk components, the typical microbial metabolic pathway and the relative genera according to Spearman’s rank correlation coefficient (R > 0.4, Fig. 6). The network revealed that the protein was positively correlated to the pathways of biosynthesis of amino acids, valine, leucine and isoleucine biosynthesis, pantothenate and COA biosynthesis and biotin metabolism, which also positively correlated to the genera of Parabacteroides, Dorea, Sutterella and Parasutterella. Meanwhile, the milk fat exhibited multiple and complex relationships with microbes and microbial pathways. On one hand, a negative correlation was observed between the milk fat content and the microbial pathway of nitrotoluene degradation, and the pathway was positively correlated to the genera Campylobacter, Coprococcus and Turicibacter, but negatively correlated to the genera Dorea, Parasutterella, Alistipes and Anaerofilum. On other hand, the positive correlations were found between the milk fat and the pathway of lipopolysaccharide biosynthesis, biosynthesis of amino acids, valine, leucine and isoleucine biosynthesis.
Table 4. Milk components of cattle and buffalo.
| Species | Protein (g/100 g) | Fat (g/100 g) | Lactose (g/100 g) | Total solids (g/100 g) |
|---|---|---|---|---|
| Buffalo (n = 10) | 5.96 ± 0.5a | 7.16 ± 0.52a | 4.08 ± 0.76 | 16.35 ± 1.42a |
| Cattle (n = 10) | 4.15 ± 0.29 | 4.98 ± 0.58 | 4.96 ± 0.36* | 13.67 ± 1.82 |
| Species | Na (mg/100 g) | Mg (mg/100 g) | K (mg/100 g) | Ca (mg/100 g) |
| Buffalo (n = 10) | 38.92 ± 1.88 | 18.21 ± 0.78a | 91.82 ± 17.89 | 182.53 ± 13.36a |
| Cattle (n = 10) | 33.09 ± 1.15 | 11.25 ± 1.21 | 136.16 ± 24.46* | 104.69 ± 6.92 |
Note: arepresents significantly different milk components.
Figure 6. The correlation network of different milk components and typical metabolic pathways with relative genera.
The edge width and colour (red: positive and blue: negative) are proportional to the correlation strength. The node size is proportional to the mean abundance in the respective population.
Discussion
From the relative amount of major genera, we found that Bacteroides, Oscillibacter, Alistipes, Ruminococcus and Clostridium were the predominant bacteria in the gut of buffalo and cattle. The gastrointestinal tract of herbivores contains various microbes that harbour the complex lignocellulosic degradation system for the microbial attachment and digestion of plant biomass14. An example is Bacteroides spp, which digest a wide variety of otherwise indigestible dietary plant polysaccharides (e.g., amylose, amylopectin, and pullulan)15. In addition, Alistipes, a member of the family Rickenellaceae, might be a bacterial genus of particular interest in the field of fibre degradation16. In a previous study comparing the effects of plant- vs animal-derived diets on microbiota, Alistipes and Bacteroides were considered to be enriched in the former, plant-derived fibre-rich diet, consistent with a purported role in plant polysaccharide degradation14. The Ruminococcus are also considered to be the most important cellulose-degrading bacteria in the intestine of herbivores, and they produce large amounts of cellulolytic enzymes, including exoglucanases, endoglucanases, glucosidases and hemicellulases17. Accordingly, the high detection of Alistipes, Bacteroides and Ruminococcus in this study of intestinal microbiota in buffalo and cattle is associated with fibre degradation in feed. These bacteria also degraded xylan and pectin and utilize degraded soluble sugars as substrates.
To establish a unique catalogue of microbial reference genes is crucial for microbial functional metagenomic analyses. Although a large catalogue of reference genes from intestinal microbiota that included 9,879,896 genes was recently reported in humans18, it was mainly derived from healthy individuals from MetaHIT and HMP, which tended to limit its reference value for interpreting buffalo and cattle herbivorous microbiota. Additionally, numerous reports had dominated the significant difference in the composition and functional features of intestinal microbiota between human and herbivore. Thus, the intestinal gene catalogue established in this study of 3,172,144 microbial genes from both buffalo and cattle should be of value for future studies probing the role of the intestinal microbiome in herbivores.
To explore the potential correlation between milk components and the intestinal microbiome, a complex interactive network, including the common milk components, typical microbial pathways and matched genera, was established. A positive correlation was found between the protein amount and the pathways of biosynthesis of amino acids (including lysine, valine, leucine and isoleucine), which also positively correlated to the genera of Parabacteroides, Dorea, Sutterella and Parasutterella. Previous research had focused on the impact of gut microbes on the mammary gland and bovine mastitis. These studies described the drastic differences in both the milk and faecal microbial compositions in dairy cattle suffering mastitis and associated the structural changes with the loss of gut Lactobacillus13. There are two potential mechanisms for explaining the interaction between the gut microbes and the mammary gland. One possibility is that intestinal microbes are able to move through the dendritic cells in the intestinal epithelia by endocytosis and arrive in the mammary gland to play helpful or harmful roles19. Or alternatively, the microbial metabolite can move through the intestinal epithelial cells and enter the blood flow to the mammary gland, and then impact the milk components secreted by the mammary gland20. The second potential mechanism also highlights the importance of microbial function in our investigation.
In this study, a metagenomic approach was used to uncover the composition of intestinal microbiota and the microbial functional diversity in buffalo and cattle. A further correlation analysis uncovered the interaction between the intestinal microbiome and milk components. This research will expand our understanding of the intestinal microbiome of buffalo and cattle as representative ruminants and will also providing new ideas about how to improve the production and nutrition of animal milk.
Materials and Methods
Study design and sample collection
The cows studied in this research are Chinese Holstein cattle and the Murrah buffaloes (Bubalus bubalis). The research protocol was reviewed and approved by the Institutional Animal Care and Use Committee of Hainan University (Haikou, China). Fecal and milk samples of 5-year-old dairy cattle and buffalo were collected from two pastures in Haikou city and Danzhou city in Hainan province, respectively. Composition of the feeds for diets of cattle and buffaloes are the same using the commercial products.
The teat-ends were carefully disinfected before the milk samples were taken directly by hand in the morning. Faecal samples (10 g) were numbered (Cattle1–10, n = 10 and Buffalo1–10, n = 10), weighed, mixed with protector (Takara, Japan) in sterile tubes at the ratio of 1:5 (w/w) and vortex until homogenous. The samples were placed in an ice box for transportation to the laboratory, after which the metagenomic DNA was extracted immediately for subsequent bacterial 16S rRNA gene V3–V4 region high-throughput sequencing and metagenomic shotgun sequencing. The study was approved by the Ethical Committee of the Hainan University (Haikou, China). The materials and methods described in this research were conducted in accordance with the approved guidelines.
Metagenomic DNA extraction
The QIAamp® DNA Stool Mini Kit (Qiagen, Hilden, Germany) was used for DNA extraction from the faecal samples. The quality of the metagenomic DNA was assessed by 0.8% agarose gel electrophoresis. All of the DNA samples were stored at −20 °C until further processing.
PCR amplification of the bacterial 16S rRNA gene V3–V4 region using high throughput sequencing and a bioinformatics analysis
The V3–V4 region of the 16S ribosomal RNA (rRNA) genes was amplified for each sample. A set of 8-nucleotide barcodes was added to the universal forward primer 338 F (5′-ACTCCTACGGGAGGCAGCA-3′) and the reverse primer 806 R (5′-GGACTACHVGGGTWTCTAAT-3′), which were targeted at the domain Bacteria. PCR amplification was then performed as described previously21. The PCR products were sequenced using the Illumina Miseq PE300 platform. High-quality sequences were extracted from the raw reads. After the removal of the barcodes and primer, the extracted sequences were processed mainly using the QIIME (v1.7.0) suite of software tools22.
Shotgun metagenomic sequencing and quality control
The Illumina HiSeq2500 platform was used for shotgun metagenomic sequencing. Paired-end reads were generated with 100 bp in the forward and reverse directions. The length of each read was trimmed with Sickle. This set of high-quality reads was then used for a further analysis. An average of 9.87 gigabases (Gb) of paired-end reads were obtained for each sample, totalling 197.4 Gb of high-quality data free of host genomic and adaptor contaminants.
Shotgun metagenomic reads, de novo assembly, gene prediction and construction of the non-redundant gene catalogue
The Illumina reads were assembled into contigs using IDBA-UD23 with default parameters. Genes were predicted on the contigs with MetaGeneMark24. A non-redundant gene catalogue was constructed with CD-HIT25 using a sequence identity cut-off of 0.95, with a minimum coverage cut-off of 0.9 for the shorter sequences. This catalogue contained 3,172,144 microbial genes.
Annotation of COG and KEGG database
We aligned the amino acid sequences that were translated from the gene catalogue against the proteins/domains in the Cluster of Orthologous Groups (COG) and the Kyoto Encyclopedia of Genes and Genomes (KEGG) databases using BLASTP (e-value ≤ 1e-5 with a bit-score higher than 60). Each protein was assigned to the KEGG orthologue group (KO) or cluster of orthologous groups by the highest scoring annotated hit.
Computation of relative gene abundance
To assess the abundance of genes profile, reads were aligned to the gene catalogue with Bowtie226 using the following parameters: -p 12 -x nt -1 R1.fastq -2 R2.fastq -S R.sam. Then, for any sample N, we calculated the abundance as follows:
Step 1: Calculation of the copy number of each gene:
 |
Step 2: Calculation of the relative abundance of gene i:
 |
ai: the relative abundance of gene i
bi: the copy number of gene i from sample N
Li: the length of gene i
xi: the number of mapped reads
KEGG pathway analysis
Differentially enriched KO modules and pathways were identified according to the reporter scores27 from the Z-scores of individual KOs. Accordingly, the Z adjustedpathway of each KEGG module and pathway was calculated as previously described27. Then, the Z adjustedpathway was used as the final reporter score for evaluating the enrichment of specific pathways or modules. A reporter score of >1.6 (90% confidence according to the normal distribution) could be used as a detection threshold for significantly differentiating pathways.
The measurement of the milk components
The protein content was determined according to the Kjeldahl method (method 991.20; AOAC International, 2012),28 the lactose content was determined according to AOAC International (2012; method 896.01),28 and the total fat content was determined using the Mojonnier method according to AOAC International (2012; method 996.06)28. The percent ash used 2 g of sample in a crucible and subjected the sample to a high-temperature furnace at 550 °C for 60 min (method 930.30; AOAC International, 2012)28. Prior to the ashing procedures, milk samples were dried in an oven at 100 °C for 60 min to remove moisture and avoid splatter. The microelement composition including Na, Mg, K and Ca in milk was determined by inductively coupled plasma mass spectrometry (ICP-MS) according to Matos et al.29.
Statistical analysis
All statistical analyses were undertaken using the R software. PCoA and a kernel density distribution analysis were performed in R using the ade430 package. Differential abundance of genus, genes and COGs were tested by the Wilcoxon rank sum test. False discovery rate (FDR) values were estimated using the Benjamini-Yekutieli method31 to control for Wilcoxon rank sum test P value. The heatmap of significantly different OTUs was built in R using the “pheatmap” package. The correlation between the milk components, metabolic pathways and relative genera were calculated by Spearman’s rank correlation coefficient and visualized by network in Cytoscape (Version 3.2.1).
Data availability
The sequence data reported in this paper have been deposited in the NCBI database (Metagenomic data: SRP075434).
Additional Information
How to cite this article: Zhang, J. et al. Comparative study of the gut microbiome potentially related to milk protein in Murrah buffaloes (Bubalus bubalis) and Chinese Holstein cattle. Sci. Rep. 7, 42189; doi: 10.1038/srep42189 (2017).
Publisher's note: Springer Nature remains neutral with regard to jurisdictional claims in published maps and institutional affiliations.
Supplementary Material
Acknowledgments
This research was supported by the Natural Science Foundation of Hainan province (no. 20163042), the Scientific Research Foundation of Colleges and Universities in Hainan province (no. Hnky2016-12) and the Scientific Research Foundation of Hainan University (no. KYQD1548).
Footnotes
The authors declare no competing financial interests.
Author Contributions J.Z. designed the study. C.X. and Q.H. collected samples. D.H. and Q.P. processed and sequenced samples. J.Z. and D.H. analysed the data. J.Z. and D.H. wrote the paper.
References
- Barłowska J., Szwajkowska M., Litwińczuk Z. & Król J. Nutritional value and technological suitability of milk from various animal species used for dairy production. Comprehensive Reviews in Food Science and Food Safety 10, 291–302 (2011). [Google Scholar]
- Li Z. et al. Identifying management strategies to improve sustainability and household income for herders on the desert steppe in Inner Mongolia, China. Agricultural Systems 132, 62–72, doi: 10.1016/j.agsy.2014.08.011 (2015). [DOI] [Google Scholar]
- Zhang Y. et al. Strong and stable geographic differentiation of swamp buffalo maternal and paternal lineages indicates domestication in the China/Indochina border region. Molecular ecology 25, 1530–1550, doi: 10.1111/mec.13518 (2016). [DOI] [PubMed] [Google Scholar]
- Funes-Monzote F., Monzote M., Lantinga E. & Van Keulen H. Conversion of specialised dairy farming systems into sustainable mixed farming systems in Cuba. Environment, development and sustainability 11, 765–783 (2009). [Google Scholar]
- Bobe G., Lindberg G. L., Freeman A. E. & Beitz D. C. Short communication: Composition of milk protein and milk fatty acids is stable for cows differing in genetic merit for milk production. Journal of dairy science 90, 3955–3960, doi: 10.3168/jds.2007-0099 (2007). [DOI] [PubMed] [Google Scholar]
- Nicholson J. K. et al. Host-gut microbiota metabolic interactions. Science 336, 1262–1267, doi: 10.1126/science.1223813 (2012). [DOI] [PubMed] [Google Scholar]
- Kau A. L., Ahern P. P., Griffin N. W., Goodman A. L. & Gordon J. I. Human nutrition, the gut microbiome and the immune system. Nature 474, 327–336, doi: 10.1038/nature10213 (2011). [DOI] [PMC free article] [PubMed] [Google Scholar]
- Jimenez E. et al. Oral administration of Lactobacillus strains isolated from breast milk as an alternative for the treatment of infectious mastitis during lactation. Applied and environmental microbiology 74, 4650–4655, doi: 10.1128/AEM.02599-07 (2008). [DOI] [PMC free article] [PubMed] [Google Scholar]
- Oikonomou G. et al. Microbiota of cow’s milk; distinguishing healthy, sub-clinically and clinically diseased quarters. PloS one 9, e85904, doi: 10.1371/journal.pone.0085904 (2014). [DOI] [PMC free article] [PubMed] [Google Scholar]
- Dai X. et al. Metagenomic insights into the fibrolytic microbiome in yak rumen. PloS one 7, e40430, doi: 10.1371/journal.pone.0040430 (2012). [DOI] [PMC free article] [PubMed] [Google Scholar]
- Hess M. et al. Metagenomic discovery of biomass-degrading genes and genomes from cow rumen. Science 331, 463–467, doi: 10.1126/science.1200387 (2011). [DOI] [PubMed] [Google Scholar]
- Ellis R. J. et al. Comparison of the distal gut microbiota from people and animals in africa. Plos One 8, doi: ARTN e54783 10.1371/journal.pone.0054783 (2013). [DOI] [PMC free article] [PubMed] [Google Scholar]
- Ma C. et al. Bovine mastitis may be associated with the deprivation of gut Lactobacillus. Beneficial microbes 9, 1–8, doi: 10.3920/BM2015.0048 (2015). [DOI] [PubMed] [Google Scholar]
- He B. et al. Transmissible microbial and metabolomic remodeling by soluble dietary fiber improves metabolic homeostasis. Scientific reports 5, 10604, doi: 10.1038/srep10604 (2015). [DOI] [PMC free article] [PubMed] [Google Scholar]
- Xu J. et al. A genomic view of the human-Bacteroides thetaiotaomicron symbiosis. Science 299, 2074–2076, doi: 10.1126/science.1080029 (2003). [DOI] [PubMed] [Google Scholar]
- Peng B., Huang S., Liu T. & Geng A. Bacterial xylose isomerases from the mammal gut Bacteroidetes cluster function in Saccharomyces cerevisiae for effective xylose fermentation. Microbial cell factories 14, 70–71, doi: 10.1186/s12934-015-0253-1 (2015). [DOI] [PMC free article] [PubMed] [Google Scholar]
- Singh K. M. et al. High potential source for biomass degradation enzyme discovery and environmental aspects revealed through metagenomics of Indian buffalo rumen. BioMed research international 2014, 267189, doi: 10.1155/2014/267189 (2014). [DOI] [PMC free article] [PubMed] [Google Scholar]
- Li J. et al. An integrated catalog of reference genes in the human gut microbiome. Nature biotechnology 32, 834–841, doi: 10.1038/nbt.2942 (2014). [DOI] [PubMed] [Google Scholar]
- Bouchard D. S. et al. Lactic acid bacteria isolated from bovine mammary microbiota: potential allies against bovine mastitis. PloS one 10, e0144831, doi: 10.1371/journal.pone.0144831 (2015). [DOI] [PMC free article] [PubMed] [Google Scholar]
- Jakaitis B. M. & Denning P. W. Human breast milk and the gastrointestinal innate immune system. Clinics in perinatology 41, 423–435, doi: 10.1016/j.clp.2014.02.011 (2014). [DOI] [PMC free article] [PubMed] [Google Scholar]
- Caporaso J. G. et al. PyNAST: a flexible tool for aligning sequences to a template alignment. Bioinformatics 26, 266–267, doi: 10.1093/bioinformatics/btp636 (2010). [DOI] [PMC free article] [PubMed] [Google Scholar]
- Claesson M. J. et al. Comparative analysis of pyrosequencing and a phylogenetic microarray for exploring microbial community structures in the human distal intestine. PloS one 4, e6669, doi: 10.1371/journal.pone.0006669 (2009). [DOI] [PMC free article] [PubMed] [Google Scholar]
- Peng Y., Leung H. C. M., Yiu S. M. & Chin F. Y. L. IDBA-UD: a de novo assembler for single-cell and metagenomic sequencing data with highly uneven depth. Bioinformatics 28, 1420–1428, doi: 10.1093/bioinformatics/bts174 (2012). [DOI] [PubMed] [Google Scholar]
- Zhu W. H., Lomsadze A. & Borodovsky M. Ab initio gene identification in metagenomic sequences. Nucleic Acids Research 38, e132, doi: 10.1093/nar/gkq275 (2010). [DOI] [PMC free article] [PubMed] [Google Scholar]
- Li W. Z. & Godzik A. Cd-hit: a fast program for clustering and comparing large sets of protein or nucleotide sequences. Bioinformatics 22, 1658–1659 (2006). [DOI] [PubMed] [Google Scholar]
- Langmead B., Trapnell C., Pop M. & Salzberg S. L. Ultrafast and memory-efficient alignment of short DNA sequences to the human genome. Genome Biology 10, R25, doi: 10.1186/gb-2009-10-3-r25 (2009). [DOI] [PMC free article] [PubMed] [Google Scholar]
- Patil K. R. & Nielsen J. Uncovering transcriptional regulation of metabolism by using metabolic network topology. Proceedings of the National Academy of Sciences of the United States of America 102, 2685–2689, doi: 10.1073/pnas.0406811102 (2005). [DOI] [PMC free article] [PubMed] [Google Scholar]
- Zink D. AOAC international’s technical division on reference materials (tdrm) reference materials database. Journal of Aoac International 99, 1146–1150 (2016). [DOI] [PubMed] [Google Scholar]
- Matos C., Moutinho C., Almeida C., Guerra A. & Balcao V. Trace element compositional changes in human milk during the first four months of lactation. International Journal of Food Sciences and Nutrition 65, 547–551, doi: 10.3109/09637486.2014.893281 (2014). [DOI] [PubMed] [Google Scholar]
- Zapala M. A. & Schork N. J. Multivariate regression analysis of distance matrices for testing associations between gene expression patterns and related variables. Proceedings of the National Academy of Sciences of the United States of America 103, 19430–19435 (2006). [DOI] [PMC free article] [PubMed] [Google Scholar]
- Asomaning N. & Archer K. J. High-throughput DNA methylation datasets for evaluating false discovery rate methodologies. Computational Statistics and Data Analysis 56, 1748–1756, doi: 10.1016/j.csda.2011.10.020 (2012). [DOI] [PMC free article] [PubMed] [Google Scholar]
Associated Data
This section collects any data citations, data availability statements, or supplementary materials included in this article.
Supplementary Materials
Data Availability Statement
The sequence data reported in this paper have been deposited in the NCBI database (Metagenomic data: SRP075434).


