

Within the past two decades, the annual number of emergency department (ED) visits increased over 40%, but the number of EDs decreased by 11%.1 The closure of an ED can have a profound effect on a community2–5 as patients now have to drive further to obtain care and the remaining EDs have to bear the extra patient volume, especially for patients experiencing time-sensitive illnesses requiring prompt intervention, such as acute myocardial infarction (AMI).
Using patient data from 100% Medicare Provider Analysis and Review between 2001 and 2011 (1.35 million patients), linked with the Healthcare Provider Cost Reporting Information System, and American Hospital Association Annual Surveys, we compare changes in access to cardiac technology (availability of catheterization lab, cardiac care unit, and cardiac surgery capacity), treatment received (PTCA and thrombolytic therapy), and health outcomes (30-day, 90-day, and 1-year mortality) among Medicare AMI patients whose communities experience varying degrees of increase in driving time to their next available ED when the closest ED to the community shuts down, relative to patients from communities that do not experience any permanent ED closure.
Our key variable of interest was whether a patient’s community experienced an ED closure and how far a patient from such a community had to travel to reach the next available ED. We identified the closest ED to a given community by computing actual driving time between each patient-hospital pair using Google Maps queries based on the pair’s geographical coordinates. We then evaluated year-to-year change and classified the communities according to whether the driving time between a community and the nearest ED met the following conditions between 2001 and 2013: (1) did not increase (the control group); (2) increased by less than 10 minutes; or (3) increased by 10–30 minutes; and (4) increased by more than 30 minutes.
We applied a linear probability model with ZIP code fixed effects to estimate the effect of increased driving time to the nearest ED on patient outcomes where the key identifying variables are the ED access change categories defined above, while controlling for time-varying patient and hospital characteristics, and year indicators to capture the macro trends. Additional details are available upon request. This study was approved by the Institutional Review Board of the National Bureau of Economic Research.
We found that without controlling for access, the net effect of ED closure on treatment was negligible, as there were virtually no decreases in likelihood for PTCA or thrombolytic treatment when a community experienced a local ED closure (results available upon request). Such findings likely reflect two competing effects of ED closure: time delays might increase the need for more intensive treatment, but at the same time decrease access to cardiac capacity. When we controlled for access to cardiac technology, we found that the PTCA rates increased steadily across the three ED access categories: by 1.99 (CI 0.49, 3.49) in communities with <10 min increase in driving time, 2.37 (CI 0.61, 4.13) in communities with 10–<30 min increase, and 2.67 percentage points (CI −3.42, 8.76, wide CI likely due to small sample size) in communities with at least a 30-minute increase, respectively, relative to patients in communities with no ED closure nearby.
The Figure also shows that patients whose driving time related to local ED closure increased by ≥30 minutes had a statistically significant increase in 90-day mortality by 6.58 percentage points (CI 2.49, 10.68) and 1-year mortality by 6.52 percentage points (CI 1.69, 11.35). To put these magnitudes in perspective, the 90-day mortality rate is 22% in the reference group. A 6.58 percentage point increase represents a 30% increase in 90-day mortality. Patients whose driving time increased by 10–<30 minutes also had a significant but less pronounced increase in 90-day and 1-year mortality, by 1.60 percentage points (CI 0.53, 2.67) and 2.05 percentage points (CI 0.96, 3.14), respectively. Patients whose driving time increased by less than 10 minutes did not experience worse mortality rates after ED closure occurred in their communities.
Figure.
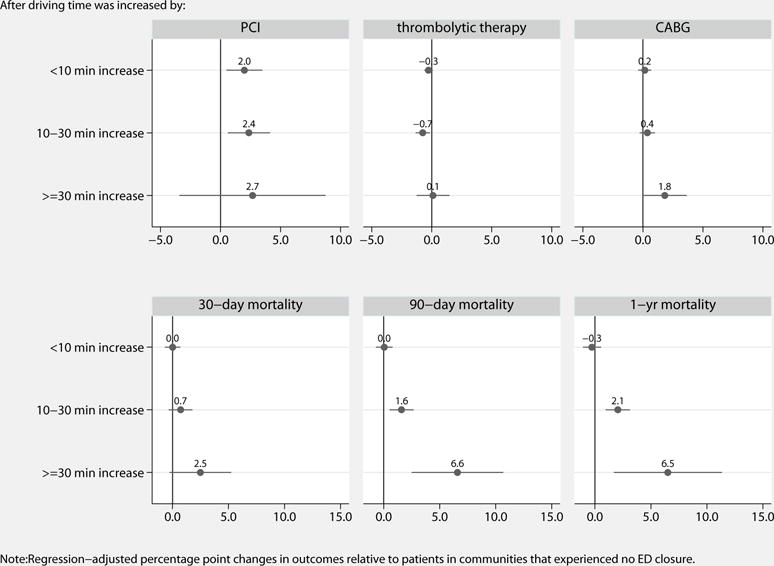
Regression-adjusted percentage point changes in treatment and outcomes
Our results suggested that when patients had to drive at least 10 more minutes to their next available ED upon local ED closure, time delay became the dominant mechanism in affecting health outcomes when local ED closure occurred, both directly and indirectly through its effect on access and treatment. The adverse effects of time delay on mortality rates did not resolve even after we controlled for access and treatment, suggesting that the time delays likely made the prognosis worse, directly affecting mortality rates. Our findings suggest that permanent ED closure has substantial consequences on patient outcomes, particularly among communities with limited resources for time-sensitive illnesses such as AMI. We can conclude that while provision of necessary cardiac technology is one important factor for remaining hospitals, the effects of a time delay due to an ED closure are not easily mitigated.
Acknowledgments
We especially thank Thomas J. Nuckton, MD, for writing assistance and Sarah Sabbagh, MPH, for editorial and administrative assistance.
Sources of Funding
This research was supported by the National Heart, Lung, and Blood Institute of the National Institutes of Health under Grant Award Number R01HL114822, and the American Heart Association under Grant Award Number 13CRP14660029.
Role of the Sponsors
The sponsors had no role in the design and conduct of the study; collection, management, analysis, and interpretation of the data; preparation, review, or approval of the manuscript; and decision to submit the manuscript for publication
Footnotes
Disclosures
None.
Disclaimer
The contents of the article are solely the responsibility of the authors and do not necessarily represent the official views of the National Institutes of Health.
References
- 1.AHA. Avalere Health analysis of AHA Annual Survey data, 2013, for community hospitals. Vol. 2015 US Census Bureau: National and State Population Estimates; Jul 1, 2013. Trendwatch Chartbook 2015: Emergency Department Visits, Emergency Department Visits per 1,000 Persons, and Number of Emergency Departments, 1993–2013. [Google Scholar]
- 2.Hsia RY, Kanzaria HK, Srebotnjak T, Maselli J, McCulloch C, Auerbach AD. Is emergency department closure resulting in increased distance to the nearest emergency department associated with increased inpatient mortality? Ann Emerg Med. 2012;60:707–715.e704. doi: 10.1016/j.annemergmed.2012.08.025. [DOI] [PMC free article] [PubMed] [Google Scholar]
- 3.Liu C, Srebotnjak T, Hsia RY. California emergency department closures are associated with increased inpatient mortality at nearby hospitals. Health Aff (Millwood) 2014;33:1323–1329. doi: 10.1377/hlthaff.2013.1203. [DOI] [PMC free article] [PubMed] [Google Scholar]
- 4.Sun BC, Mohanty SA, Weiss R, Tadeo R, Hasbrouck M, Koenig W, Meyer C, Asch S. Effects of hospital closures and hospital characteristics on emergency department ambulance diversion, Los Angeles County, 1998 to 2004. Ann Emerg Med. 2006;47:309–316. doi: 10.1016/j.annemergmed.2005.12.003. [DOI] [PubMed] [Google Scholar]
- 5.Evans M. After a hospital closes, a community’s health can improve. 2015 http://www.modernhealthcare.com/article/20150509/MAGAZINE/305099964. Accessed June 1, 2016.