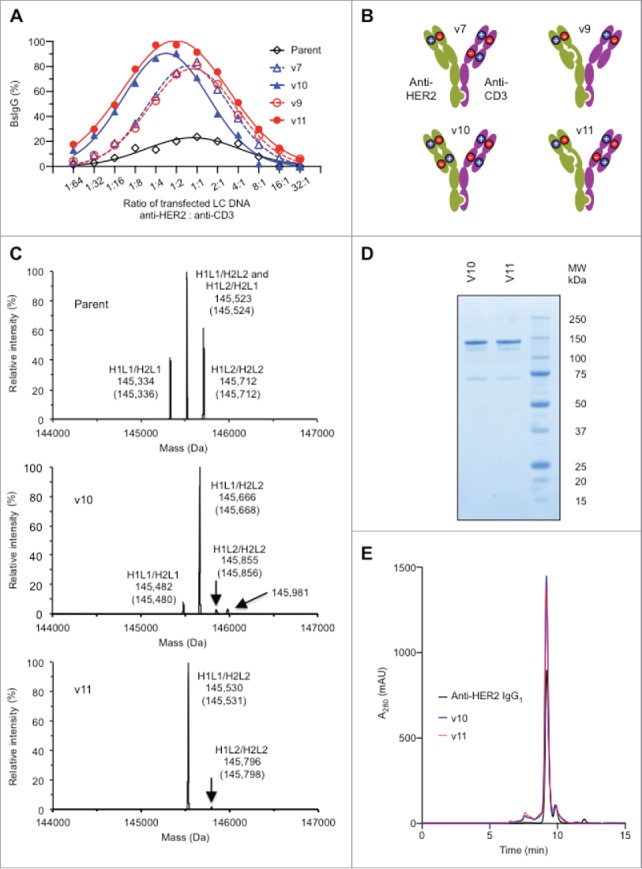
Figure 3.

Optimization of BsIgG production and characterization of lead designs (A) Optimization of BsIgG yield from orthogonal Fab designs by varying the ratio of LC DNA (by weight). The ratio of HC DNAs was fixed at 1:1. (B) Representation of the two most successful orthogonal Fab designs, variants v10 and v11, together with their precursors, variants v7 and v9, respectively (see Table 1). (C) Analysis of BsIgG variants purified by protein A chromatography by liquid chromatography-MS highlighting the increased BsIgG content v10 and v11 compared with the parent with no Fab arm mutations. H1 and L1 represent the HC and LC of anti-HER2, whereas H2 and L2 represent the HC and LC of anti-CD3. The experimentally determined masses and theoretical masses (in parentheses) of each IgG species are indicated. The identity of the minor peak of 145,981 Da in the v10 sample is not yet known. Data shown are for optimized LC ratios. (D) Non-reducing SDS-PAGE analysis confirmed the high purity and efficient formation of the inter-chain disulfide bonds of protein A purified variants v10 and v11. (E) Size exclusion chromatography of protein A purified variants v10 and v11 confirmed the presence of the intact 150 kDa species as well as overall low levels of high and low molecular weight species similar to the bivalent parental anti-HER2 IgG1.
