

Abstract
BACKGROUND
Cancer and its treatment lead to increased financial distress for patients. To the authors' knowledge, to date, no standardized patient‐reported outcome measure has been validated to assess this distress.
METHODS
Patients with AJCC Stage IV solid tumors receiving chemotherapy for at least 2 months were recruited. Financial toxicity was measured by the COmprehensive Score for financial Toxicity (COST) measure. The authors collected data regarding patient characteristics, clinical trial participation, health care use, willingness to discuss costs, psychological distress (Brief Profile of Mood States [POMS]), and health‐related quality of life (HRQOL) as measured by the Functional Assessment of Cancer Therapy: General (FACT‐G) and the European Organization for Research and Treatment of Cancer (EORTC) QOL questionnaires. Test‐retest reliability, internal consistency, and validity of the COST measure were assessed using standard‐scale construction techniques. Associations between the resulting factors and other variables were assessed using multivariable analyses.
RESULTS
A total of 375 patients with advanced cancer were approached, 233 of whom (62.1%) agreed to participate. The COST measure demonstrated high internal consistency and test‐retest reliability. Factor analyses revealed a coherent, single, latent variable (financial toxicity). COST values were found to be correlated with income (correlation coefficient [r] = 0.28; P<.001), psychosocial distress (r = ‐0.26; P<.001), and HRQOL, as measured by the FACT‐G (r = 0.42; P<.001) and by the EORTC QOL instruments (r = 0.33; P<.001). Independent factors found to be associated with financial toxicity were race (P = .04), employment status (P<.001), income (P = .003), number of inpatient admissions (P = .01), and psychological distress (P = .003). Willingness to discuss costs was not found to be associated with the degree of financial distress (P = .49).
CONCLUSIONS
The COST measure demonstrated reliability and validity in measuring financial toxicity. Its correlation with HRQOL indicates that financial toxicity is a clinically relevant patient‐centered outcome. Cancer 2017;123:476–484. © 2016 American Cancer Society.
Keywords: cost of cancer, financial burden, financial toxicity, patient‐reported outcome (PRO)
Short abstract
The COmprehensive Score for financial Toxicity (COST) is validated in a novel sample of patients with cancer. Independent factors found to be associated with financial toxicity include race, employment, income, number of inpatient admissions, and psychological distress.
INTRODUCTION
Patients with cancer often are confronted with the financial consequences of cancer treatment, which may include significant out‐of‐pocket costs, loss of income, and caregiver burden.1, 2 The objective financial consequences of cancer, as well as the subjective financial concerns, have been broadly termed “financial toxicity.”3, 4 This burden has since been linked with several clinically relevant patient outcomes, including health‐related quality of life (HRQOL)5; symptom burden6; compliance7; and, most recently, survival.8
Within the context of current policies and the Patient Protection and Affordable Care Act (ACA), many newly insured patients are expected to have a higher cost share because of preferential enrollment into high‐deductible plans offering greater upfront affordability.9, 10, 11 Combined with escalating cancer costs, these high‐deductible plans may increase financial distress and further exacerbate disparities in cancer care. To abrogate the impact of financial distress and minimize its potential to augment disparities, there is an urgent need for policy makers, researchers, and clinicians to accurately measure financial toxicity. However, to the best of our knowledge, this patient‐centered toxicity is rarely assessed in clinical practice or research.12
The COmprehensive Score for financial Toxicity (COST) patient‐reported outcome measure (PROM) was previously developed by de Souza et al4 to assess financial toxicity in patients with cancer. In a multistep process, 155 patients with advanced cancer were interviewed to develop the 11‐item COST measure. In response to the urgent need for such a tool, the instrument was adopted into clinical practice and research before the establishment of its psychometric properties.13 The current study examines the COST measure with respect to its psychometric properties, or how well it measures the construct of interest. The importance of knowing these properties was emphasized by the US Food and Drug Administration guidance on PROMs, in which it was recommended that an instrument's measurement properties should be well established before its use.14 Finally, to assess its relevance for clinical practice as well as patient‐centered research, we also aimed to evaluate whether patient‐reported financial toxicity was correlated with HRQOL.
MATERIALS AND METHODS
Sample
Patients were eligible if they were aged ≥18 years with a diagnosis of AJCC stage IV cancer, regardless of prior disease. Patients receiving chemotherapy (oral, intravenous, or both) for at least 2 months at the time of the interview and with an Eastern Cooperative Oncology Group performance status (ECOG PS) of 0 to 2 were approached for participation. Because the goal of the current study was to determine whether this instrument was valid in measuring financial concerns, we chose patients with advanced disease who had been receiving therapy for at least 2 months as a sample most likely to have received health care bills and to have experienced financial issues. Patients were recruited at 2 separate cancer centers: The University of Chicago Medicine and The NorthShore University HealthSystem. The study protocol was approved by local Institutional Review Boards, and all patients provided informed consent. Patients were recruited from May 2013 to February 2015. Potential participants were told that the general goal of the study was “to learn about factors that may affect your experience as a cancer patient,” but they were not prospectively told the specific objectives of the current study.
Measures
Sociodemographic characteristics, health care use, and willingness to discuss costs
Data related to age, sex, education, work status, marital status, race, ethnicity, ECOG PS, and cancer type were collected. We asked patients for their income from all sources within the previous year. Household income was measured as a function of the federal poverty level (FPL).The FPL is used for Health Insurance Marketplace cost assistance under the ACA, in which tax credit eligibility for health insurance ranges from 138% to 400% of the FPL in states that decided to expand Medicaid. Financial toxicity was measured by the COST measure (Fig. 1).4 Lower COST values indicate more financial toxicity. General mood disturbance or psychological distress was measured by the Brief Profile of Mood States (Brief‐POMS).15 Emergency department visits and inpatient admissions from 1 year before the interview date were collected as measures of health resource use. To control for different communication preferences related to costs and thus any resulting bias when responding to the questionnaires, patients were asked whether they were willing to discuss costs with their medical team (“I would like to talk about my out‐of‐pocket health care costs when a test or treatment is recommend”).16 This question is based on the seminal work of Alexander et al for the assessment of communication preferences.16 Concurrent participation in a clinical trial at the time of the interview also was recorded because patients taking part in clinical trials may not be responsible for some of their treatment costs.
Figure 1.
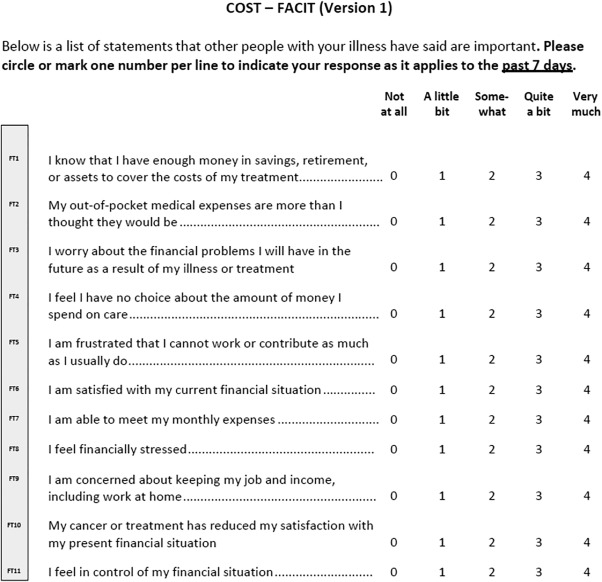
COmprehensive Score for financial Toxicity (COST)‐Functional Assessment of Chronic Illness Therapy (FACIT). Items 2, 3, 4, 5, 8, 9, and 10 were reverse scored. The lower the score, the worse the financial toxicity.
HRQOL assessments
HRQOL was assessed by 2 widely validated instruments: the Functional Assessment of Cancer Therapy‐General (FACT‐G)17 and the European Organization for Research and Treatment of Cancer's Quality of Life Questionnaire‐global health status (EORTC‐QOL).18 We hypothesized that higher financial toxicity would have mild to moderate correlation with worse HRQOL.
Psychometric analyses
Guidelines from the International Society for Pharmacoeconomics and Outcomes Research (ISPOR)19, 20 and the COSMIN study (COnsensus‐based Standards for the selection of health Measurement INstruments)21 for PROM development were followed. The methods used to assess the factor structure and its analysis are available in the Supporting Information.
Reliability and Validity
The internal consistency of the COST measure, or the degree to which individual items that comprise the scale measure the same latent variable, was assessed by the Cronbach α. Values > .90 were considered excellent. In addition, for a sample of patients, the COST measure was readministered within a 7‐day interval (test‐retest). The test‐retest reliability was assessed by the intraclass correlation coefficient (ICC) using a 1‐way random effects model.
Convergent validity was assessed by calculating the Pearson correlation between the COST and the Brief‐POMS measures. We hypothesized that the COST measure (financial toxicity) would have a mild to moderate and statistically significant correlation with the Brief‐POMS measure (psychological distress). Similarly, we hypothesized that the COST measure would have a mild to moderate, statistically significant correlation with income. The rationale for the mild and moderate correlations is that strong correlations would conclude that the COST PROM would actually be measuring psychological distress, HRQOL, or income, rather than financial toxicity. Divergent validity was assessed using correlations between the Marlowe‐Crowne Social Desirability Scale (MCSDS)22 and the COST measure. The MCSDS is a widely used measure of self‐reported social desirability. For validation purposes, it measures the degree to which individuals attempt to present themselves in a favorable light. We hypothesized that financial toxicity would not have statistically significant correlations with social desirability. All the instruments are described in Supporting Information Table 1.
Factors Associated With Financial Toxicity
Multivariable linear regression analyses were performed to compare the average COST values obtained from groups of patients that were expected to differ with respect to the construct (“known groups” validity). The dependent variable was the COST value. Independent variables considered included: patient sociodemographic characteristics, cancer type, length of original diagnosis (from the time of the original cancer diagnosis to the interview date), health care use, psychological distress, communication preferences, and whether the patient was taking part in a clinical trial. Considering the financial domain of this PROM, we included household income and use of health care resources (with potential implications for cost‐sharing and loss of income) as additional factors to be investigated. We thus hypothesized that individuals in lower FPL groups would have worse financial toxicity, as would patients with higher health care use (as measured by emergency department visits or inpatient admissions), independent of the other variables.
Statistical Analyses
Differences between participants and nonparticipants with regard to baseline characteristics were tested using Student t tests or chi‐square tests, as appropriate. The Pearson correlation coefficient was used to assess the relation between the COST measure and HRQOL. In addition, partial correlations with HRQOL were calculated, adjusting for age,23 ECOG PS,24 and variables that were found to be significantly associated with financial toxicity on multivariable analyses. Correlations were defined as mild if between 0.20 and 0.39, moderate if between 0.40 and 0.59, strong if between 0.60 and 0.79, and very strong if between 0.80 and 1.0. A sample size of 233 patients provided 80% power with which to detect a correlation coefficient >0.18 between the COST measure and the HRQOL instruments using a 2‐sided significance level of .05. For the test‐retest analysis, a sample size of 20 patients who were assessed twice within a 7‐day period provided > 80% power to demonstrate excellent reliability25 (ICC of 0.75, assuming an ICC under the null hypothesis of 0.35) with a significance level of .05. In differential item functioning analyses, a Bonferroni correction was used to control for multiple comparisons, with a P value threshold set at <.0045. On the multivariable analyses, variables included in the final model were those approaching statistical significance on univariable analysis (P<.10), and those in which we had a substantial interest (clinical trial participation and willingness to discuss costs). Interactions were tested, and if they were found to be statistically significant, they were included in the final model. Missing data were addressed by each instrument's guidelines. All analyses were performed with Stata statistical software (version 13; StataCorp LP, College Station, Tex).26
RESULTS
Of the 375 patients who were approached, 236 (62.9%) agreed to participate. Reasons for nonparticipation were “not interested in any research” (103 patients) and “not feeling well” (36 patients). In addition, 3 patients started the survey and withdrew consent due to its financial connotation, leaving a total of 233 evaluable patients (participation rate of 62.1%). Respondents were more likely to be younger on average (58.42 years vs 63.21 years; P<.001) and married (73.3% vs 61.3%; P = .02) compared with nonrespondents. Sex (P = .08), insurance status (P = .07), race (P = .07), and household income distribution (P = .07) were found to demonstrate a trend toward a difference but did not reach statistical significance at the .05 level. Data regarding the 142 patients (37.9%) who declined participation are shown in Online Supporting Information Table 2.
Participants had a median age of 59 years (range, 27‐88 years; mean ± standard deviation [SD], 58.42 ± 11.47 years), and 58% of patients were female. All had health insurance coverage, which was mostly private or purchased by their employer (62%), followed by Medicare with or without supplementation (31%). No patients had acquired insurance through the ACA Marketplace. The median length of time from the first cancer diagnosis was 485 days (range, 56‐9294 days). The median household income was 376% of the FPL (range, 0%‐7964%). In addition, 47% of patients had completed college or had achieved higher education, whereas 15% had less than a college education, with 5.1% of patients having less than a high school education. The median COST value was 23 (range, 0‐44; mean ± SD, 22.23 ± 11.89). Table 1 summarizes the characteristics of the patients included in the analyses, as well as their COST values. Online Supporting Information Table 3 describes their primary tumor types. Online Supplementary Information Table 4 shows the factor analysis results.
Table 1.
Patient Characteristics and COST Valuesa
| Characteristic | N = 233 | COST (Mean±SD)a | Univariable P |
|---|---|---|---|
| Institution | |||
| The University of Chicago | 199 (85.4%) | 22.34 ± 11.79 | .74 |
| NorthShore University HealthSystem | 34 (14.6%) | 21.60 ± 12.65 | |
| Median age (range), y | 59 (27‐88) | ||
| ≤50 | 51 (21.9%) | 20.56 ± 11.71 | .05 |
| 51‐64 | 110 (47.2%) | 20.88 ± 11.84 | |
| 65‐75 | 56 (24.0%) | 25.51 ± 10.98 | |
| ≥75 | 16 (6.9%) | 25.37 ± 14.01 | |
| Sex | |||
| Female | 136 (58.4%) | 20.62 ± 11.57 | .01 |
| Male | 97 (41.6%) | 24.50 ± 12.02 | |
| Marital status | |||
| Married | 170 (73.0%) | 23.27 ± 11.86 | .02 |
| Divorced/separated/widowed | 38 (16.3%) | 20.99 ± 11.86 | |
| Never married | 24 (10.3%) | 16.40 ± 10.67 | |
| Race/ethnicity | |||
| White, non‐Hispanic | 154 (66.1%) | 23.90 ± 12.21 | .03 |
| African American | 54 (23.2%) | 18.92 ± 10.71 | |
| Hispanic | 14 (6.0%) | 18.46 ± 9.73 | |
| Other (Asian and Native American) | 10 (4.3%) | 21.54 ± 11.40 | |
| Education level | |||
| <Collegeb | 36 (15.5%) | 22.20 ± 12.04 | .11 |
| Some college or technical training | 87 (37.3%) | 20.28 ± 11.18 | |
| Completed college | 55 (23.6%) | 22.29 ± 11.92 | |
| Graduate or professional degree | 55 (23.6%) | 25.29 ± 12.51 | |
| Insurance type | |||
| Private or employer‐based | 144 (61.8%) | 21.89 ± 11.75 | .04 |
| Medicare (with or without supplementation) | 73 (31.3%) | 24.47 ± 11.99 | |
| Medicaid | 13 (5.6%) | 15.31 ± 8.14 | |
| COBRA continuation coverage | 3 (1.3%) | 14.20 ± 19.17 | |
| Employment status | |||
| Working (full time or part time) | 78 (33.5%) | 25.08 ± 11.85 | <.001 |
| Unemployed | 21 (9.0%) | 12.37 ± 10.72 | |
| Retired | 76 (32.6%) | 25.84 ± 10.81 | |
| On short‐term or long‐term disability | 45 (19.3%) | 14.98 ± 8.82 | |
| Others (student or homemaker) | 12 (5.1%) | 26.69 ± 9.49 | |
| ECOG performance status | |||
| 0 | 116 (49.8%) | 21.61 ± 11.89 | .26 |
| 1 | 76 (32.6%) | 23.68 ± 11.27 | |
| 2 | 5 (2.1%) | 16.42 ± 15.57 | |
| Median length of cancer diagnosis (range) | 485 d (56‐9294 d) | ||
| ≤1 y | 90 (38.6%) | 21.26 ± 11.90 | .32 |
| > 1 y | 143 (61.4%) | 22.84 ± 11.89 | |
| Median household income (range) of poverty level | 376.6% (0%‐7964%) | ||
| ≤200% of poverty level | 27 (11.6%) | 15.44 ± 10.03 | <.001 |
| 200%‐400% of FPL | 83 (35.6%) | 20.98 ± 10.77 | |
| 400%‐600% of FPL | 50 (21.5%) | 20.95 ± 13.01 | |
| 600%‐800% of FPL | 21 (9.0%) | 27.57 ± 11.28 | |
| >800% of FPL | 24 (10.3%) | 31.50 ± 10.01 | |
| Median no. of inpatient admissions (range) | 1 (0‐12) | ||
| ≤2 | 156 (66.9%) | 23.39 ± 11.46 | .009 |
| ≥3 | 41 (17.6%) | 17.99 ± 12.26 | |
| Median no. of emergency room visits (range) | 0 (0‐7) | ||
| ≤2 | 187 (80.3%) | 22.21 ± 11.76 | .77 |
| ≥3 | 10 (4.3%) | 23.32 ± 13.22 | |
| Median Brief‐POMS (range) | 14 (1‐50) | <.001 | |
Abbreviations: COBRA, Consolidated Omnibus Budget Reconciliation Act; COST, COmprehensive Score for financial Toxicity; ECOG, Eastern Cooperative Oncology Group; FPL, federal poverty level; POMS, Profile of Mood States; SD, standard deviation.
Some percentages do not add to 100% due to missing data. Univariate P values were derived from linear regression models.
Lower COST values indicate higher toxicity.
The category for less than a college education included 12 patients (5.1%) who completed junior high or middle school and 24 patients (10.3%) who completed high school.
Reliability and Validity
The COST measure demonstrated excellent internal consistency, with a Cronbach α of .92. The Cronbach alphas for males and females were comparable at .92 and .91, respectively. The test‐retest analysis revealed an ICC of 0.80 (95% confidence interval, 0.57‐0.92). The Pearson correlation for the COST measure and the Brief‐POMS was ‐0.26 (P<.001), indicating that worse financial toxicity was correlated with higher psychological distress. Not surprisingly, financial toxicity was found to be correlated with household income at 0.28 (P<.001), indicating financial toxicity (lower COST values) among patients in the lower FPL groups. With regard to divergent validity, the association between the COST measure and social desirability (MCSDS) was near zero (0.11) and not statistically significant (P = .11), as initially hypothesized.
Factors Associated With Financial Toxicity
As shown in Table 1, we found several factors that were associated with financial toxicity on univariable analyses. Communication preferences and clinical trial status were not found to be significantly associated with financial toxicity (Table 2). However, given their theoretical importance when assessing financial toxicity, they were included as potential confounders in the multivariable analyses. In the final multivariable model, employment status (P<.001), race (P = .04), household income (P = .003), psychological distress (P = .003), and the number of inpatient admissions (P = .01) were found to be significantly associated with financial toxicity when controlling for age, sex, marital status, insurance type, clinical trial participation, and communication preferences, as shown in Table 3. It is important to note that no statistically significant interactions were found, including the interaction between employment and income (P = .32). Nonwhite individuals tended to have lower COST scores (worse financial toxicity) compared with white individuals. Similarly, unemployed patients had lower COST scores compared with other groups, reaching statistical significance for all groups except those on disability. Higher psychological distress values were associated with lower COST scores. Those patients with ≥ 3 inpatient admissions had lower COST scores (indicating worse financial toxicity), by nearly 6 points on average, compared with those with fewer admissions. In addition, a higher household income as a percentage of the FPL was found to be associated with higher COST scores (less financial toxicity), as those at >800% of the FPL had a nearly 12‐point higher mean COST score compared with those at ≤200% of the FPL.
Table 2.
COST Values, Willingness to Discuss Costs, and Clinical Trial Status
| N = 233 | COST (Mean ± SD) | Univariable P | |
|---|---|---|---|
| Willing to discuss costs with care team | |||
| Yes | 106 (45.5%) | 22.54 ± 12.41 | .49 |
| No or unsure | 105 (45.1%) | 21.42 ± 11.28 | |
| Clinical trial status | |||
| Yes | 65 (27.9%) | 23.26 ± 11.92 | .41 |
| No | 168 (72.1%) | 21.84 ± 11.89 | |
Abbreviations: COST, COmprehensive Score for financial Toxicity; SD, standard deviation.
Some percentages do not add to 100% due to missing data. Univariate P values were derived from linear regression models. Lower COST values indicate higher toxicity.
Table 3.
| Factor | Coefficient (95% CI) | Adjusted P |
|---|---|---|
| Race/ethnicity | .04 | |
| White, non‐Hispanic | (Base) | |
| Hispanic | −2.41 (−8.66 to 3.83) | |
| African American | −5.14 (−9.60 to −0.67) | |
| Other (Asian and Native American) | −9.85 (−19.82 to 0.12) | |
| Household income | .003 | |
| ≤200% of FPL | (Base) | |
| >200%‐400% of FPL | 2.55 (−2.85 to 7.95) | |
| >400%‐600% of FPL | 3.61 (−2.12 to 9.34) | |
| >600%‐800% of FPL | 9.39 (0.80 to 17.98) | |
| >800% of FPL | 11.68 (4.93 to 18.44) | |
| Employment status | <.001 | |
| Unemployed | (Base) | |
| On short‐term or long‐term disability | 2.30 (−4.04 to 8.65) | |
| Working (full or part time) | 9.58 (3.03 to 16.14) | |
| Retired | 10.69 (3.58 to 17.81) | |
| Others (student or homemaker) | 12.61 (3.71 to 21.50) | |
| No. of inpatient admissions | .01 | |
| ≤2 | (Base) | |
| ≥3 | −5.52 (−9.87 to −1.16) | |
| Psychological distress‐Brief‐POMS (per 1‐point increase) | −0.34 (−0.56 to −0.12) | .003 |
Abbreviations: 95% CI, 95% confidence interval; COST, COmprehensive Score for financial Toxicity; FPL, federal poverty level; POMS, Profile of Mood States.
Lower COST values indicate higher toxicity.
The multivariate model included those variables with a P<.1 on univariate analysis in addition to communication preferences and clinical trial participation (only the variables that remained significant on the multivariate model are presented in the table).
Financial Toxicity and HRQOL
The median FACT‐G value was 79 (range, 23‐108; mean ± SD, 77.01 ± 17.21). The median EORTC‐QOL value was 66 (range, 0‐100; mean ± SD, 61.51 ± 22.41). The Pearson correlation for the COST measure and the FACT‐G was 0.42 (P<.001), whereas its correlation with the EORTC‐QOL was 0.33 (P<.001). When we controlled for age, ECOG PS, income, psychological distress, inpatient admissions, employment status, and ethnicity, these correlations remained statistically significant (FACT‐G partial correlation of 0.31 [P<.001]; and EORTC‐QOL partial correlation of 0.20 [P<.001]), thereby confirming our hypothesis that financial toxicity was correlated with worse HRQOL.
DISCUSSION
Using a hypothesis‐based approach,19, 20, 21 the results of the current study validate the COST measure as a measure of financial toxicity specifically developed for patients with cancer. We also demonstrated its statistically significant correlation with HRQOL, thus establishing it as a clinically relevant patient‐centered measure.
The reported correlations (Brief‐POMS, HRQOL, and income) were mild but statistically significant, as hypothesized. These correlations add to the instrument's validity because it demonstrates that the COST‐PROM is not measuring psychosocial distress, HRQOL, or income, as we would potentially observe with strong or very strong correlations. The identification of factors associated with financial toxicity is equally important. To the best of our knowledge, the current study is the first to report on the relationship between financial toxicity and the use of health care resources. We found that higher numbers of inpatient admissions were associated with higher financial toxicity, even when adjusted for potentially confounding factors. The importance of inpatient admissions in total health care costs has been demonstrated previously. Chastek et al27 demonstrated that 55% of total health care costs within the last 6 months of life are related to inpatient admissions. However, to our knowledge, the study by Chastek et al did not address patient's financial toxicity. In the current study, we demonstrated that inpatient admissions also impact the financial toxicity of individual patients.
The current study has several strengths. First, we analyzed data regarding individuals who declined participation, with only 3 patients withdrawing consent because of this being a study assessing financial issues. A major strength also was assessing potential confounders when measuring financial toxicity. We controlled for psychological distress and for participation in clinical trials, and the results were found to be independent of these factors. In addition, although communication preferences were not the focus of the current study, there was the theoretical concern that a patient's willingness to discuss financial issues could potentially introduce bias into the patient's perspective about the topic and, thus, the self‐reported COST assessment. However, the willingness to discuss financial issues was not found to be significantly associated with COST values. Finally, an instrument is of little relevance if it is not correlated with clinically meaningful outcomes. Herein, we demonstrated that financial toxicity, as measured by the COST measure, is correlated with HRQOL as measured by 2 validated quantitative HRQOL instruments (FACT‐G and EORTC‐QOL), when adjusting for potentially confounding factors.
A limitation of the current study is that the study sample was drawn from tertiary referral health care centers, and all participants had some form of insurance coverage. However, it is well known that even insured patients can face significant financial burdens, especially if their insurance plan has high deductibles or if patients are at risk of exceeding lifetime limits.10 In addition, because it was not feasible to extensively and repeatedly interview patients with a poor ECOG PS, we limited our sample to those patients with an ECOG PS <3. Also, given our cross‐sectional design, we did not assess whether financial toxicity was related to out‐of‐pocket costs, loss of productivity, or other factors. These limitations should be considered from the perspective that the goal of the current study was to develop a financial toxicity instrument and not to identify all the populations at risk or the drivers of financial toxicity within this validation cohort. We aimed to demonstrate that this instrument measures what it was designed to measure. Therefore, the objective of the current study was to empirically demonstrate the association between financial toxicity, as measured by this instrument, with well‐known social factors that in theory would play a role in it, demonstrating the validity of the instrument. In this regard, race, income, inpatient admissions, and employment status were found to be associated with financial toxicity in the current study population, as measured by the COST instrument, independent of psychological distress, the willingness to discuss costs, and other factors. Underserved groups within the current study sample, such as those with low income, as well as African American individuals, were found to have worse COST values; it is likely that the findings of the current study would be replicated in uninsured or underinsured samples. This hypothesis should be validated and confirmed in future studies with a more diverse insurance case mix and specifically designed to identify populations at risk, such as those with less than a high school education, which was also a population relatively underrepresented in the current study sample (5.1%). Similarly, the differences with regard to the drivers of financial toxicity among patients with different cancer types should be examined because these drivers may vary by the type of disease or by the type of treatment. Although toxicity thresholds were not analyzed within this validation sample, the quantitative nature of the COST instrument will allow further prospective studies to determine the exact impact of financial toxicity on HRQOL in comparison with other symptoms and on other outcomes, such as survival. These prospective studies also are needed to determine responsiveness to change, as well as floor and ceiling effects of the COST‐PROM. Finally, because the objective of the current study was to validate whether the COST‐PROM captured financial toxicity, we needed patients who had actually had experience with health care bills. Therefore, we assessed patients with stage IV disease who were receiving treatment for at least 2 months with chemotherapy, and we were unable to conclude that newly diagnosed patients would provide similar results.
As society increasingly considers the costs incurred by patients with cancer as a side effect of treatment, instruments to measure financial toxicity should be patient‐centered, scientifically derived, and clinically relevant. The correlation with HRQOL establishes financial toxicity as a clinically relevant, patient‐centered measure. The incorporation of financial toxicity assessments into observational research and clinical trials will ensure a patient‐centered foundation in the evaluation of financial distress.
FUNDING SUPPORT
Supported by grant University of Chicago Institute for Translational Medicine‐Clinical Translational Science Award UL1 TR000430.
CONFLICT OF INTEREST DISCLOSURES
Kristen Wroblewski received a grant from the National Institutes of Health/National Cancer Institute (P30 CA14599) for work performed as part of the current study. Mark J. Ratain has received equity as a cofounder of PrescriptIQ; personal fees from multiple drug companies for acting as an expert witness in patent litigation; personal fees from AbbVie; personal fees and stock options from Biscayne Pharmaceuticals; grants from Dicerna Pharmaceuticals; and personal fees from Cantex Pharmaceuticals, Genentech, Kinex Pharmaceuticals, Onconova Therapeutics, Shionogi, Xspray, Agios Pharmaceuticals, Cyclacel, Drais Pharmaceuticals, Circle Pharma, Portola Pharmaceuticals, and Venaxis for work performed outside of the current study. In addition, Dr. Ratain has a patent related to UGT1A1 genotyping and irinotecan use with royalties paid to the Mayo Clinic and a patent related to a genomic prescribing system licensed to PrescriptIQ.
AUTHOR CONTRIBUTIONS
Jonas A. de Souza participated in planning, conducting, interpreting and reporting and is the guarantor of the study. Bonnie J. Yap, Kristen Wroblewski, Christopher K. Daugherty, and David Cella participated in planning, conducting, and reporting the study. Victoria Blinder, Fabiana S. Araújo, Fay J. Hlubocky, Lauren H. Nicholas, Jeremy M. O'Connor, Bruce Brockstein, and Mark J. Ratain participated in interpretation and reporting.
Supporting information
Additional supporting information may be found in the online version of this article
Supporting Information
We thank Jocelyn Herrera, Kristen Kipping‐Johnson, and Nancy Haefling for their support.
REFERENCES
- 1. Bestvina CM, Zulling LL, Rushing C, et al. Patient‐oncologist cost communication, financial distress, and medication adherence. J Oncol Pract. 2014;10:162–167. [DOI] [PMC free article] [PubMed] [Google Scholar]
- 2. Northouse L, Williams Al, Given B, McCorkle R. Psychosocial care for family caregivers of patients with cancer. J Clin Oncol. 2012;30:1227–1234. [DOI] [PubMed] [Google Scholar]
- 3. Pollack, A . For profit, industry seeks cancer drugs. The New York Times. September 1st, 2009. http://www.nytimes.com/2009/09/02/health/research/02cancerdrug.html. Accessed September 20, 2016.
- 4. de Souza JA, Yap BJ, Hlubocky FJ, et al. The development of a financial toxicity patient‐reported outcome in cancer: the COST measure. Cancer. 2014;120:3245–3253. [DOI] [PubMed] [Google Scholar]
- 5. Zafar SY, McNeil RB, Thomas CM, Lathan CS, Ayanian JZ, Provenzale D. Population‐based assessment of cancer survivors' financial burden and quality of life: a prospective cohort study. J Oncol Pract. 2015;11:145–150. [DOI] [PMC free article] [PubMed] [Google Scholar]
- 6. Lathan CS, Cronin A, Tucker‐Seeley R, Zafar SY, Ayanian JZ, Schrag D. Association of financial strain with symptom burden and quality of life for patients with lung or colorectal cancer. J Clin Oncol. 2016;34:1732–1740. [DOI] [PMC free article] [PubMed] [Google Scholar]
- 7. Neugut AI, Subar M, Wilde ET, et al. Association between prescription co‐payment amount and compliance with adjuvant hormonal therapy in women with early‐stage breast cancer. J Clin Oncol. 2011;29:2534–2542. [DOI] [PMC free article] [PubMed] [Google Scholar]
- 8. Ramsey SD, Bansal A, Fedorenko CR, et al. Financial insolvency as a risk factor for early mortality among patients with cancer. J Clin Oncol. 2016;34:980–986. [DOI] [PMC free article] [PubMed] [Google Scholar]
- 9. The Henry J. Kaiser Family Foundation . What the actuarial values in the Affordable Care Act mean. http://www.kff.org/healthreform/upload/8177.pdf. Accessed September 20, 2016.
- 10. Ungar L, O'Donnel J. Dilemma over deductibles: costs crippling middle class. http://www.usatoday.com/story/news/nation/2015/01/01/middle-class-workers-struggle-to-pay-for-care-despite-insurance/19841235/. Accessed September 20, 2016.
- 11.High‐deductible health plans, gamble for some, on the rise [transcript]. All Things Considered. National Public Radio. July 28, 2013. http://www.npr.org/2013/07/28/206370593/high-deductible-health-plans-gamble-for-some-on-the-rise. Accessed September 20, 2016.
- 12. Zafar SY, Peppercorn JM, Schrag D, et al. The financial toxicity of cancer treatment: a pilot study assessing out‐of‐pocket expenses and the insured cancer patient's experience. Oncologist. 2013;18:381–390. [DOI] [PMC free article] [PubMed] [Google Scholar]
- 13. Huntington SF, Weiss BM, Vogl DT, et al. Financial toxicity in insured patients with multiple myeloma: a cross‐sectional pilot study. Lancet Haematol. 2015;2:e408–e416. [DOI] [PubMed] [Google Scholar]
- 14. U.S. Department of Health and Human Services FDA Center for Drug Evaluation and Research; U.S. Department of Health and Human Services FDA Center for Biologics Evaluation and Research ; U.S. Department of Health and Human Services FDA Center for Devices and Radiological Health. Guidance for industry: patient‐reported outcome measures: use in medical product development to support labeling claims: draft guidance. Health Qual Life Outcomes. 2006;4:79. [DOI] [PMC free article] [PubMed] [Google Scholar]
- 15. Cella DF, Jacobsen PB, Orav EJ, Holland JC, Silberfarb PM, Rafla S. A brief POMS measure of distress for cancer patients. J Chronic Dis. 1987;40:939–942. [DOI] [PubMed] [Google Scholar]
- 16. Alexander GC, Casalino LP, Meltzer DO. Patient‐physician communication about out‐of‐pocket costs. JAMA. 2003;290:953–958. [DOI] [PubMed] [Google Scholar]
- 17. Cella DF, Tulsky DS, Gray G, et al. The Functional Assessment of Cancer Therapy scale: development and validation of the general measure. J Clin Oncol. 1993;11:570–579. [DOI] [PubMed] [Google Scholar]
- 18. Aaronson NK, Ahmedzai S, Bergman B, et al. The European Organization for Research and Treatment of Cancer QLQ‐C30: a quality‐of‐life instrument for use in international clinical trials in oncology. J Natl Cancer Inst. 1993;85:365–376. [DOI] [PubMed] [Google Scholar]
- 19. Patrick DL, Burke LB, Gwaltney CJ, et al. Content validity–establishing and reporting the evidence in newly developed patient‐reported outcomes (PRO) instruments for medical product evaluation: ISPOR PRO Good Research Practices Task Force report: part 1–eliciting concepts for a new PRO instrument. Value Health. 2011;14:967–977. [DOI] [PubMed] [Google Scholar]
- 20. Patrick DL, Burke LB, Gwaltney CJ, et al. Content validity–establishing and reporting the evidence in newly developed patient‐reported outcomes (PRO) instruments for medical product evaluation: ISPOR PRO Good Research Practices Task Force report: part 2‐assessing respondent understanding. Value Health. 2011;14:978–988. [DOI] [PubMed] [Google Scholar]
- 21. Mokkink LB, Terwee CB, Patrick DL, et al. The COSMIN checklist for assessing the methodological quality of studies on measurement properties of health status measurement instruments: an international Delphi study. Qual Life Res. 2010;19:539–549. [DOI] [PMC free article] [PubMed] [Google Scholar]
- 22. Crowne DP, Marlowe D. A new scale of social desirability independent of psychopathology. J Consult Psychol. 1960;24:349–354. [DOI] [PubMed] [Google Scholar]
- 23. Park BW, Lee S, Lee AR, Lee KH, Hwang SY. Quality of life differences between younger and older breast cancer patients. J Breast Cancer. 2011;14:112–118. [DOI] [PMC free article] [PubMed] [Google Scholar]
- 24. Faller H, Brahler E, Harter M, et al. Performance status and depressive symptoms as predictors of quality of life in cancer patients. A structural equation modeling analysis. Psychooncology. 2015;24:1456–1462. [DOI] [PubMed] [Google Scholar]
- 25. Streiner DL, Norman GR. Health Measurement Scales: A Practical Guide to Their Development and Use. 2nd ed. New York: Oxford University Press; 1995. [Google Scholar]
- 26. StataCorp LP. Stata Statistical Software: Release 13. College Station, TX: StataCorp LP; 2013. [Google Scholar]
- 27. Chastek B, Harley C, Kallich J, Newcomer L, Paoli CJ, Teitelbaum AH. Health care costs for patients with cancer at the end of life. J Oncol Pract. 2012;8:75s–80s. [DOI] [PMC free article] [PubMed] [Google Scholar]
Associated Data
This section collects any data citations, data availability statements, or supplementary materials included in this article.
Supplementary Materials
Additional supporting information may be found in the online version of this article
Supporting Information