

Abstract
MicroRNAs (miRNA) are short single‐stranded RNA sequences that have a role in the post‐transcriptional regulation of genes. The identification of tissue specific or enriched miRNAs has great potential as novel safety biomarkers. One longstanding goal is to associate the increase of miRNA in biofluids (e.g., plasma and urine) with tissue‐specific damage. Next‐generation sequencing (miR‐seq) was used to analyze changes in miRNA profiles of tissue, plasma and urine samples of rats treated with either a nephrotoxicant (cisplatin) or one of two hepatotoxicants (acetaminophen [APAP] or carbon tetrachloride [CCL4]). Analyses with traditional serum chemistry and histopathology confirmed that toxicant‐induced organ damage was specific. In animals treated with cisplatin, levels of five miRNAs were significantly altered in the kidney, 14 in plasma and six in urine. In APAP‐treated animals, five miRNAs were altered in the liver, 74 in plasma and six in urine; for CCL4 the changes were five, 20 and 6, respectively. Cisplatin treatment caused an elevation of miR‐378a in the urine, confirming the findings of other similar studies. There were 17 in common miRNAs elevated in the plasma after treatment with either APAP or CCL4. Four of these (miR‐122, −802, −31a and −365) are known to be enriched in the livers of rats. Interestingly, the increase of serum miR‐802 in both hepatotoxicant treatments was comparable to that of the well‐known liver damage marker miR‐122. Taken together, comparative analysis of urine and plasma miRNAs demonstrated their utility as biomarkers of organ injury. Copyright © 2016 The Authors. Journal of Applied Toxicology published by John Wiley & Sons Ltd.
Keywords: microRNA, miR‐seq, biomarker, hepatotoxicity, nephrotoxicity, bioinformatics
Short abstract
MicroRNAs (miRNA) have great potential as novel safety biomarkers. Next‐generation sequencing was used to analyze changes in miRNA profiles of tissue, plasma and urine samples of rats treated with either a nephrotoxicant (cisplatin) or one of two hepatotoxicants (acetaminophen or carbon tetrachloride). Cisplatin treatment caused an elevation of miR‐378a in the urine, confirming the findings of other similar studies. Treatment with either acetaminophen or carbon tetrachloride caused a serum elevation of four liver‐enriched miRNAs (miR‐122, −802, −31a and −365).
Introduction
Biomarkers are critical for the pre‐clinical assessment of drug toxicity and provide information about which tissues are affected, the extent of damage, and provide a convenient way to monitor the injury as it increases in severity or recovers. Recent attention has focused on the use of microRNA (miRNA) as a novel class of predictive safety biomarkers (Ozer et al., 2008). miRNAs are short 21–25 nucleotide RNAs that regulate the expression and function of much of the genome (He & Hannon, 2004). Certain miRNAs are highly enriched in one tissue (Etheridge et al., 2011) and can be readily detected in biofluids after injury (Blondal et al., 2013). In humans, urinary miRNA has been assessed in patients with kidney damage (Konta et al., 2014; Maluf et al., 2014). One example of an established predictive miRNA biomarker is miR‐122, which has been used to assess hepatotoxicity in rodents (Wang et al., 2009), dogs (Harrill et al., 2014; Koenig et al., 2016) and humans (Starkey Lewis et al., 2011).
The Sprague–Dawley strain of rat is an important non‐clinical species that is routinely used in toxicological evaluations of compounds. Whole body miRNA atlases rats were compiled using either a miRNA microarray platform (Minami et al., 2014) or more recently a next‐generation sequencing (miR‐seq) approach (Smith et al., 2016). Both technologies have their advantages/disadvantages that are extensively described elsewhere (Git et al., 2010; Hurd & Nelson, 2009; Kelly et al., 2013). However, one key limitation with arrays is that they are limited to preselected miRNAs, which can hamper the identification of novel miRNAs (Yang et al., 2012). A direct comparison of both technologies in a rodent toxicity model concluded that miR‐seq had superior specificity and detected more miRNA isoforms than the array approach (Nassirpour et al., 2014). Thus, miR‐seq appears to be the more robust platform for the detection of novel miRNA biomarkers.
The goal of this study was to dose rats with toxicants that caused nephrotoxicity or hepatotoxicity, and then identify changes within the miRNA expression profiles in urine, plasma and tissue. Kidney damage was caused by cisplatin, a chemotherapeutic, and liver damage was induced by either an over‐the‐counter pain reliever acetaminophen (APAP) or the industrial solvent carbon tetrachloride (CCL4). Single doses of these three classical toxicants were previously shown in rats to cause organ‐specific damage (Kanki et al., 2014; Yang et al., 2012). Here, animals received a single acute dose of vehicle or one of the three agents, and samples were collected at time points when organ injury was the most extensive. Serum chemistry and microscopic analysis were used to determine the extent of tissue damage. The time‐matched miRNA expression profile of all samples was then determined using miR‐seq urine, plasma and tissue.
Materials and methods
Animals
Eight‐week‐old male Sprague–Dawley rats were purchased from Charles River Laboratories and acclimated to their surroundings for 5 days. The environmental conditions of the animal facility were: a 12: 12 h light/dark cycle; a temperature of 18–29 °C; a relative humidity of 50 ± 20%; and ventilation changes of ≥10 per hour. Animals were supplied with an autoclaved pellet diet (Lab Diet® no. 5002; PMI Nutrition International LLC, St. Louis, MO, USA) and ad libitum with reverse osmosis‐filtered water. Animals were randomly assigned to groups by a weight‐ordered distribution before dosing and individually housed in wire‐bottom stainless steel suspended caging. All animal experiments for this study were conducted in accordance with Millennium Pharmaceutical's Institutional Animal Care and Use Committee Guidelines.
Dosing
Eight rats each received one of the following: (1) 5 ml intravenous administration of 2 or 5 mg kg−1 cisplatin or vehicle (0.9% sterile saline); (2) 10 ml oral gavage of 400 or 1250 mg kg−1 APAP or vehicle (0.5% methylcellulose); or (3) 10 ml oral gavage of 250 or 1500 mg kg−1 CCL4 or vehicle (corn oil). Cisplatin was purchased from Teva Pharmaceuticals (Cambridge, MA, USA) while both APAP and CCL4 were purchased from Sigma‐Aldrich (St. Louis, MO, USA). Four animals from each group were euthanized 24 h post‐dose and the remaining four animals were euthanized at 72 h post‐dose. Animals first received intramuscular injection of an anesthetic cocktail (75 mg kg−1 ketamine HCl, 2.5 mg kg−1 xylazine and 2.5 mg kg−1 acepromazine) and exsanguinations were performed in accordance with accepted American Veterinary Medical Association guidelines.
Biological sample collection
The day before scheduled death, rats were transferred to metabolic cages designed for urine collection. Animals were fasted overnight but had access to water. Urine was collected at approximately 24 (n = 8) and 72 (n = 4) h post‐dose in individual bottles on wet ice that were underneath cages. Urine was centrifuged (1000 g for 1 min at 4 °C) to remove debris, aliquoted and stored at ≤ − 70 °C. Urine creatinine was measured with a Beckman Coulter AU680 Chemistry System (Danvers, MA, USA) by Idexx Laboratories (Grafton, MA, USA), and urinary KIM‐1 was quantified with the Kidney Injury Panel 1 (rat) Kit (Meso Scale Diagnostics, Rockville, MD, USA) using a Meso Scale Discovery Sector Imager 2400 following manufacturer's instructions. Raw KIM‐1 values were then normalized to urine creatinine.
Whole blood was collected and processed into both serum and plasma from either the lateral tail vein (non‐terminal) or vena cava (terminal). To obtain serum, blood was collected into tubes containing no anticoagulant, allowed to clot and centrifuged at 4 °C. For plasma, blood was collected into tubes containing ethylenediaminetetraacetic acid and centrifuged at 4 °C. Serum was analyzed with a Beckman Coulter AU680 by Idexx Laboratories for serum chemistry markers of kidney damage (blood urea nitrogen and serum creatinine) or liver damage (alanine transaminase [ALT] and aspartate transaminase [AST]).
Kidney and liver samples were collected at necropsy at 24 and 72 h post‐dose and rinsed in sterile saline. For miRNA analysis, tissues were snap frozen in liquid nitrogen and stored at ≤ − 70 °C. For microscopic evaluation, tissues were fixed in 10% neutral buffered formalin, embedded in paraffin, sectioned at 4–6 μm, mounted on glass slides, stained with hematoxylin and eosin and analyzed by a qualified veterinary pathologist. Microscopic findings were reported in concordance with the standardized nomenclature for classifying lesions within the kidney (Frazier et al., 2012) and liver (Thoolen et al., 2010) of rats.
RNA isolation and miRNA analysis
Total RNA was isolated from 200 μl plasma or urine by Asuragen (Austin, TX, USA) following a proprietary small‐scale biofluid RNA isolation procedure. Samples were eluted in 20 μl of water to 10 urine equivalents or plasma equivalents per μl. The quality of miRNAs was determined by a proprietary quantitative reverse transcription–polymerase chain reaction (PCR) panel of three miRNAs. Normalization between samples was done using U6 spliceosomal RNA as a housekeeping control. The relative abundance of miRNAs in relation to U6 spliceosomal RNA was calculated using the dCt method (Vandesompele et al., 2002).
Isolation of miRNA from 50 μm tissue samples used a lysis buffer (RLT [Qiagen, Hilden, Germany] + 1% β mercaptoethanol) and a rotor‐stator homogenizer. RNA was extracted from tissue homogenate with KingFisher Pure RNA Tissue Kit (Thermo Scientific, Cambridge, MA, USA). Briefly, tissue homogenates were combined with magnetic beads and ethanol, and loaded on to a KingFisher Magnetic Particle Processor (Thermo Scientific). Samples were DNase‐treated, washed and eluted in RNase‐free water. RNA samples were only used in subsequent analysis if they had both a 260: 280 measurement >1.6 and a RNA integrity number > 6.0, as measured by a Caliper LabChip GX (Perkin‐Elmer, Waltham, MA, USA).
Samples from three animals within each treatment were analyzed for changes in miRNA levels using miR‐seq. A TruSeq Small RNA Library Kit (Illumina, San Diego, CA, USA) was used for library construction of rat miRNA. Sequencing was performed on the GAIIx (Illumina) at 36 base pair read length and targeting 12 million reads per sample. Adaptor sequences were clipped and OSA v4 (http://omicsoft.com/osa) was used to align the reads to the rat genome (Rnor_5.0) and to MiRBase (v.21) (Kozomara & Griffiths‐Jones, 2014) allowing for two mismatches and excluding any reads that aligned to >10 genomic locations. Expression levels were quantified by counting the number of reads aligned to mature miRNA region. Differential miRNA analysis was calculated using the DESeq2 generalized linear model (Love et al., 2014). This algorithm was designed for high‐throughput sequencing data that determined fold‐change and statistical significance with a Wald test based on a negative binomial distribution of read counts. Comprehensive data files used for the miR‐seq analysis were uploaded to the Gene Expression Omnibus database (accession number GSE79017). A total of 832 different miRNAs were detected by miR‐seq across all samples.
Results
Cisplatin caused kidney damage 72 h post‐dose while both acetaminophen and carbon tetrachloride damaged livers at 24 h post‐dose
An analysis of serum chemistry and evaluation of microscopic damage was necessary to understand how the various agents damaged tissues. Briefly, eight Sprague–Dawley rats received a single administration of one of three vehicles, cisplatin, APAP or CCL4. Four animals within each group were euthanized at 24 h post‐dose, while the remaining four were euthanized at 72 h post‐dose. A breakdown of the sample collection and analysis scheme is presented in Fig. 1. Traditional serum chemistry and histopathology were initially used to define the severity and specificity of organ injury. Upon completion of this analysis and identification of the dose and time point that corresponded to maximal damage, frozen plasma aliquots were analyzed by miR‐seq.
Figure 1.
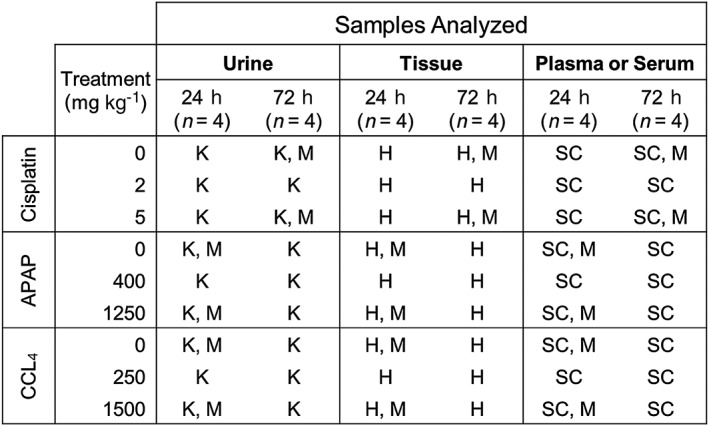
Scheme for sample collection. Urine, tissue, plasma and serum were collected from rats dosed with vehicle or toxicants at the indicated time points. The following assays were performed: K, KIM‐1 urinary analysis; H, histopathology; M, miR‐seq; SC, serum chemistry. APAP, acetaminophen; CCL4, carbon tetrachloride.
Animals were dosed with either 2 or 5 mg kg−1 cisplatin and the kidney effects were evaluated. These doses were selected based on results from a previous rat miRNA study that used single doses of cisplatin (Kanki et al., 2014). The 5 mg kg−1 cisplatin dose, but not 2 mg kg−1, caused a significant elevation in serum blood urea nitrogen (Fig. 2A) and creatinine (Fig. 2B) that was highest at 72 h post‐dose. Urinary KIM‐1 is a protein marker of kidney damage (Han et al., 2002). Levels of KIM‐1, normalized against urinary creatinine, were highest 72 h after the 5 mg kg−1 cisplatin dose (Fig. 2C). Representative histological images of 72 h post‐dose control and cisplatin‐treated kidney tissues illustrate renal tubule necrosis of the outer medulla (Fig. 2D). The incidence and severity of kidney findings are presented in Fig. 2(E). Damage was primarily observed in the 72 h post‐dose cohort. The 5 mg kg−1 cisplatin group had the greatest level of necrosis of the outer medulla of the renal tubule and of the macula densa. Vehicles did not cause any damage and neither dose of cisplatin resulted in liver damage (Supplementary Fig.S1.
Figure 2.
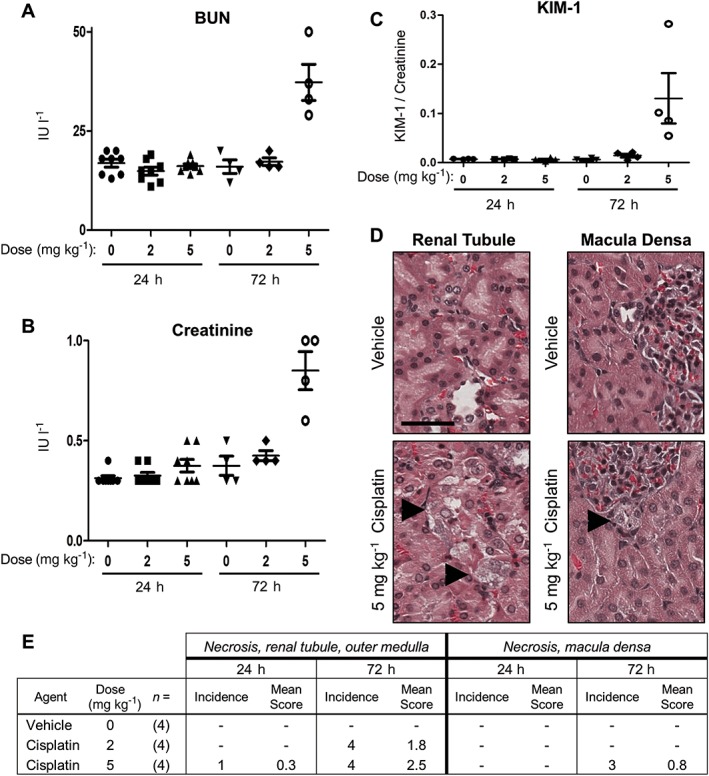
Cisplatin caused maximal kidney damage at 72 h post‐dose. Rats received vehicle, 2 or 5 mg kg−1 cisplatin and were assessed for kidney damage at 24 and 72 h post‐dose. (A) Serum BUN. (B) Serum creatinine. (C) Urinary KIM‐1 (ng ml−1) was normalized to urinary creatinine. (D) Representative histological images of control and treated kidney renal tubule (left) and macula densa (right) sections. Black arrowheads indicate necrosis, and the black bar is 50 μm. (E) Incidence and severity of kidney microscopic findings. Findings were graded on a scale of 0 (absent), 1 (minimal), 2 (mild), 3 (moderate), or 4 (marked). BUN, blood urea nitrogen.
To induce hepatotoxicity, animals received either 400 or 1250 mg kg−1 APAP, or 250 or 1500 mg kg−1 CCL4. The doses were selected based results from a previous rat miRNA study that used single doses of these compounds (Yang et al., 2012). The liver effects were assessed by serum chemistry and histopathology at 24 and 72 h post‐dose. In 1250 mg kg−1 APAP‐dosed animals, serum levels of the liver damage markers ALT and AST were respectively greater at 24 h (252 and 902 IU l−1) compared to 72 h post‐dose (38 and 175 IU l−1) (Fig. 3A,B). Levels of ALT (71 and 89 IU l−1) and AST (208 and 288 IU l−1) were similar at the 24 and 72 h, respectively, in animals dosed with 1600 mg kg−1 CCL4 (Fig. 3A,B). Representative histological images of livers from vehicle or either treatment illustrate necrosis (Fig. 3C; black arrowheads) and vacuolization (CCL4 only; white arrowheads) proximal to the central vein. These findings indicate that damage caused by both APAP and CCL4 was more severe at 24 h than at 72 h, where it appeared to be resolving (Fig. 3D). The lower doses of APAP and CCL4 were not further evaluated. Vehicles did not cause any damage and there were no test article‐related kidney findings (Supplementary Fig.S1).
Figure 3.
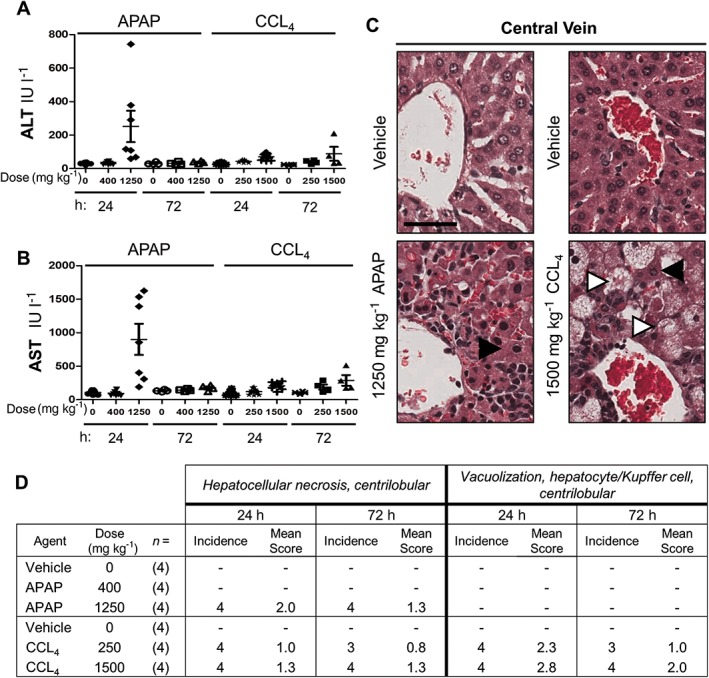
APAP and CCL4 caused maximal liver damage at 24 h post‐dose. Rats received the indicated concentrations of vehicle, APAP or CCL4 and were assessed for liver damage at 24 and 72 h post‐dose. (A) Serum ALT. (B) Serum AST. (C) Representative histological images of control and treated liver central vein sections. Black arrowheads indicate necrosis, white arrowheads indicate vacuolization; and black bar 50 μm. (D) Incidence and severity of liver microscopic findings. Findings were graded on a scale of 0 (absent), 1 (minimal), 2 (mild), 3 (moderate) or 4 (marked). ALT, alanine aminotransferase; APAP, acetaminophen; AST, aspartate aminotransferase; CCL4, carbon tetrachloride.
Treatment with cisplatin, acetaminophen and carbon tetrachloride caused changes in miRNAs from tissue, plasma and urine
The combination of serum chemistry and histopathology demonstrated that the treatments were organ‐specific and established the progression of the injury over time. Samples (kidney, plasma and urine) were analyzed by miR‐seq from 72 h post‐cisplatin animals, and samples (liver, plasma and urine) were analyzed from 24 h post APAP or CCL4 animals. The criteria used to determine significant changes were Log2 expression fold changes ≥1.5 with P < 0.05, which were consistent with criteria used in previous rat miRNA studies (Nassirpour et al., 2014; Yang et al., 2012). For simplicity, the stem–loop names and fold changes of miRNAs are presented in the main text, and only elevated miRNAs are reported for urine and plasma. Complete details of mature miRNA isoforms, statistical P values, gene families and accession numbers are included in Supplementary Table S1.
There were 832 different miRNAs detected by miR‐seq across all samples (Supplementary Table S1). While 455 miRNAs were shared in common with this miR‐seq and the standard TLDA card (TaqMan Array Rodent MicroRNA A + B Cards Set v3.0 [Thermo Scientific]), 377 were detected by miR‐seq but not present on the TLDA card (Supplementary Fig.S2). An additional 181 miRNAs were represented on the TLDA card but not detected by miR‐seq. Given that the objective of this study was to identify novel miRNA biomarkers, miR‐seq appeared to show the greatest potential and was used for all analyses.
Cisplatin caused significant changes in the levels of six miRNAs in the urine, 14 in the plasma and five in the kidney (Table 1). Rats dosed with APAP had significant changes in the levels of six miRNAs in the urine, 74 in plasma and five in liver; for CCL4 the changes were six, 20 and five, respectively. Volcano plots of every miRNA detected in each sample are shown for cisplatin (Supplementary Fig.S3), APAP (Supplementary Fig.S4) and CCL4 (Supplementary Fig. S5).
Table 1.
Significantly altered rat miRNAs across treatments and samples
| 5 mg kg−1 Cisplatin | 1250 mg kg−1 APAP | ||||||
|---|---|---|---|---|---|---|---|
| Kidney | Plasma | Liver | Plasma | ||||
| miRNA | Fold‐change | miRNA | Fold‐change | miRNA | Fold‐change | miRNA | Fold‐change |
| rno‐miR‐34a | 2.36 | rno‐miR‐34c | 3.14 | rno‐miR‐92a | 1.67 | rno‐miR‐410 | 5.35 |
| rno‐miR‐146b | 1.66 | rno‐miR‐128 | 2.40 | rno‐miR‐155 | 1.66 | rno‐miR‐29c | 5.23 |
| rno‐miR‐34c | 1.53 | rno‐miR‐34a | 2.09 | rno‐miR‐21 | 1.65 | rno‐miR‐582 | 5.08 |
| rno‐miR‐144 | −1.53 | rno‐miR‐130b | 2.01 | rno‐miR‐223 | 1.62 | rno‐miR‐30a | 4.92 |
| rno‐miR‐451 | −1.94 | rno‐miR‐702 | 1.82 | rno‐miR‐146b | 1.56 | rno‐miR‐125b | 4.89 |
| rno‐miR‐6215 | 1.75 | rno‐miR‐107 | 4.47 | ||||
| Urine | rno‐miR‐484 | 1.74 | Urine | rno‐miR‐466c | 4.32 | ||
| rno‐miR‐134 | 1.69 | rno‐miR‐505 | 3.80 | ||||
| rno‐miR‐378a | 6.12 | rno‐let‐7e | 1.66 | rno‐miR‐320 | 12.05 | rno‐miR‐466b | 3.68 |
| rno‐miR‐1839 | 3.82 | rno‐miR‐151 | 1.63 | rno‐miR‐126a | 5.96 | rno‐miR‐3559 | 3.62 |
| rno‐miR‐140 | 3.39 | rno‐miR‐191a | 1.59 | rno‐miR‐185 | 5.75 | rno‐miR‐221 | 3.53 |
| rno‐miR‐26b | 3.07 | rno‐miR‐431 | 1.55 | rno‐miR‐130b | 4.93 | rno‐miR‐1249 | 3.52 |
| rno‐let‐7 g | 2.40 | rno‐miR‐181b | 1.52 | rno‐miR‐148a | 4.07 | rno‐miR‐499 | 3.22 |
| rno‐miR‐22 | 1.77 | rno‐miR‐92b | 1.51 | rno‐miR‐3473 | 2.22 | rno‐miR‐31a | 3.19 |
| rno‐miR‐674 | 3.17 | ||||||
| Plasma | rno‐miR‐455 | 3.17 | |||||
| rno‐miR‐101a | 3.12 | ||||||
| rno‐miR‐802 | 175.75 | rno‐miR‐195 | 3.08 | ||||
| rno‐miR‐122 | 112.42 | rno‐miR‐21 | 3.07 | ||||
| rno‐miR‐320 | 65.50 | rno‐miR‐671 | 3.04 | ||||
| 1500 mg kg−1 CCL4 | rno‐miR‐192 | 61.41 | rno‐miR‐29a | 3.00 | |||
| rno‐miR‐193a | 45.58 | rno‐miR‐26b | 2.76 | ||||
| Liver | Plasma | rno‐miR‐194 | 29.51 | rno‐miR‐374 | 2.75 | ||
| rno‐miR‐200a | 26.49 | rno‐miR‐497 | 2.70 | ||||
| miRNA | Fold‐change | miRNA | Fold‐change | rno‐miR‐182 | 25.36 | rno‐miR‐30c | 2.68 |
| rno‐miR‐22 | 17.89 | rno‐miR‐34a | 2.64 | ||||
| rno‐miR‐146b | 4.18 | rno‐miR‐122 | 27.09 | rno‐miR‐365 | 17.73 | rno‐miR‐27b | 2.63 |
| rno‐miR‐223 | 2.59 | rno‐miR‐802 | 15.99 | rno‐miR‐200b | 17.25 | rno‐miR‐30d | 2.62 |
| rno‐miR‐155 | 2.30 | rno‐miR‐193a | 5.88 | rno‐miR‐429 | 15.96 | rno‐miR‐30e | 2.61 |
| rno‐miR‐342 | 1.50 | rno‐miR‐192 | 4.49 | rno‐miR‐183 | 15.29 | rno‐miR‐361 | 2.42 |
| rno‐miR‐1247 | −1.61 | rno‐miR‐194 | 4.30 | rno‐miR‐378b | 14.66 | rno‐miR‐1843a | 2.41 |
| rno‐miR‐182 | 4.13 | rno‐miR‐101b | 13.00 | rno‐miR‐155 | 2.37 | ||
| Urine | rno‐miR‐365 | 3.52 | rno‐miR‐378a | 12.04 | rno‐miR‐664 | 2.30 | |
| rno‐miR‐200b | 3.23 | rno‐miR‐99a | 11.47 | rno‐let‐7 g | 2.27 | ||
| rno‐miR‐450a | 10.22 | rno‐miR‐22 | 3.03 | rno‐miR‐362 | 9.33 | rno‐miR‐144 | 2.26 |
| rno‐miR‐92a | 5.08 | rno‐miR‐183 | 2.86 | rno‐miR‐592 | 8.18 | rno‐miR‐148a | 2.23 |
| rno‐miR‐184 | 3.89 | rno‐miR‐101b | 2.76 | rno‐miR‐375 | 7.62 | rno‐miR‐103 | 2.10 |
| rno‐miR‐3473 | 2.75 | rno‐miR‐200a | 2.76 | rno‐miR‐152 | 7.42 | rno‐miR‐1839 | 2.09 |
| rno‐let‐7i | 2.67 | rno‐miR‐31a | 2.47 | rno‐miR‐598 | 7.09 | rno‐miR‐210 | 1.98 |
| rno‐miR‐10b | 2.04 | rno‐miR‐429 | 2.34 | rno‐miR‐193b | 6.60 | rno‐let‐7f | 1.92 |
| rno‐miR‐155 | 2.29 | rno‐miR‐1247 | 6.47 | rno‐miR‐345 | 1.91 | ||
| rno‐miR‐19a | 1.91 | rno‐miR‐665 | 6.34 | rno‐miR‐872 | 1.82 | ||
| rno‐miR‐20a | 1.82 | rno‐miR‐23b | 6.20 | rno‐let‐7a | 1.71 | ||
| rno‐miR‐21 | 1.72 | rno‐miR‐293 | 6.00 | rno‐miR‐20a | 1.70 | ||
| rno‐miR‐532 | 1.57 | rno‐miR‐203b | 5.72 | rno‐let‐7c | 1.62 | ||
| rno‐miR‐340 | 1.56 | rno‐miR‐141 | 5.48 | ||||
APAP, acetaminophen; CCL4, carbon tetrachloride.
The stem–loop names of significantly altered miRNAs (Log2 expression fold changes ≥1.5 with P < 0.05) from tissue, urine and plasma are as shown.
Cisplatin treatment caused a sixfold elevation of urinary miR‐378a
There were six elevated miRNAs in the urine after cisplatin treatment. Of these, five were also elevated in a second rat model (Kanki et al., 2014) of cisplatin toxicity (Fig. 4A). When compared to a third study using the nephrotoxicant gentamicin (Nassirpour et al., 2014), only miR‐378a (up 6.1‐fold) and miR‐140 (up 3.4‐fold) were in common in all studies. None of the 11 different miRNAs elevated in the urine after APAP/CCL4 (Table 1) treatment had reported hepatic origins or were enriched in the rat liver (Smith et al., 2016). A single mature miRNA, miR‐320‐5p, was elevated in both the plasma and urine of rats dosed with APAP, but little is known about the function/specificity of this miRNA other than it is expressed in rat gastrointestinal tract (Smith et al., 2016).
Figure 4.
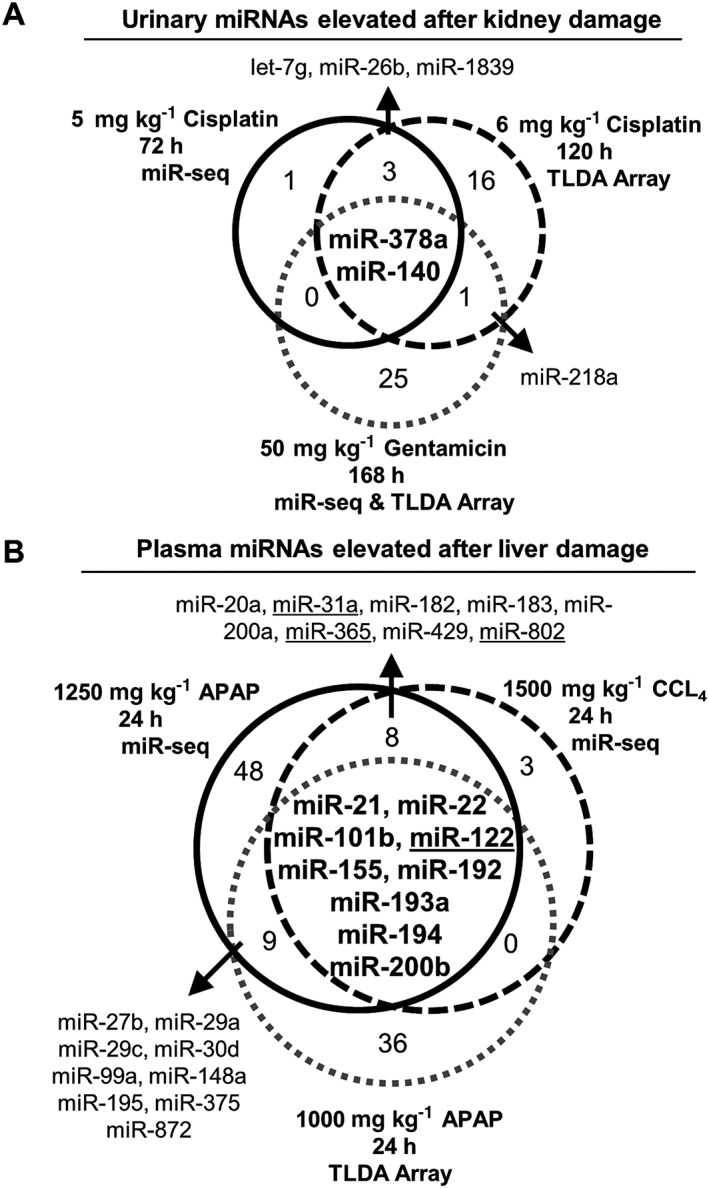
Elevated miRNAs in urine after kidney damage and in plasma after liver damage. Venn diagrams illustrate overlapping miRNAs from this study with other published data. Only the stem–loop miRNA identifiers were used due to differing annotation methods across studies. Dose of toxicant, time point sampled and technological platform (miR‐seq and/or a TLDA card) are indicated. Numbers within each circle represent different miRNAs. (A) Elevated miRNAs observed in this study after cisplatin treatment (black circle) and two other studies by Kanki et al. (2014; black dashed circle) and Nassirpour et al. (2014 . (B) Elevated miRNAs observed in this study after a single dose with APAP (black circle), CCL4 (black dashed circle), or in an APAP study by Yamaura et al. (2014. Four underlined miRNAs were identified by the Smith et al. (2016) rat miRNA atlas as being liver specific/enriched. APAP, acetaminophen; CCL4, carbon tetrachloride; TLDA, TaqMan low‐density rodent miRNA array.
Treatment with acetaminophen and carbon tetrachloride caused an increase in liver‐specific miRNAs in the plasma
Numerous miRNAs were detected in the plasma after treatment with the three toxicants (Table 1). There were 17 elevated miRNAs in common between the APAP/CCL4 treatments (Fig. 4B), some of which overlapped with another rat APAP model (Yamaura et al., 2014). Whenever possible, miRNAs between studies were aligned by mature isoforms, but if that information was lacking, the stem–loop name was used to make comparisons. These 17 miRNAs correspond to 23 different mature miRNA isoforms (Supplementary Fig. S6). Of these, miR‐122‐5p, miR‐122‐3p, miR‐31a‐5p, miR‐365‐3p, miR‐802‐5p and miR‐802‐3p (Fig. 4B, underlined) were specific to the rat liver (Smith et al., 2016). Of note, miR‐122‐3p and miR‐802‐3p are not included on the TaqMan Array Rodent MicroRNA A + B Cards Set v3.0. Previous versions of this technology do not differentiate well between the stem–loop and mature miRNA names. For cisplatin, none of the 14 elevated miRNAs were enriched in the rat kidney (Smith et al., 2016).
Altered miRNAs in kidney or liver tissue after treatment
Kidney or liver injury resulted in few significantly altered miRNAs (Table 1). Expression of miR‐146b was elevated in kidney/liver tissues 1.6–4.2‐fold after each treatment. This miRNA has reported roles in hematopoiesis (Zhai et al., 2014) and in liver fibrosis (Ge et al., 2014) but is not specific to the rat liver (Smith et al., 2016). Within the kidney, while the 2.4‐fold increase of miR‐34a was consistent with previous other rodent models of cisplatin toxicity (Bhatt et al., 2010; Pavkovic et al., 2014), this miRNA is also expressed in many other tissues (Misso et al., 2014; Smith et al., 2016). Both APAP and CCL4 treatments resulted in a 1.6–2.6‐fold elevation of miR‐155 and miR‐223 in the liver. However, others have suggested that these two miRNAs may be linked to lymphocyte infiltration into areas of damage, so their origin is unclear (Yamaura et al., 2014). None of the remaining miRNAs are known to be specific to the kidney or liver (Smith et al., 2016).
Discussion
Rodents are routinely used in non‐clinical investigations to determine the toxicological effects drugs have on the body. Efforts to improve on the traditional serum chemistry markers used to evaluate organ damage have focused on miRNAs. The work described here evaluated miRNA biomarkers of acute kidney and liver damage in Sprague–Dawley rats. Plasma, and not serum, was analyzed to keep findings consistent and comparable to other published studies (Church et al., 2016; Yamaura et al., 2012, 2014). Significantly elevated plasma and urine miRNAs in identified in this study were compared to published rat studies and to the recently completed rat and dog miRNA atlases. We concluded that miR‐378a is a novel urinary biomarker of kidney damage, while miR‐122, miR‐31a, miR‐365 and miR‐802 are plasma markers of liver injury.
One challenge in identifying novel miRNA biomarkers of injury is that many studies report conflicting data. Our twofold approach to provide more confidence in identifying novel biomarkers was to (1) compare our data for one type of organ injury against other studies, and (2) cross‐reference the rat miRNA atlas (Smith et al., 2016). For example, in the study presented here, APAP/CCL4 treatment caused elevation of both the miR‐155 and miR‐223 in the plasma. This finding is of questionable significance given that these two miRNAs have been erroneously identified as “specific” across numerous published studies (Haider et al., 2014). A second example comes from a study that measured urinary miRNAs in rats with liver damage (Yang et al., 2012). Only miR‐182 overlapped between that study and the work presented here, but this miRNA is not enriched in the rat liver (Smith et al., 2016). It is also unclear how miRNAs from tissues not connected to the renal system could enter the urine, as the kidney may serve as a barrier between blood and urinary miRNAs (Weber et al., 2010). There remains considerable doubt that urinary miRNAs have any utility as biomarkers for liver damage.
miR‐378a was primarily detected in skeletal muscle of rats and to a lesser extent the kidneys (Smith et al., 2016). However, this miRNA was one of the highest expressed miRNAs in the entire dog kidney (Koenig et al., 2016). In humans, miR‐378a has also been used as a serum biomarker of renal disease (Hauser et al., 2012; Redova et al., 2012; Wang et al., 2015). Here, cisplatin caused an elevation of miR‐378a in the urine of rats (Table 1), which was also seen in two other studies (Kanki et al., 2014; Nassirpour et al., 2014). All three studies identified kidney tubule damage through the use of histopathology. Taken together, miR‐378a may have utility as a marker of renal tubule damage. Follow‐up investigations are critical to determine whether there is translatability from animals to humans. Of note, miR‐140 was also elevated in the urine of multiple rat nephrotoxicity studies, but was not enriched in either rat or dog kidneys, and thus needs further characterization to evaluate its utility as a biomarker.
The plasma miRNAs with the three highest fold changes in this study were miR‐122, miR‐802 and miR‐192, which respectively represent an established, a putative and a poor biomarker of liver damage. First, miR‐122 is a known biomarker of hepatotoxicity in rats (Smith et al., 2016; Su et al., 2012; Yamaura et al., 2012), dogs (Harrill et al., 2014; Koenig et al., 2016) and humans (Wang et al., 2009). In this study miR‐122 was elevated a respective 112‐ and 27‐fold after treatment with APAP or CCL4 compared to controls (Table 1). Second, miR‐802 was elevated 176‐ and 16‐fold after APAP or CCL4 treatments, and in rats was recently shown to be enriched in the liver (Smith et al., 2016) and was elevated after hepatobiliary injury (Church et al., 2016). Third, while miR‐192 was elevated 4–61‐fold in this study, it is highly expressed across multiple tissue types, such as the kidney (Mladinov et al., 2013) and the rat gastrointestinal tract (Smith et al., 2016). Despite being reported otherwise, miR‐192 may not be a strong candidate biomarker due to its limited tissue specificity. Subsequent validation work is necessary to determine which organ‐specific miRNAs can be used as part of a panel approach to assess tissue injury.
It is unclear why the expression levels of so few miRNAs were significantly altered in tissues, particularly considering that dozens of miRNAs were elevated in the plasma after treatment. The most likely explanation is that this study assessed miRNA changes across whole organs, not just the damaged portions. An improvement to the study design would involve microdissection of areas of damage that could be isolated for subsequent miR‐seq analysis. As a proof of concept, different miRNA expression patterns were identified within the renal cortex and medulla of the dog kidney (Ichii et al., 2014). A second explanation for the scarcity of altered tissue miRNAs is that the time points used for kidney and liver damage were not optimal in capturing the profiles of miRNAs involved in the necrosis and regeneration biological processes. Taken together, none of the significantly altered tissue miRNAs seems to have utility as specific biomarkers of injury at the time points examined in this study.
There are considerable challenges when comparing data from one rat biomarker study to another. At the broadest level, the strain, gender and age of rats influence their basal miRNA expression. Once collected, a urine sample can be normalized measuring creatinine (Nassirpour et al., 2015) or volume (Kanki et al., 2014). Plasma is typically normalized against a housekeeping miRNA (Church et al., 2016; Yang et al., 2012). There are additional hurdles related to the detection technology, such as older generations of TLDA cards that use outdated miRNA nomenclature that make it hard to know whether “miR‐802” refers to the −5 or the −3 mature isoform. A similar problem was demonstrated in one study that used only the “A” card to assess urinary miRNA biomarkers and not the “B″ card that contains the assay for miR‐378a (Nassirpour et al., 2015). For miR‐seq, there are questions about how to normalize data. We used the highly cited DESeq2 generalized linear model (Love et al., 2014), which was also used in an earlier rat miR‐seq biomarker study (Nassirpour et al., 2014). Taken together, while miR‐seq has a great ability to detect novel miRNA biomarkers, there certainly remains value in using TLDA arrays or quantitative PCR to validate results.
One key lesson learned from these studies regards the importance of selecting appropriate time points for sample collection. For example, liver damage caused by APAP was rapid and began to resolve at the end of the study while the CCL4 damage was less severe but lingered. An interesting follow‐up study would be to assess differences in miRNA expression between acute and chronic exposures to these toxicants. Assessing miRNA changes at multiple time points might have provided information about both the initial injury and the healing process. An added benefit of this approach would be to create a stronger model for chronic human renal and hepatic diseases. The next critical step is to evaluate these biomarkers in additional non‐clinical studies with different toxicants to determine how well they can be used to evaluate organ damage.
Conflict of interest
The authors did not report any conflict of interest.
Supporting information
Supporting info item
Supporting info item
Supporting info item
Supporting info item
Supporting info item
Supporting info item
Supporting info item
Supporting info item
Acknowledgements
This was solely supported by Millennium Pharmaceuticals, Inc., a wholly owned subsidiary of Takeda Pharmaceutical Company Limited. We thank Aaron Smith of Eli Lilly and Company for helpful discussions throughout the production of this manuscript.
Wolenski, F. S. , Shah, P. , Sano, T. , Shinozawa, T. , Bernard, H. , Gallacher, M. J. , Wyllie, S. D. , Varrone, G. , Cicia, L. A. , Carsillo, M. E. , Fisher, C. D. , Ottinger, S. E. , Koenig, E. , and Kirby, P. J. (2017) Identification of microRNA biomarker candidates in urine and plasma from rats with kidney or liver damage. J. Appl. Toxicol., 37: 278–286. doi: 10.1002/jat.3358.
References
- Bhatt K, Zhou L, Mi QS, Huang S, She JX, Dong Z. 2010. MicroRNA‐34a is induced via p53 during cisplatin nephrotoxicity and contributes to cell survival. Mol. Med. 16: 409–416. [DOI] [PMC free article] [PubMed] [Google Scholar]
- Blondal T, Jensby Nielsen S, Baker A, Andreasen D, Mouritzen P, Wrang Teilum M, Dahlsveen IK. 2013. Assessing sample and miRNA profile quality in serum and plasma or other biofluids. Methods 59: S1–S6. [DOI] [PubMed] [Google Scholar]
- Church RJ, Otieno M, McDuffie JE, Singh B, Sonee M, Hall L, Watkins PB, Ellinger‐Ziegelbauer H, Harrill AH. 2016. Beyond miR‐122: Identification of microRNA alterations in blood during a time course of hepatobiliary injury and biliary hyperplasia in rats. Toxicol. Sci. 150: 3–14. [DOI] [PMC free article] [PubMed] [Google Scholar]
- Etheridge A, Lee I, Hood L, Galas D, Wang K. 2011. Extracellular microRNA: a new source of biomarkers. Mutat. Res. 717: 85–90. [DOI] [PMC free article] [PubMed] [Google Scholar]
- Frazier KS, Seely JC, Hard GC, Betton G, Burnett R, Nakatsuji S, Nishikawa A, Durchfeld‐Meyer B, Bube A. 2012. Proliferative and nonproliferative lesions of the rat and mouse urinary system. Toxicol. Pathol. 40: 14S–86S. [DOI] [PubMed] [Google Scholar]
- Ge S, Wang X, Xie J, Yi X, Liu F. 2014. Deep sequencing analysis of microRNA expression in porcine serum‐induced hepatic fibrosis rats. Ann. Hepatol. 13: 439–449. [PubMed] [Google Scholar]
- Git A, Dvinge H, Salmon‐Divon M, Osborne M, Kutter C, Hadfield J, Bertone P, Caldas C. 2010. Systematic comparison of microarray profiling, real‐time PCR, and next‐generation sequencing technologies for measuring differential microRNA expression. RNA 16: 991–1006. [DOI] [PMC free article] [PubMed] [Google Scholar]
- Haider BA, Baras AS, McCall MN, Hertel JA, Cornish TC, Halushka MK. 2014. A critical evaluation of microRNA biomarkers in non‐neoplastic disease. PLoS One 9 .e89565 [DOI] [PMC free article] [PubMed] [Google Scholar]
- Han WK, Bailly V, Abichandani R, Thadhani R, Bonventre JV. 2002. Kidney Injury Molecule‐1 (KIM‐1): a novel biomarker for human renal proximal tubule injury. Kidney Int. 62: 237–244. [DOI] [PubMed] [Google Scholar]
- Harrill AH, Eaddy JS, Rose K, Cullen JM, Ramanathan L, Wanaski S, Collins S, Ho Y, Watkins PB, Lecluyse EL. 2014. Liver biomarker and in vitro assessment confirm the hepatic origin of aminotransferase elevations lacking histopathological correlate in beagle dogs treated with GABAA receptor antagonist NP260. Toxicol. Appl. Pharmacol. 277: 131–137. [DOI] [PubMed] [Google Scholar]
- Hauser S, Wulfken LM, Holdenrieder S, Moritz R, Ohlmann CH, Jung V, Becker F, Herrmann E, Walgenbach‐Brunagel G, von Ruecker A, Muller SC, Ellinger J. 2012. Analysis of serum microRNAs (miR‐26a‐2*, miR‐191, miR‐337‐3p and miR‐378) as potential biomarkers in renal cell carcinoma. Cancer Epidemiol. 36: 391–394. [DOI] [PubMed] [Google Scholar]
- He L, Hannon GJ. 2004. MicroRNAs: small RNAs with a big role in gene regulation. Nat. Rev. Genet. 5: 522–531. [DOI] [PubMed] [Google Scholar]
- Hurd PJ, Nelson CJ. 2009. Advantages of next‐generation sequencing versus the microarray in epigenetic research. Brief. Funct. Genomic. Proteomic. 8: 174–183. [DOI] [PubMed] [Google Scholar]
- Ichii O, Otsuka S, Ohta H, Yabuki A, Horino T, Kon Y. 2014. MicroRNA expression profiling of cat and dog kidneys. Res. Vet. Sci. 96: 299–303. [DOI] [PubMed] [Google Scholar]
- Kanki M, Moriguchi A, Sasaki D, Mitori H, Yamada A, Unami A, Miyamae Y. 2014. Identification of urinary miRNA biomarkers for detecting cisplatin‐induced proximal tubular injury in rats. Toxicology 324: 158–168. [DOI] [PubMed] [Google Scholar]
- Kelly AD, Hill KE, Correll M, Hu L, Wang YE, Rubio R, Duan S, Quackenbush J, Spentzos D. 2013. Next‐generation sequencing and microarray‐based interrogation of microRNAs from formalin‐fixed, paraffin‐embedded tissue: preliminary assessment of cross‐platform concordance. Genomics 102: 8–14. [DOI] [PMC free article] [PubMed] [Google Scholar]
- Koenig EM, Fisher CD, Bernard H, Wolenski FS, Gerrein J, Carsillo ME, Gallacher MJ, Tse A, Peters RA, Smith A, Meehan A, Tirrell S, Kirby PJ. 2016. The beagle dog microRNA tissue atlas: identifying translatable biomarkers of organ toxicity. BMC Genomics (In Press). [DOI] [PMC free article] [PubMed] [Google Scholar]
- Konta T, Ichikawa K, Suzuki K, Kudo K, Satoh H, Kamei K, Nishidate E, Kubota I. 2014. A microarray analysis of urinary microRNAs in renal diseases. Clin. Exp. Nephrol. 18: 711–717. [DOI] [PubMed] [Google Scholar]
- Kozomara A, Griffiths‐Jones S. 2014. miRBase: annotating high confidence microRNAs using deep sequencing data. Nucleic Acids Res. 42: D68–D73. [DOI] [PMC free article] [PubMed] [Google Scholar]
- Love MI, Huber W, Anders S. 2014. Moderated estimation of fold change and dispersion for RNA‐seq data with DESeq2. Genome Biol. 15: 550. [DOI] [PMC free article] [PubMed] [Google Scholar]
- Maluf DG, Dumur CI, Suh JL, Scian MJ, King AL, Cathro H, Lee JK, Gehrau RC, Brayman KL, Gallon L, Mas VR. 2014. The urine microRNA profile may help monitor post‐transplant renal graft function. Kidney Int. 85: 439–449. [DOI] [PMC free article] [PubMed] [Google Scholar]
- Minami K, Uehara T, Morikawa Y, Omura K, Kanki M, Horinouchi A, Ono A, Yamada H, Ohno Y, Urushidani T. 2014. miRNA expression atlas in male rat. Sci. Data 1: 140005. [DOI] [PMC free article] [PubMed] [Google Scholar]
- Misso G, Di Martino MT, De Rosa G, Farooqi AA, Lombardi A, Campani V, Zarone MR, Gulla A, Tagliaferri P, Tassone P, Caraglia M. 2014. Mir‐34: a new weapon against cancer? Mol. Ther. Nucleic Acids 3 .e194 [DOI] [PMC free article] [PubMed] [Google Scholar]
- Mladinov D, Liu Y, Mattson DL, Liang M. 2013. MicroRNAs contribute to the maintenance of cell‐type‐specific physiological characteristics: miR‐192 targets Na+/K+‐ATPase β1. Nucleic Acids Res. 41: 1273–1283. [DOI] [PMC free article] [PubMed] [Google Scholar]
- Nassirpour R, Mathur S, Gosink MM, Li Y, Shoieb AM, Wood J, O'Neil SP, Homer BL, Whiteley LO. 2014. Identification of tubular injury microRNA biomarkers in urine: comparison of next‐generation sequencing and qPCR‐based profiling platforms. BMC Genomics 15: 485. [DOI] [PMC free article] [PubMed] [Google Scholar]
- Nassirpour R, Homer BL, Mathur S, Li Y, Li Z, Brown T, Carraher D, Warneke J, Bailey S, Percival K, O'Neil SP, Whiteley LO. 2015. Identification of promising urinary microRNA biomarkers in two rat models of glomerular injury. Toxicol. Sci. 148: 35–47. [DOI] [PubMed] [Google Scholar]
- Ozer J, Ratner M, Shaw M, Bailey W, Schomaker S. 2008. The current state of serum biomarkers of hepatotoxicity. Toxicology 245: 194–205. [DOI] [PubMed] [Google Scholar]
- Pavkovic M, Riefke B, Ellinger‐Ziegelbauer H. 2014. Urinary microRNA profiling for identification of biomarkers after cisplatin‐induced kidney injury. Toxicology 324: 147–157. [DOI] [PubMed] [Google Scholar]
- Redova M, Poprach A, Nekvindova J, Iliev R, Radova L, Lakomy R, Svoboda M, Vyzula R, Slaby O. 2012. Circulating miR‐378 and miR‐451 in serum are potential biomarkers for renal cell carcinoma. J. Transl. Med. 10: 55. [DOI] [PMC free article] [PubMed] [Google Scholar]
- Smith A, Calley J, Mathur S, Qian H, Wu H, Farmen M, Caiment F, Bushe P, Li J, Fisher CD, Kirby PJ, Koenig E, Hall DG, Watson DE. 2016. The Rat microRNA body atlas; Evaluation of the microRNA content of rat organs through deep sequencing and characterization of pancreas enriched miRNAs as biomarkers of pancreatic toxicity in the rat and dog. BMC Genomics (In Press). [DOI] [PMC free article] [PubMed] [Google Scholar]
- Starkey Lewis PJ, Dear J, Platt V, Simpson KJ, Craig DG, Antoine DJ, French NS, Dhaun N, Webb DJ, Costello EM, Neoptolemos JP, Moggs J, Goldring CE, Park BK. 2011. Circulating microRNAs as potential markers of human drug‐induced liver injury. Hepatology 54: 1767–1776. [DOI] [PubMed] [Google Scholar]
- Su YW, Chen X, Jiang ZZ, Wang T, Wang C, Zhang Y, Wen J, Xue M, Zhu D, Su YJ, Xing TY, Zhang CY, Zhang LY. 2012. A panel of serum microRNAs as specific biomarkers for diagnosis of compound‐ and herb‐induced liver injury in rats. PLoS One 7 .e37395 [DOI] [PMC free article] [PubMed] [Google Scholar]
- Thoolen B, Maronpot RR, Harada T, Nyska A, Rousseaux C, Nolte T, Malarkey DE, Kaufmann W, Kuttler K, Deschl U, Nakae D, Gregson R, Vinlove MP, Brix AE, Singh B, Belpoggi F, Ward JM. 2010. Proliferative and nonproliferative lesions of the rat and mouse hepatobiliary system. Toxicol. Pathol. 38: 5S–81S. [DOI] [PubMed] [Google Scholar]
- Vandesompele J, De Preter K, Pattyn F, Poppe B, Van Roy N, De Paepe A, Speleman F. 2002. Accurate normalization of real‐time quantitative RT‐PCR data by geometric averaging of multiple internal control genes. Genome Biol. 3 .RESEARCH0034 [DOI] [PMC free article] [PubMed] [Google Scholar]
- Wang C, Hu J, Lu M, Gu H, Zhou X, Chen X, Zen K, Zhang CY, Zhang T, Ge J, Wang J, Zhang C. 2015. A panel of five serum miRNAs as a potential diagnostic tool for early‐stage renal cell carcinoma. Sci. Rep. 5: 7610. [DOI] [PMC free article] [PubMed] [Google Scholar]
- Wang K, Zhang S, Marzolf B, Troisch P, Brightman A, Hu Z, Hood LE, Galas DJ. 2009. Circulating microRNAs, potential biomarkers for drug‐induced liver injury. Proc. Natl. Acad. Sci. U. S. A. 106: 4402–4407. [DOI] [PMC free article] [PubMed] [Google Scholar]
- Weber JA, Baxter DH, Zhang S, Huang DY, Huang KH, Lee MJ, Galas DJ, Wang K. 2010. The microRNA spectrum in 12 body fluids. Clin. Chem. 56: 1733–1741. [DOI] [PMC free article] [PubMed] [Google Scholar]
- Yamaura Y, Nakajima M, Takagi S, Fukami T, Tsuneyama K, Yokoi T. 2012. Plasma microRNA profiles in rat models of hepatocellular injury, cholestasis, and steatosis. PLoS One 7 .e30250 [DOI] [PMC free article] [PubMed] [Google Scholar]
- Yamaura Y, Nakajima M, Tatsumi N, Takagi S, Fukami T, Tsuneyama K, Yokoi T. 2014. Changes in the expression of miRNAs at the pericentral and periportal regions of the rat liver in response to hepatocellular injury: comparison with the changes in the expression of plasma miRNAs. Toxicology 322: 89–98. [DOI] [PubMed] [Google Scholar]
- Yang X, Greenhaw J, Shi Q, Su Z, Qian F, Davis K, Mendrick DL, Salminen WF. 2012. Identification of urinary microRNA profiles in rats that may diagnose hepatotoxicity. Toxicol. Sci. 125: 335–344. [DOI] [PubMed] [Google Scholar]
- Zhai PF, Wang F, Su R, Lin HS, Jiang CL, Yang GH, Yu J, Zhang JW. 2014. The regulatory roles of microRNA‐146b‐5p and its target platelet‐derived growth factor receptor alpha (PDGFRA) in erythropoiesis and megakaryocytopoiesis. J. Biol. Chem. 289: 22600–22613. [DOI] [PMC free article] [PubMed] [Google Scholar]
Associated Data
This section collects any data citations, data availability statements, or supplementary materials included in this article.
Supplementary Materials
Supporting info item
Supporting info item
Supporting info item
Supporting info item
Supporting info item
Supporting info item
Supporting info item
Supporting info item