Abstract
Stem cell-based therapies have become a major focus in regenerative medicine and to treat diseases. A straightforward approach combining three drugs, heparin (H), protamine (P) with ferumoxytol (F) in the form of nanocomplexes (NCs) effectively labeled stem cells for cellular MRI. We report on the physicochemical characteristics for optimizing the H, P, and F components in different ratios, and mixing sequences, producing NCs that varied in hydrodynamic size. NC size depended on the order in which drugs were mixed in media. Electron microscopy of HPF or FHP showed that F was located on the surface of spheroidal shaped HP complexes. Human stem cells incubated with FHP NCs resulted in a significantly greater iron concentration per cell compared to that found in HPF NCs with the same concentration of F. These results indicate that FHP could be useful for labeling stem cells in translational studies in the clinic.
Keywords: Ferumoxytol, heparin, protamine, cell labeling, stem cells
Graphic Abstract
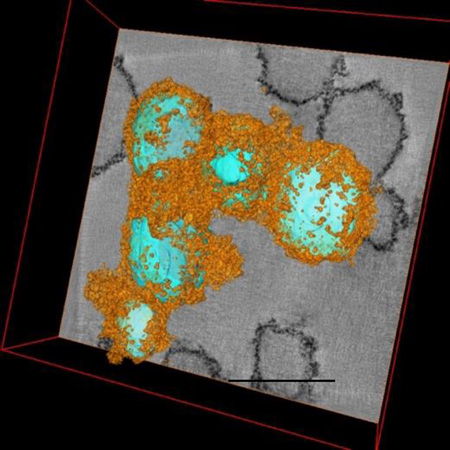
By combining heparin (H), protamine (P) and ferumoxytol (F) or FHP together in appropriate concentrations results in hard-soft nanocomplexes in which HP (cyan) are in the center and F (orange) coats the outside of the spheroid. 3D reconstructions obtained from transmission electron microscopy tomographic tilt series. Scale bar =250nm.
Introduction
Studies have shown that clinically approved superparamagnetic iron oxide nanoparticles (SPIONs) can be complexed to various types of transfection agents including protamine sulfate in order to facilitate the uptake of the complex by stem cells and immune cells for cellular MRI. Ferumoxytol, an ultra-small superparamagentic iron oxide (USPIO) nanoparticle with a polyglucose sorbitol carboxymethylether coating is a Food and Drug Administration (FDA) approved agent for intravenous use for the treatment of chronic anemia ensuing from chronic kidney disease[1–5]. Ferumoxytol is also being used as an alternative to gadolinium chelates for MRI, since it does not require determination of renal function prior to imaging and can be used in patients at risk of nephrogenic systemic fibrosis[3,6]. Ferumoxytol is taken up in human bone marrow following intravenous injection resulting in signal intensity changes detected in red marrow MRI on T2* weighted images[7]. Intravenous ferumoxytol has been used both in experimental and clinical studies to label macrophages in vivo [8] and as a blood pool agent with MRI angiography[3,9].
We previously reported that by combining H with P and F produced a nanocomplex that can be used to magnetically label stem cells and immune cells[10,11]. Heparin based nanocomplexes, that bind to polycations or metal nanoparticles have been used for drug delivery to improve chemotherapeutic uptake by cancer cells or for antibiotic treatment of infection, or for scaffolds in tissue engineering[12–16]. After mixing with protamine the anticoagulant heparin rapidly forms a NC[17], that effectively reduces the effect of heparin in the blood facilitating hepatic or renal clearance[18]. Heparin-protamine (HP) complexes have been reported to form in ratio of one mole of heparin to approximately two moles of protamine via electrostatic interactions through between guanidine groups on protamine and sulfate and carboxylic acid groups in heparin[19].
This study investigated the effect of combining the H and P with varying concentrations of F, and changing the order in which these drugs were added, on the formation of NCs for the purpose of optimizing labeling of human mesenchymal stem cells (MSCs) and neural stem cells (NSCs). Transmission electron microscopy (TEM) and energy filtered transmission electron microscopy (EFTEM) revealed that HFP or FHP NCs were different in size and could be described as a hard-soft spheroid mainly containing H and P surrounded by F. Using EFTEM to map nitrogen and sulfur provided distribution of P and H within the nanoparticles. Stem cells labeled with FHP NCs resulted in greater iron uptake compared to HPF NCs.
Methods
HPF and FHP Nanocomplex Preparation
Heparin (1,000 International units(IU)/mL) was obtained from Hospira, Inc. (Lake Forest, IL). For this study all heparin doses are expressed in IU because heparin dosage is usually expressed as potency for this biological product (i.e.,1IU/ml is approximately equal to 10µg/ml heparin). Protamine (10mg/mL) was obtained from APP Pharmaceuticals, Inc. (Lake Zurich, IL). Ferumoxytol (30mg/mL iron) was obtained from Amag Pharmaceuticals, Inc. (Lexington, MA). HPF or FHP NCs were prepared in sterile RPMI 1640 (Gibco; Life Technologies, Inc.) at 37°C by mixing the components in the appropriate sequence, and with ratios of heparin (2IU/mL): protamine (60µg/ml): ferumoxytol (50–200µg/ml). Following each addition, the sample was vortexed to allow complete dissolution in media.
Physicochemical Characterization of HPF and FHP Nanocomplexes
To determine particle size and assess the kinetic behavior of HPF and FHP NCs serial dynamic light scattering (s-DLS) was preformed at 37°C using a Zetasizer (Nano ZS, Malvern, U.K.). Intensity correlation functions were measured at a scattering angle of θ = 173° using a wavelength of 633nm. Measurements at each time point were repeated ten times and calculations were performed on the averaged correlation function.
Energy Filtered Transmission Electron Microscopy
To investigate the distribution of sulfur (S), nitrogen (N) and iron (Fe) within the HPF NCs at 2IU/ml:60µg/ml:200µg/ml and FHP at 200µg/ml:2IU/ml:60µg/ml nanoparticles, EFTEM and electron energy loss spectroscopy (EELS) were performed[20]. These techniques allowed for the quantitative determination of the atomic ratios of elements within the nanoparticles. Specimens for electron microscopy were concentrated and embedded in plastic. HPF (2IU/ml:60µg/ml:50µg/ml) or FHP (50µg/ml:2IU/ml:60µg/ml) NC were prepared in sterile RPMI 1640 (Gibco; Life Technologies, Inc.) and centrifuged at 14,000rpm for 10min (Beckman Coulter). The supernatant was gently aspirated and the pellet was embedded in 2% agarose. The pellet underwent successive ethanol gradients (30–100%) for dehydration followed by propylene oxide infiltration at room temperature. The pellet was embedded in epon and allowed to harden overnight at 60°C. The blocks were microtomed to provide sections 50–120nm in thickness, which were deposited onto copper EM grids.
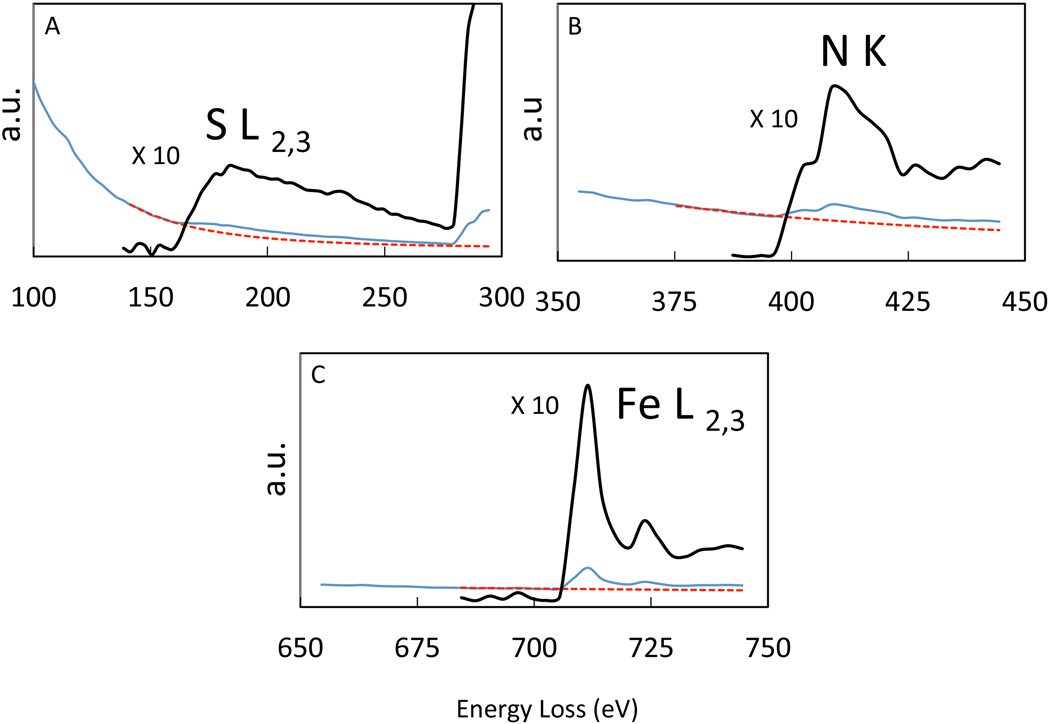
EFTEM images as well as EELS data were recorded by means of a Tecnai TF30 electron microscope (FEI, Hillsboro, OR) equipped with a Tridiem Imaging Filter (Gatan Inc., Pleasanton, CA), operating at an accelerating voltage of 300kV. To map S, N and Fe, EFTEM spectrum imaging was performed. The data were acquired in three separate regions of the electron energy loss spectrum. To map S, images were acquired with integration times of 2sec with a slit width of 5eV and energy-loss increment of 3eV ranging from 80eV to 300eV, which included energy losses below and above the S L2,3 core edge situated at 165eV. To map N, images were acquired with integration times of 5 sec with a slit width of 5eV and energy-loss increment of 3eV ranging from 350eV to 450eV around the N K edge situated at 401eV. To map Fe, images were acquired with integration times of 5sec with a slit width of 5eV and energy-loss increment of 3eV ranging from 650eV to 750eV around the Fe L2,3 edge situated at 710eV. To obtain elemental maps of the HPF or FHP NCs, EFTEM images were binned to 512×512 pixels or 256×256 pixels and the slit width was set to 10eV and with an integration time of 6 sec, respectively. The spectral background was subtracted by fitting an inverse power law under core edge, and each elemental signal was summed over a 30eV spectral window using the Digital Micrograph software (Gatan Inc., Pleasanton, CA). The atomic ratio of sulfur to nitrogen was determined from EFTEM spectrum images[21] using a reference EELS from cystine (SCH2CH(NH2)COOH)2, that contains 2S and 2N atoms:
| (eq 2) |
Here nS and nN are the number of S and N atoms, respectively, in the region of the specimen that is analyzed; IS(β, Δ) and IN(β, Δ) are the corresponding integrated counts under the sulfur L2,3 edge and nitrogen K edge, respectively, in the region of the specimen that is analyzed; and are the integrated counts for sulfur and nitrogen in the EELS from cystine; and β is the collection semi-angle defined by the spectrometer entrance aperture (20mrad), and Δ is the integration energy window (30eV).
Cell Labeling and Biological Analysis
Human MSCs were obtained from normal volunteers enrolled in an IRB approved clinical protocol in the NIH Bone Marrow Stromal Cell Transplantation Center at our institution and expanded in culture. HB1.F3.CD NSCs were provided as Material Transfer Agreement by Dr. Karen Aboody at the City of Hope Medical Center, Duarte CA. Culture conditions for both cells and labeling have been previously described[11]. For cell labeling, HPF or FHP NC in basal medium was added to cells for 2–4hrs in a incubator. After the incubation period, FBS was added to the labeling medium to the normal culture level, and then NC uptake was continued overnight. On the following day, cells were washed 3 times with heparinized HBSS (10U/mL) prior to trypsinization to eliminate NC binding on the cell surfaces.
MTS Cell Proliferation Assay
HPF or FHP-labeled or unlabeled control cells were assessed for viability and proliferation by MTS assay using CellTiter 96® AQueous One Solution Cell Proliferation Assay (MTS) (Promega, Madison, WI) kit according to the manufacturer’s direction. HPF or FHP-labeled cells were trypsinized and seeded in 96-well-plates (104 MSCs and 2×10⁴ HB1.F3.CD NSCs per well in 100µl). Twenty microliters of MTS reagent was added to each well followed by incubation at 37 °C for 2hr. Two-hours of incubation with 10mM H2O2 was used as a positive control for cytotoxicity. The MTS absorbance was measured at 490nm using a multi-well plate reader (PerkinElmer Lambda 25). Each group had n=6 per condition tested.
Prussian Blue (PB) Staining
Labeled cells were fixed and 105 cells were prepared on a cytospin slide. The slide was PB stained with 10% potassium ferric-ferrocyanide (Sigma, St. Louis, MO) in 3.7% hydrochloric acid and counterstained with Nuclear Fast Red (Sigma) and scanned using Aperio Scanscope CS (Leica Biosystems). Human MSC and NSC incubated with various combinations of HPF or FHP and stained with PB alone or with 3,3'-diaminobenzidine enhancement revealed approximately 100% of cells were labeled.
Hemostasis
Hemostasis was determined using Pacific Hemostasis APTT-XL (Thermo Scientific). Human blood was obtained from NIH Blood Bank, then centrifuged at 1500×G for 15min to separate RBC from plasma. Plasma (100µl) was incubated with 105 labeled cells in 10µl PBS and 100µl of APTT-XL at 37 °C for 5min. CaCl2 (100µl) solution was added to each sample and then clotting time was recorded at the first appearance of cloudiness.
Intracellular ROS Production Measurement
The intracellular ROS production after labeling with FHP and HPF was measured using CM-H2DCFDA (Invitrogen). FHP or HPF-labeled or unlabeled cells were loaded with CM-H2DCFDA dye at the final concentration of 5µM for 30min at 37 °C. Incubation with 10mM H2O2 was used as a positive control to mimic oxidative stress. Cells were washed and resuspended in complete medium and plated at 4–8×10⁴ per well. The fluorescence intensity was measured using a multiwell plate reader (PerkinElmer Lambda 25) with an excitation wavelength of 488nm and an emission wavelength of 520nm. Each group had n=6 per condition tested.
Cell Surface Marker Analysis by Flow Cytometry
Characterization of cell surface markers was performed on MSC and NSC labeled with and without HPF or FHP. Cells were harvested after labeling, fixed with 2% paraformaldehyde and immuno-stained for the following known MSC surface markers: CD90, CD44, CD73, CD105 (Human MSC Analysis Kit, BD Biosciences, Franklin Lakes, NJ), and an NSC Marker, Nestin (PE conjugated, BD Biosciences). 5×10⁵ cells from each treatment condition were stained with each antibody and analyzed by flow cytometry, with a minimum of 104 events collected per sample.
Intracellular Iron Content Determination
Intracellular iron content was obtained by a rapid spectroscopic technique that following digestion of 106/ml labeled or control cells with sodium dodecyl sulfate (SDS 10% Manufacturer) for 5min and the difference in light absorbed at 370 and 750nm using UV/Vis spectrometer (PerkinElmer Lambda 25, Shelton, CT, USA) are compared to standard curve to determine iron content as previously described[22]. Iron contents were performed in triplicate and expressed as mean and standard deviation.
In Vitro and In Vivo MRI Evaluation
HPF or FHP labeled MSC and NSC were fixed with 2% paraformaldehyde in PBS and 106 cells were mixed in with 100µl of 1% low-melting temperature agarose gel at 42 °C, and transferred to ice in 1.5ml microfuge tubes. In vivo imaging studies were performed as part of an approved by the animal care and use committee at our institution. Female Sprague Dawley® rats(n=3) (Charles River Laboratory, Wilmington, MA) were anesthetized for surgery and imaging with isofluorane (1–3.5%) for all experiments. Rats underwent stereotactic guided intracranial injections of HPF and FHP labeled and unlabeled MSC and NSC at 5×10³ cells/site in 2µl sterile PBS at six sites in each brain. For both in vitro and in vivo studies, MRI was performed on a clinical 3T unit (Achieva, Philips Medical System, Andover, MA) using a 7cm solenoid coil using multislice multiecho Fast Field Echo (FFE) sequence with echo times (TE) ranging from 4.4–7ms – 34.4–63ms with a Delta 6–7ms, repetition time (TR)= 250ms, Flip Angle 30°. All images were collected with a slice thickness =0.5mm. MR images were processed to calculate T2* maps of the labeled cells.
Image and Statistical Analysis
Image analysis was performed with using MEDx image analysis software (Medical Numerics, Bethesda, MD, USA), to calculate quantitative T2* maps from FFE images. The signal intensity (S) from each voxel from the gradient-echo images were fitted to a monoexponential decay as a function of TE:
| (eq 3) |
Regions of interest were drawn to extract voxels from the T2*maps by an experienced technologist (BKL) in order to determine T2* values.
Statistical analysis was performed using Prism version 6.0d for Macintosh (GraphPad Software, San Diego, California, USA, www.graphpad.com), with descriptive statistics and 2-way ANOVA with Tukey’s multiple comparison tests with p value of <0.05 considered significant. Data is expressed as mean and standard deviation.
Results
Physicochemical Characterization of HPF and FHP
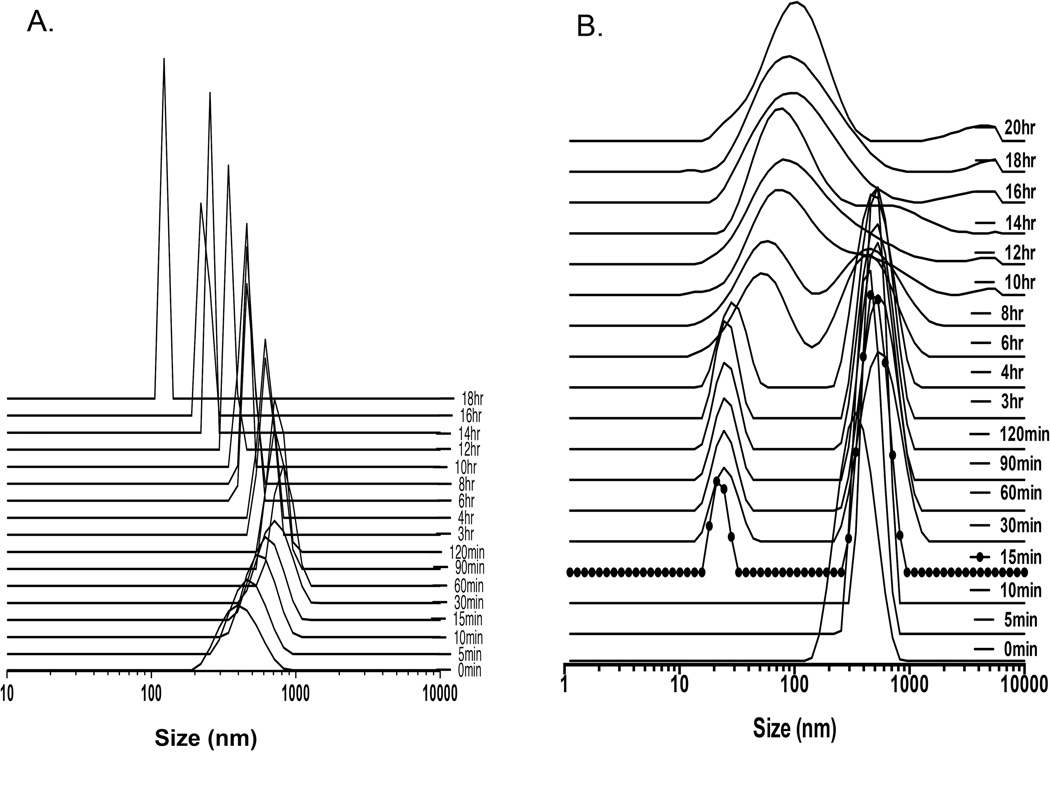
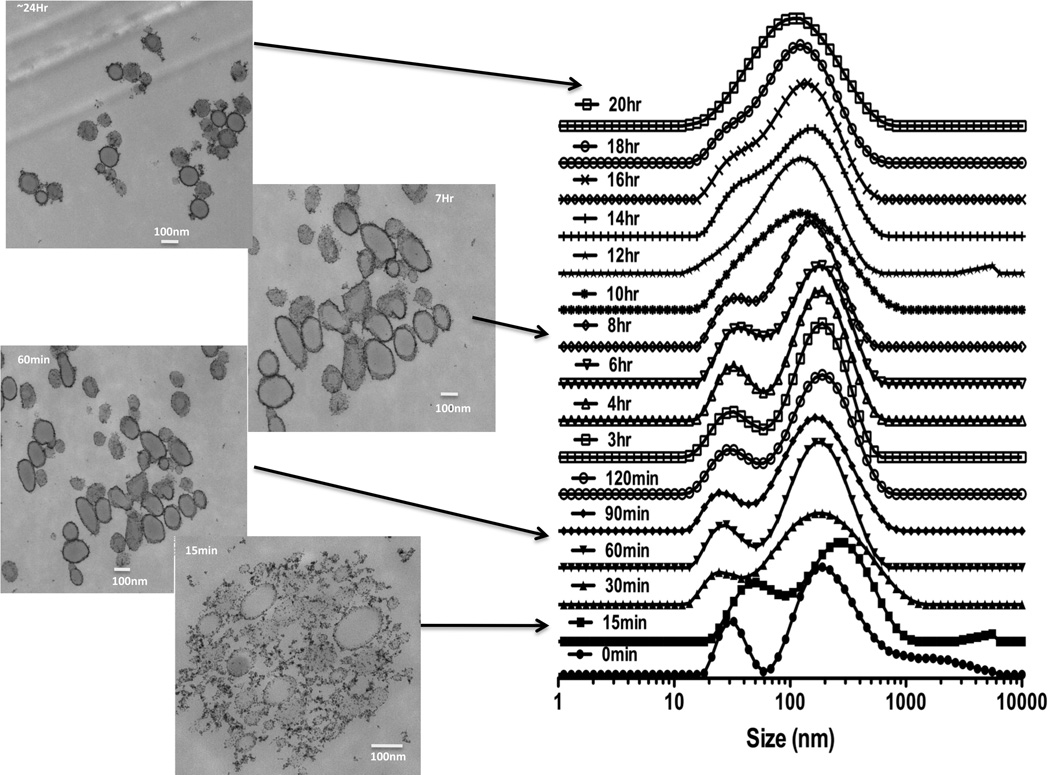
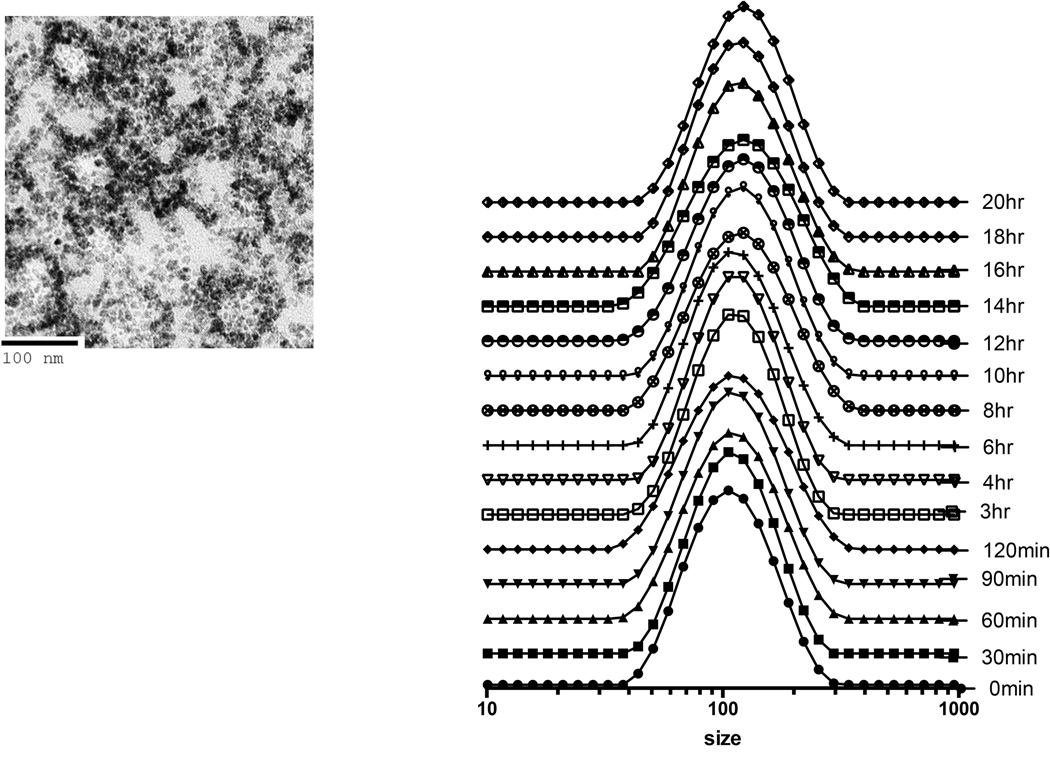
Mixing sequentially HPF or FHP at various ratios of each drug into serum free culture media resulted in the formation of nanocomplexes of various sizes. In water ferumoxytol, heparin and protamine have zeta potentials of −24.4±9.32, −31.6±0.0 and 13.3±6.7 mV, respectively while HP nanocomplexes having a positive (31.8±3.2mV) zeta potential. The approximate size of F= 29.68nm, H=9Kd and P=4.6Kd at 37°C in distilled water[11]. DLS was performed following mixing of H and P in ratio 1.5IU/ml:30µg/ml in RPMI demonstrates that changes in size with peak starting at ~396nm to a maximum median peak of ~825nm at 60min followed by decrease in NC size to ~100nm (Figure 1a). We observed that large HP NC (i.e.,700nm) would precipitate out of solution resulting in detected smaller sized NC at 18 hrs consistent with a previous report[17]. When ferumoxytol (60µg/ml) was added at 15min following the initial formation of the HP (1.5IU/ml:30µg/ml) NC in RPMI, a second peak at about 25nm was observed consistent with ferumoxytol. Approximately 6hrs after combining of F to the HP a single size particle with peak at ~140nm was observed by DLS (Figure 1b). Serial DLS spectra and EM images of HPF at ratio of (2IU/ml:40µg/ml:100µg/ml) were obtained at various time points over 24hrs (Figure 2). A stock solution of HPF was kept at 37°C from which material for DLS and EM were obtained. Initially two peaks on the DLS were detected coinciding with the size of F and HP. Spheroidal HPF NCs of various shapes and sizes were observed, which ultimately became less heterogeneous in size on EM and DLS. By changing the order of mixing the three drugs, serial DLS of FHP revealed little shift in the peak location of ~ 83nm (200µg/ml:2IU/ml:60µg/ml) with no second peak (~25nm) observed (Figure 3). DLS spectra obtained at 24hrs when H(2IU/ml) or P(60µg/ml) was mixed before or after the addition of F at 50–200µg/ml showed greater stability of the FHP compared to HPF NCs (Supplemental Figure 1).
Figure 1.
DLS spectra of NCs (vertical axis in arbitrary units). DLS of HP at ratio of 1.5IU/ml:30µg/ml in distilled water (A) demonstrating an instantaneous formation of large nanocomplexes that decrease in size over time due in part due to large HP NC precipitating out of solution. HP at ratio of 1.5IU/ml:30µg/ml (B) is added to media and 15min (dots) ferumoxytol is added at 60µg/ml and a second peak at ~30nm is detected at DLS. Over time the two nanoparticles come together to form HPF NC with a diameter approximately 140nm.
Figure 2.
DLS spectra and EM of HPF 2IU:40µg/ml:100µg/ml in media at 37° C over time. EMs were obtained at 15min, 60min, 7 and 24hrs after initial mixing of HPF and from same solution used for DLS spectra. DLS and EM revealed different sizes and shaped HPF NC over time with stabilization at 20hrs, consistent with F surrounding the outside of HP center (i.e., hybrid hard-soft nanocomplex).
Figure 3.
DLS spectra and EM of FHP 200µg/ml:2IU:60µg/ml in media at 37°C over time. DLS shows primarily a stable single peak over 20hrs in comparison to two peaks observed with HPF (Figure 2). EM obtained at 20hrs revealed spheroid shaped FHP NCs consistent with iron shell around an HP center.
Electron Microscopy of the Nanoparticles
EFTEM maps of heparin (2IU/ml), protamine (60µg/ml) and ferumoxytol (200µg/ml) mixed either as HPF or FHP in RPMI at 24hrs are presented in Figure 4. EFTEM spectrum imaging analysis revealed that sulfur (H), and nitrogen (P) was co-localized in the interior of both types of nanoparticles, whereas iron (Fe) was localized on the surface of the nanoparticles (Figures 2,3 and 4). An example of EELS from an HPF NC is shown in Figure 5. Protamine contains 24 positively charged arginine residues and a total of 128 nitrogen atoms as well as 7 sulfur atoms originating from cysteine and methionine residues. We expect the positive charges from the arginine residues to be balanced by negative charges on the sulfate groups of heparin. Heparin typically contains about 8 nitrogen atoms for 24 negatively charged sulfates. Considering the charge balance of protamine and heparin mixture, the ratio of sulfur to nitrogen was therefore expected to be (24+7)/(128+8) = 0.23. This compares with the EELS analysis that gave a sulfur-to-nitrogen ratio of 0.23±0.02 for HPF nanoparticles and 0.31±0.03 for FHP nanoparticles. These results support the findings of ionic attraction of HP for each other was altered and stabilized when F was already present in the media resulting in a smaller spheroid as compared to when ferumoxytol was added to the mixture after the initial and rapid formation of the HP nanoparticles.
Figure 4.
EFTEM elemental maps of HPF and FHP NCs with S (blue), N (green), and Fe (red) in HPF (A) and FHP (B) NC. Bright-field TEM image and overlay images of the same cluster of HPF (A) and FHP (B) NC with their respective scale markers. Sulfur (from heparin) and nitrogen (from protamine) are co-localized in the interior of both particles and Fe (from ferumoxytol) on the surface of both types of NCs.
Figure 5.
Typical EELS extracted from EFTEM spectrum images from the composite nanoparticles in Figure 4 identifying the presence of S (A), N (B), and Fe (C) (blue line). The background extrapolation is indicated as red dotted line and extracted S, N and Fe edges are shown above (black) with an expansion of vertical intensities ×10. a.u.= arbitrary units
Cell Labeling
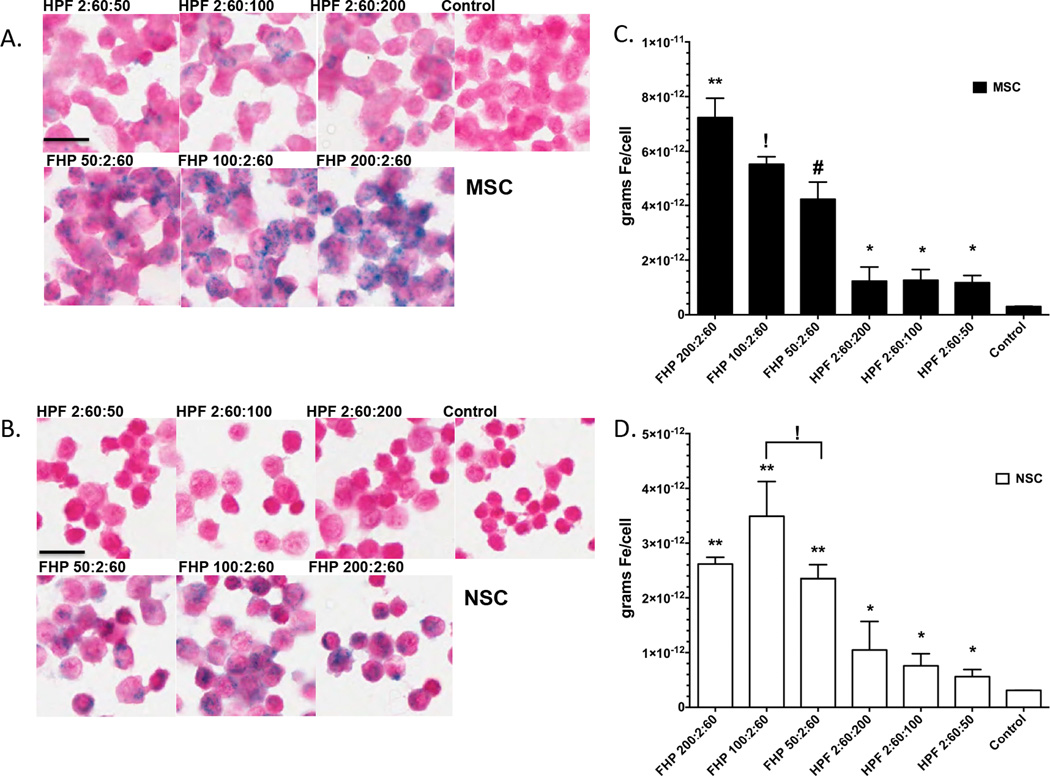
For both NSCs and MSCs, there were increased PB staining for FHP labeled cells compared to HPF with similar amounts of F added to the mixture (Figure 6). Qualitatively, there is clearly an increase amount of PB staining at all FHP ratios compared to HPF or unlabeled cells. Figure 6c and 6d contains a graph for each ratio and cell type clearly showing for all ratios MSC or NSC labeled with FHP NC had significantly greater iron content (ANOVA p<0.05) compared to cells labeled with HPF or unlabeled controls. Table 1 summarizes the mean iron content per cell for ratios of HPF or FHP labeled MSC or NSC compared to unlabeled cells. Overall, labeling these two stem cells with FHP resulted in significantly greater amounts of intracellular iron as compared to the HPF at same concentration ratios or unlabeled controls.
Figure 6.
Cytospins of Prussian Blue stained MSC (A) and NSC (B) at different ratios of HPF or FHP and unlabeled control cells. For simplicity, all ratios of HPF or FHP are expressed without units (i.e., IU/ml or µg/ml). Iron content in cells increases with increasing concentration of Ferumoxytol in the NC. (C and D) Bar graph (mean and standard deviation) of labeled MSC (solid black bars) or NSC (white bars). Nanocomplex ratios with like symbols are statistically similar to each other and statistically different from ratios with different symbols based on ANOVA with multiple comparisons (p<0.05). Scale bar=50µm
Table 1.
Mean Iron content per cell (pg) (± standard deviation) for MSC and NSC labeled either with FHP or HPF at different concentrations of each drug.
| F(µg/ml):H(IU/ml):P(µg/ml) | H(IU/ml):P(µg/ml):F(µg/ml) | ||||||
|---|---|---|---|---|---|---|---|
| Ratios | Control | 200:2:60 | 100:2:60 | 50:2:60 | 2:60:200 | 2:60:100 | 2:60:50 |
| MSC (pg/cell) |
0.3±0.01# | 7.23±0.7* | 5.52±0.63$ | 4.2±0.65% | 1.23±0.52# | 1.27±0.4# | 1.2±0.26# |
| NSC (pg/cell) |
0.3±0.003# | 2.62±0.12* | 3.49±0.63* | 2.34±0.26* | 1.04±0.52# | 0.75±0.3# | 0.56±0.13# |
Iron Contents with ratios with like symbols are statistically similar to each other and statistically different from ratios with different symbols based on ANOVA with multiple comparisons (p<0.05).
Biological Effects of Labeling Cells with HPF or FHP Nanocomplexes in Cells
The order of adding into media for labeling cells had no effect of NSC or MSC viability or MTS proliferation compared to unlabeled cells (Supplemental figure 2). In order to demonstrate that cells labeled with either HPF or FHP did not have an effect on hemostasis, fresh and lysed labeled MSC were incubated in human plasma and an APPT-XL test was performed (Supplemental Figure 3). There was also no effect of labeling MSC or NSC with HPF or FHP NCs on reactive oxygen species or cell surface markers compared to unlabeled control cells (Supplemental Figure 4 and 5).
Imaging Studies
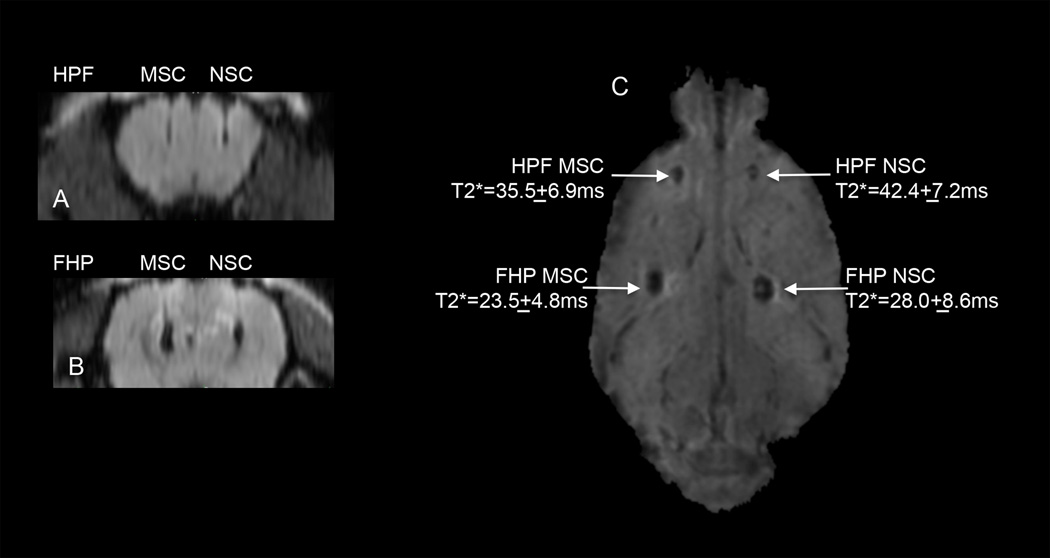
MRI at 3T was performed on HPF and FHP labeled 106 MSC or 106 NSC in which various concentrations of F (i.e., 50µg/ml, 100µg/ml and 200µg/ml) with H (2IU/ml) and P (60µg/ml) held constant were used. Region of interest measurements from the T2*maps demonstrate that MSC labeled with FHP had the shortest T2* values compared to HPF labeled cells or NSC (Supplemental Figure 6). T2* MRI at 3T performed one day following implantation of 5×10³ HPF or FHP labeled NSC or MSC in the rat cortex revealed hypointense voxels at the injection sites for labeled cells consistent with T2 and T2* shortening (Figure 7). For this in vivo imaging study, NSC were labeled with HPF (2IU/ml:60µg/ml:100µg/ml) or FHP (100µg/ml:2IU/ml:60µg/ml) and MSC were labeled with HPF (2IU/ml:60µg/ml:200µg/ml) and FHP (200µg/ml:2IU/ml:60µg/ml) because these ratios were shown to result in greatest intracellular iron content. Coronal T2*w images of locations for HPF (Figure 7A) and FHP (Figure 7B) labeled cells displays needle tracks originating from cortex and the hypointense voxels due to T2* shortening. Calculated T2* maps from FFE gradient echo images revealed that FHP labeled cells caused greater T2* shortening compared to the respective HPF labeled cells (Figure 7C). The injection site FHP labeled MSC had the shortest T2* value that would be consistent with increased iron content (see Table 1).
Figure 7.
In vivo magnetic resonance at 3T visualization of intra-parenchyma implanted HPF or FHP labeled MSC or NSC in rat brain. Coronal reformatted T2*weighted images (TE=28ms) from a representative rat that were implanted with 5×10³ HPF labeled or FHP labeled MSC (left) or NSC (right) in the rat cortex. NSCs were labeled with HPF (2IU/ml:60µg/ml:100µg/ml) or FHP (100µg/ml:2IU/ml:60µg/ml) and MSC were labeled with HPF (2IU/ml:60µg/ml:200µg/ml) and FHP (200µg/ml:2IU/ml:60µg/ml) using ratios that resulted in highest intracellular iron content (Table 1). Calculated T2* map with T2* values at each injection site that shows that FHP labeled cells had shorter T2* values compared to corresponding HPF labeled cells. Normal brain T2* values range from 50–60msec. scale bar=2mm
Discussion
In this study, we characterized the HPF and FHP NC formed when the drugs were combined in culture media resulting in varying sized hard-soft spheroid shaped NC characterized by DLS and TEM. FHP labeling of MSC and NSC resulted in significant amounts of intracellular iron per cell compared to labeling cells with HPF NC.
Nanoparticle aggregates form via electrostatic attraction between H and P[17,18,23] or between P and F[24,25] at physiological pH in solution. Secondary effects like hydrogen bonding and osmolality/ionic strength also comes into play when forming nanocomplexes at high concentrations. Protamine and heparin both can be viewed as flexible linear units and quickly aggregate with one another and other aggregates. H and P will aggregate to sizes greater than 700nm in diameter and will eventually precipitate out of solution[17] (Figure 1A). Based on DLS and EM studies, it appears that F stabilized the HP NC at F concentrations of >100µg/ml as compared to the HPF formulation in which the DLS peak size varied. F has a negative zeta potential primarily due to its carbohydrate coating surrounding the Fe core diameter of ~6nm[11,26]. Ferumoxytol electrostatically interacts with P and may sterically hinder accretion with H to form larger aggregate particles in solution. The interaction with HP NC happens almost immediately and the timing when F was added to media appears to affect the rate of HP NC growth and stability over time. When F was added at 15min after the formation of the HP NC (Figure 1B) two peaks were observed on DLS lasting about 4–6hr before slowly becoming a single peak at ~100nm. The addition of F stabilizes the rapidly growing HP NC ultimately forming HPF NCs (Figure 1). Based on TEM, the HP NC stabilization was probably due to F interaction with P forming the electron dense iron that surrounds the complexes as previously reported[18]. The EELS TEM analysis[21] shows that the sulfur from H and nitrogen from P were located primarily in the center of the spheroid with Fe surrounding the HPF and FHP NCs consistent with a hard shell and soft center. Based on DLS and EM, HPF forms metastable NCs varying in size and shape over 20hs following initial mixing. For FHP the hydrodynamic size did not appreciably vary over 24hrs. Further investigation will be needed to study the interactions between HP and F to understand the differences in electrostatic attraction over time when the agents were added together.
Various approaches[27–29] have been developed to magnetically label cells by combining SPION or USPIO drugs or nanoparticles with transfection agents[30,31], or mechanical techniques[32,33] or by modifying the surface chemistry with the addition of peptides[34]. Ferumoxytol alone does not routinely label stem cells ex vivo [11]. Moreover, when F and P were administered intravenously experimentally there was no evidence of uptake in circulating leukocytes[35]. Pancreatic islet cells could be labeled with high concentrations of F without toxicity with the islets after intraportal vein injection being detected in the mouse liver as hypointense regions for up to 2wks[36]. Rat bone marrow MSCs were reported to endocytose F in vivo and these cells could then be isolated and expanded ex vivo for subsequent implantation used to treat damaged cartilage[37]. However, F was modified by covalently attaching fluorescein isothicyanate (FITC) to facilitate fluorescent detection in the cells. This modification to ferumoxytol may have increased uptake into bone marrow mononuclear cells and this approach may not be readily translatable to clinical trials[37]. By covalently linking rhodamine (Rho)-P to F results in magnetofluorescent nanoparticle[24] that when incubated with mouse MSC resulted in a higher iron content (4.2pgFe/cell) compared to the originally described HPF nanocomplexes[11]. The linking of P to F would come under the classification of a new agent requiring extensive in vitro and preclinical testing along with an investigation of new drug application before P-F could be used in a clinical trial[38]. Combining P and F in solution prior to adding to media does result in low concentration (0.4pgFe /cell) of iron in adipose derived stem cells compared to reports using the HPF NC to label MSC (~2pgFe/cell)[11,39]. In addition, gamma delta T-cells were not effectively labeled with PF NC in combination with magnetofection[25].
It is clear that combining all three drugs (i.e., H, P and F) together in media ultimately results in a greater labeling efficiency when compared to the PF technique in which the drugs were not modified. It has been reported that FHP (i.e., 50µg/ml:2IU/ml:60µg/ml) effectively labeled cardiosphere-derived stem cells (CDC) and these cells were used to treat myocardial infarction in a rat model[40]. Extensive cytotoxicity studies revealed no difference between FHP labeled and control CDC in viability, rate of apoptosis, proliferation, migration reactive oxygen species production, or differentiation into cardiac or endothelial cells. FHP labeling of CDCs changed less than 0.13% of 27,382 genes analyzed by microarray analysis however labeling cells with a nonreactive nanoparticle (i.e., gold) was not performed to determine if the altered gene expression was due to phagocytosis. In another study, natural killer T-cells (NK) were labeled with H (2IU/ml) P (60µg/ml) and F (25, 50 and 100µg/ml) to determine labeling efficiency and toxicity assays along with in vivo cellular MRI studies to monitor migration to hepatic cellular carcinoma implanted into rat liver[41]. NK cells labeled with HPF NC exhibited greater percentages of apoptotic and necrotic cells (mean 8–12%) compared to controls (~4%). The percent loss of viable cells following labeling was within acceptable range if preformed in a current good manufacturing practice facility (cGMP). The NK cells were incubated with HPF for 4hrs, resulting in intracellular iron content ranging from 1.72±0.32 to 3.47±0.45pg/cell[41]. Intravenously administered HPF labeled NK cells homed to implanted liver tumors and could be detected by T2* weighted MRI and by histology. Overall, these studies demonstrate that F when combined with H and P in various ratios or order will efficiently label cells that could be used in for cellular MRI studies. Of note, in a phase I clinical trial (clinicaltrials.gov NCT02015819) for treating patients with recurrent glioblastoma, the investigational new drug application was amended to include HPF (2IU/ml:40µg/ml:100µg/ml) labeled NSC (i.e., HB1.F3-CD) based on pre-clinical data[10] in order to facilitate tracking of the genetically engineered cells to satellite metastases in the brain.
In the current study, incubating MSC or NSC with FHP NCs (200µg/ml:2IU/ml:60µg/ml) resulted in greater incorporation of Fe/cell and T2* shortening at 3T MRI compared to labeling cells with HPF NC. The increase in intracellular iron content following incubation with FHP was presumably a result of stability and size of the NC and had no significant effect on proliferation or viability. Previously, it has been suggested that HPF may have an effect on hemostasis due to the presence of heparin in the NC[39]. However, there was no prolongation in clotting times when live or dead/lysed HPF or FHP labeled MSC were incubated with plasma compared to control indicating that in vitro hemostasis was not altered. The anticoagulation effect of H was neutralized by the excess protamine (i.e., 60µg/ml) in the nanocomplexes (i.e., 20µg/ml P to complex with H at1IU/ml =10µg/ml)[19]. This study indicates that implanting FHP or HPF labeled cells would not alter local hemostasis within tissues and not increase the risk of bleeding into surrounding parenchyma.
The results of this study demonstrate that labeling stem cells with FHP (200µg/ml:2IU/ml:60µg/ml) was more effective and results in greater iron concentration and signal intensity changes on in vitro and in vivo T2* maps of implanted cells in the rat brain. The straightforward method of mixing three drugs together in an appropriate order and concentrations resulted in greater uptake of ferumoxytol into the cells. These results are comparable to what had been previously reported in the literature[11]. It should be feasible, pending approval from appropriate regulatory agencies, to incorporate into the standard operation procedures in the cGMP facility to FHP label stem cells for use as part of an approved ongoing clinic trial.
Supplementary Material
Acknowledgments
This work was supported by the Intramural Research Programs of the Clinical Center and of the National Institute of Biomedical Imaging and Bioengineering at the National Institutes of Health.
Abbreviations
- MRI
magnetic resonance imaging
- H
heparin
- P
protamine
- F
ferumoxytol
- NC
nanocomplex
- S
sulfur
- N
nitrogen
- Fe
iron
- SPION
superparamagnetic iron oxide nanoparticles
- USPIO
ultrasmall superparamagnetic iron oxide nanoparticles
- MSC
mesenchymal stem cell
- NSC
neural stem cell
- FDA
Food and Drug Administration
- cGMP
clinical good manufacturing practice
- TEM
Transmission electron microscopy
- EFTEM
energy filtered transmission electron microscopy
- EELS
electron energy loss spectroscopy
- IU
international units
- DLS
dynamic light scattering
References
- 1.Ferumoxytol (Feraheme) - a new parenteral iron formulation. Med Lett Drugs Ther. 2010;52(1334):23. [PubMed] [Google Scholar]
- 2.Auerbach M. Ferumoxytol as a new, safer, easier-to-administer intravenous iron: yes or no? Am J Kidney Dis. 2008;52(5):826–829. doi: 10.1053/j.ajkd.2008.09.006. [DOI] [PubMed] [Google Scholar]
- 3.Neuwelt EA, et al. Ultrasmall superparamagnetic iron oxides (USPIOs): a future alternative magnetic resonance (MR) contrast agent for patients at risk for nephrogenic systemic fibrosis (NSF)? Kidney Int. 2009;75(5):465–474. doi: 10.1038/ki.2008.496. [DOI] [PMC free article] [PubMed] [Google Scholar]
- 4.Provenzano R, et al. Ferumoxytol as an intravenous iron replacement therapy in hemodialysis patients. Clin J Am Soc Nephrol. 2009;4(2):386–393. doi: 10.2215/CJN.02840608. [DOI] [PMC free article] [PubMed] [Google Scholar]
- 5.Schwenk MH. Ferumoxytol: a new intravenous iron preparation for the treatment of iron deficiency anemia in patients with chronic kidney disease. Pharmacotherapy. 2010;30(1):70–79. doi: 10.1592/phco.30.1.70. [DOI] [PubMed] [Google Scholar]
- 6.Bashir MR, et al. Emerging applications for ferumoxytol as a contrast agent in MRI. J Magn Reson Imaging. 2015;41(4):884–898. doi: 10.1002/jmri.24691. [DOI] [PubMed] [Google Scholar]
- 7.Storey P, Arbini AA. Bone marrow uptake of ferumoxytol: a preliminary study in healthy human subjects. J Magn Reson Imaging. 2014;39(6):1401–1410. doi: 10.1002/jmri.24320. [DOI] [PMC free article] [PubMed] [Google Scholar]
- 8.Gaglia JL, et al. Noninvasive mapping of pancreatic inflammation in recent-onset type-1 diabetes patients. Proc Natl Acad Sci U S A. 2015;112(7):2139–2144. doi: 10.1073/pnas.1424993112. [DOI] [PMC free article] [PubMed] [Google Scholar]
- 9.Neuwelt EA, et al. The potential of ferumoxytol nanoparticle magnetic resonance imaging, perfusion, and angiography in central nervous system malignancy: a pilot study. Neurosurgery. 2007;60(4):601–611. doi: 10.1227/01.NEU.0000255350.71700.37. discussion 611–2. [DOI] [PubMed] [Google Scholar]
- 10.Gutova M, et al. Magnetic resonance imaging tracking of ferumoxytol-labeled human neural stem cells: studies leading to clinical use. Stem Cells Transl Med. 2013;2(10):766–775. doi: 10.5966/sctm.2013-0049. [DOI] [PMC free article] [PubMed] [Google Scholar]
- 11.Thu MS, et al. Self-assembling nanocomplexes by combining ferumoxytol, heparin and protamine for cell tracking by magnetic resonance imaging. Nat Med. 2012;18(3):463–467. doi: 10.1038/nm.2666. [DOI] [PMC free article] [PubMed] [Google Scholar]
- 12.Kemp MM, Linhardt RJ. Heparin-based nanoparticles. Wiley Interdiscip Rev Nanomed Nanobiotechnol. 2010;2(1):77–87. doi: 10.1002/wnan.68. [DOI] [PubMed] [Google Scholar]
- 13.Khurshid H, et al. Development of heparin-coated magnetic nanoparticles for targeted drug delivery applications. Journal of Applied Physics. 2009;105(7) [Google Scholar]
- 14.Liang JF, et al. A novel heparin/protamine-based pro-drug type delivery system for protease drugs. J Pharm Sci. 2000;89(5):664–673. doi: 10.1002/(SICI)1520-6017(200005)89:5<664::AID-JPS12>3.0.CO;2-9. [DOI] [PubMed] [Google Scholar]
- 15.Ryser HJP, Shen WC. Conjugation of Methotrexate to Poly(L-Lysine) Increases Drug Transport and Overcomes Drug-Resistance in Cultured-Cells. Proceedings of the National Academy of Sciences of the United States of America. 1978;75(8):3867–3870. doi: 10.1073/pnas.75.8.3867. [DOI] [PMC free article] [PubMed] [Google Scholar]
- 16.Shen WC, Ryser HJ. Poly(L-lysine) has different membrane transport and drug-carrier properties when complexed with heparin. Proc Natl Acad Sci U S A. 1981;78(12):7589–7593. doi: 10.1073/pnas.78.12.7589. [DOI] [PMC free article] [PubMed] [Google Scholar]
- 17.Maurer J, et al. Analysis of the complex formation of heparin with protamine by light scattering and analytical ultracentrifugation: implications for blood coagulation management. J Am Chem Soc. 2011;133(4):1134–1140. doi: 10.1021/ja109699s. [DOI] [PubMed] [Google Scholar]
- 18.Rossmann P, Matousovic K, Horacek V. Protamine-Heparin Aggregates - Their Fine-Structure, Histochemistry, and Renal Deposition. Virchows Archiv B-Cell Pathology Including Molecular Pathology. 1982;40(1):81–98. [PubMed] [Google Scholar]
- 19.Aborg CH, Uvnas B. Mode of binding of histamine and some other biogenic amines to a protamine-heparin complex in vitro. Acta Physiol Scand. 1968;74(4):552–567. doi: 10.1111/j.1748-1716.1968.tb04267.x. [DOI] [PubMed] [Google Scholar]
- 20.Aronova MA, Leapman RD. Development of electron energy-loss spectroscopy in the biological sciences. Mrs Bulletin. 2012;37(1):53–62. doi: 10.1557/mrs.2011.329. [DOI] [PMC free article] [PubMed] [Google Scholar]
- 21.Leapman R. Eels Quantitative-Analysis. Transmission Electron Energy Loss Spectrometry in Materials Science. 1992;2:47–83. [Google Scholar]
- 22.Dadashzadeh ER, et al. Rapid spectrophotometric technique for quantifying iron in cells labeled with superparamagnetic iron oxide nanoparticles: potential translation to the clinic. Contrast Media Mol Imaging. 2013;8(1):50–56. doi: 10.1002/cmmi.1493. [DOI] [PMC free article] [PubMed] [Google Scholar]
- 23.Bleiberg I, Fabian I, Aronson M. Mode of binding and internalization into mouse macrophages of heparin complexed with polycations. Biochim Biophys Acta. 1981;674(3):345–353. doi: 10.1016/0304-4165(81)90365-2. [DOI] [PubMed] [Google Scholar]
- 24.Chen S, Alcantara D, Josephson L. A magnetofluorescent nanoparticle for ex-vivo cell labeling by covalently linking the drugs protamine and Feraheme. J Nanosci Nanotechnol. 2011;11(4):3058–3064. doi: 10.1166/jnn.2011.4164. [DOI] [PubMed] [Google Scholar]
- 25.Siegers GM, et al. Extensive expansion of primary human gamma delta T cells generates cytotoxic effector memory cells that can be labeled with Feraheme for cellular MRI. Cancer Immunol Immunother. 2013;62(3):571–583. doi: 10.1007/s00262-012-1353-y. [DOI] [PMC free article] [PubMed] [Google Scholar]
- 26.Neiser S, et al. Physico-chemical properties of the new generation IV iron preparations ferumoxytol, iron isomaltoside 1000 and ferric carboxymaltose. Biometals. 2015;28(4):615–635. doi: 10.1007/s10534-015-9845-9. [DOI] [PubMed] [Google Scholar]
- 27.Arbab AS, et al. In Vivo Cellular Imaging for Translational Medical Research. Curr Med Imaging Rev. 2009;5(1):19–38. doi: 10.2174/157340509787354697. [DOI] [PMC free article] [PubMed] [Google Scholar]
- 28.Modo M. Noninvasive imaging of transplanted cells. Curr Opin Organ Transplant. 2008;13(6):654–658. doi: 10.1097/MOT.0b013e328317a43c. [DOI] [PubMed] [Google Scholar]
- 29.Boutry S, et al. Magnetic labeling of non-phagocytic adherent cells with iron oxide nanoparticles: a comprehensive study. Contrast Media Mol Imaging. 2008;3(6):223–232. doi: 10.1002/cmmi.256. [DOI] [PubMed] [Google Scholar]
- 30.Arbab AS, et al. Comparison of transfection agents in forming complexes with ferumoxides, cell labeling efficiency, and cellular viability. Mol Imaging. 2004;3(1):24–32. doi: 10.1162/15353500200403190. [DOI] [PubMed] [Google Scholar]
- 31.Montet-Abou K, et al. Transfection agent induced nanoparticle cell loading. Mol Imaging. 2005;4(3):165–171. doi: 10.1162/15353500200505100. [DOI] [PubMed] [Google Scholar]
- 32.Walczak P, et al. Instant MR labeling of stem cells using magnetoelectroporation. Magn Reson Med. 2005;54(4):769–774. doi: 10.1002/mrm.20701. [DOI] [PubMed] [Google Scholar]
- 33.Xie D, et al. Optimization of magnetosonoporation for stem cell labeling. NMR Biomed. 2010;23(5):480–484. doi: 10.1002/nbm.1485. [DOI] [PubMed] [Google Scholar]
- 34.Josephson L, et al. High-efficiency intracellular magnetic labeling with novel superparamagnetic-Tat peptide conjugates. Bioconjug Chem. 1999;10(2):186–191. doi: 10.1021/bc980125h. [DOI] [PubMed] [Google Scholar]
- 35.Wu YJ, et al. In vivo leukocyte labeling with intravenous ferumoxides/protamine sulfate complex and in vitro characterization for cellular magnetic resonance imaging. Am J Physiol Cell Physiol. 2007;293(5):C1698–C1708. doi: 10.1152/ajpcell.00215.2007. [DOI] [PubMed] [Google Scholar]
- 36.Jin SM, et al. Feasibility of islet magnetic resonance imaging using ferumoxytol in intraportal islet transplantation. Biomaterials. 2015;52:272–280. doi: 10.1016/j.biomaterials.2015.02.055. [DOI] [PubMed] [Google Scholar]
- 37.Khurana A, et al. Iron administration before stem cell harvest enables MR imaging tracking after transplantation. Radiology. 2013;269(1):186–197. doi: 10.1148/radiol.13130858. [DOI] [PMC free article] [PubMed] [Google Scholar]
- 38.Naumova AV, et al. Clinical imaging in regenerative medicine. Nat Biotechnol. 2014;32(8):804–818. doi: 10.1038/nbt.2993. [DOI] [PMC free article] [PubMed] [Google Scholar]
- 39.Khurana A, et al. Ferumoxytol: a new, clinically applicable label for stem-cell tracking in arthritic joints with MRI. Nanomedicine (Lond) 2013;8(12):1969–1983. doi: 10.2217/nnm.12.198. [DOI] [PMC free article] [PubMed] [Google Scholar]
- 40.Vandergriff AC, et al. Magnetic targeting of cardiosphere-derived stem cells with ferumoxytol nanoparticles for treating rats with myocardial infarction. Biomaterials. 2014;35(30):8528–8539. doi: 10.1016/j.biomaterials.2014.06.031. [DOI] [PubMed] [Google Scholar]
- 41.Li K, et al. Clinically applicable magnetic-labeling of natural killer cells for MRI of transcatheter delivery to liver tumors: preclinical validation for clinical translation. Nanomedicine (Lond) 2015;10(11):1761–1774. doi: 10.2217/nnm.15.24. [DOI] [PMC free article] [PubMed] [Google Scholar]
Associated Data
This section collects any data citations, data availability statements, or supplementary materials included in this article.


