Summary
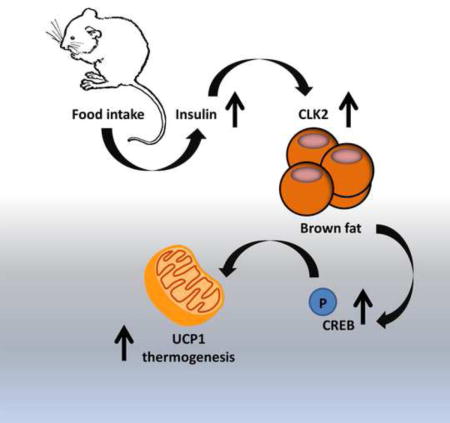
A promising approach to treating obesity is to increase diet-induced thermogenesis in brown adipose tissue (BAT), but the regulation of this process remains unclear. Here, we find that CDC-like kinase 2 (CLK2) is expressed in BAT and upregulated upon refeeding. Mice lacking CLK2 in adipose tissue exhibit exacerbated obesity and decreased energy expenditure during high fat intermittent fasting. Additionally, tissue oxygen consumption and protein levels of UCP1 are reduced in CLK2-deficient BAT. Phosphorylation of CREB, a transcriptional activator of UCP1, is markedly decreased in BAT cells lacking CLK2 due to enhanced CREB dephosphorylation. Mechanistically, CREB dephosphorylation is rescued by inhibition of PP2A, a phosphatase that targets CREB. Our results suggest that CLK2 is a regulatory component of diet-induced thermogenesis in BAT through increased CREB-dependent expression of UCP1.
Keywords: Clk2, intermittent fasting, brown fat, high fat diet, diet-induced thermogenesis, refeeding, UCP1, p-CREB, PP2A
Graphical abstract
Introduction
Obesity is a worldwide health problem with numerous associated complications, such as cardiovascular disease, type 2 diabetes and cancer (Haslam and James, 2005). Obesity results from an imbalance between energy intake and energy consumption, leading to excessive storage of spare energy as fat in adipose tissue (Lowell and Spiegelman, 2000). Strategies to tackle obesity include reducing energy intake and increasing energy expenditure, such as through exercise. For many people, neither of these strategies are easy to pursue and relapse rates on many anti-obesity programs are high, emphasizing the need for new approaches to promote sustained weight loss (Nedergaard et al., 2007).
As an alternative to caloric restriction or as a complementary intervention, intermittent fasting (IF) comprises various diets that cycle between a period of fasting and non-fasting. IF protocols have gained increased attention as weight loss strategies, as they may produce similar results as caloric restriction in humans, and are easier to pursue for many individuals (Seimon et al., 2015). However, little is known about the physiological and metabolic changes and processes involved in IF.
Brown adipose tissue (BAT) is a highly metabolically active fat depot characterized by uncoupling protein 1 (UCP1)-positive, multilocular, thermogenic adipocytes. Unlike white fat, which is abundant and designed to store energy, BAT is found in relatively small areas of the neck and periadrenal regions in adult humans, and acts to uncouple respiration to consume energy and produce heat (Peirce et al., 2014). Activation of BAT thus increases energy expenditure, and is regulated with age, outdoor temperature, and body mass index (Cypess et al., 2009). The metabolic impact of activated BAT in adult humans has been highlighted by numerous publications in recent years (Nedergaard et al., 2007; van Marken Lichtenbelt et al., 2009).
The role of BAT activity in diet-induced thermogenesis (DIT) has been studied in rodents and humans (Cannon and Nedergaard, 2010; Lee et al., 2016; Rothwell and Stock, 1979). The purpose and extent of DIT is controversial, though the capacity for DIT is inversely associated with obesity in mice (Bachman et al., 2002), suggesting that BAT activation during DIT may dissipate energy in order to maintain body weight following excess energy intake. Data in IF mice also suggest that an increase in energy expenditure through DIT contributes to the beneficial effects observed during IF, yet the molecular and physiological regulations involved are unknown (Hatori et al., 2012). The function of BAT activation during DIT likely extends beyond simply controlling weight, as additional protective functions for BAT activation include improving glucose tolerance, increasing insulin sensitivity, and enhancing metabolism of lipids from the bloodstream, which can all improve systemic metabolism in the face of increased caloric load (Harms and Seale, 2013).
Mechanistically during DIT, in response to feeding, the sympathetic nervous system is activated, causing stimulation of beta-adrenergic receptors (βARs) in the plasma membrane of brown adipocytes. Adenylyl cyclase is then activated, producing cyclic AMP (cAMP). cAMP promotes the activity of protein kinase A (PKA), also known as cAMP-dependent protein kinase. PKA signaling promotes lipolysis as well as upregulation and activation of UCP1, a mitochondrial proton carrier that increases thermogenesis by uncoupling oxidative phosphorylation (van Marken Lichtenbelt et al., 2009). The contribution of beta-adrenergic signaling to DIT has been shown in mice lacking all three beta adrenergic receptors (β-less mice) (Bachman et al., 2002). Brown adipocytes in these animals are thermogenically compromised and have decreased UCP1 protein, and the mice develop massive obesity on a high calorie diet due to reduced energy expenditure induction. Additional regulatory components of the feeding response in BAT that contribute to diet-induced energy expenditure have not been well-studied.
Cdc2-like kinase 2 (CLK2) is a dual-specificity kinase, which belongs to the evolutionarily conserved Clk-family (Hanes et al., 1994). We recently reported that CLK2 is regulated by the liver fed/fasting response. CLK2 responds to feeding and high fat diet and controls hepatic gluconeogenesis and the ketogenic fasting response (Rodgers et al., 2010; Tabata et al., 2014). In response to feeding, CLK2 is stabilized by Akt activation and directly hyperphosphorylates peroxisome proliferator-activated receptor gamma coactivator 1-alpha (PGC-1α) at the SR domain to repress its activity toward target genes (Rodgers et al., 2010). CLK2 has also been reported to play a role in SR protein recruitment and pre-mRNA splicing (Corkery et al., 2015). In addition, hepatic CLK2 interacts with regulatory subunits of the protein phosphatase 2A (PP2A) complex. We reported that CLK2 promotes the assembly of this phosphatase enzymatic complex in liver. CLK2 phosphorylates the PP2A regulatory subunit B56β (PPP2R5B, B′β), which is a critical regulatory step in the assembly of the PP2A holoenzyme complex on Akt leading to dephosphorylation and attenuation of Akt activity (Rodgers et al., 2011). Although the contribution of CLK2 to metabolic control in the liver has been addressed, the role of adipose CLK2 in energy balance is unknown.
Here, we investigate the function of adipose CLK2 in energy expenditure and BAT thermogenic activity. Mice lacking CLK2 in adipose tissue have defective DIT in BAT and an increase in body weight when subjected to high fat diet under an IF dietary regimen. CLK2 is activated upon refeeding in BAT and increases energy expenditure through sustained activation of CREB transcriptional activity and increased UCP1 expression. The CLK2 effects on CREB phosphorylation are mediated through attenuation of CREB inhibitory dephosphorylation by PP2A protein phosphatase. These results indicate that BAT CLK2 increases diet-mediated energy expenditure and protects against obesity.
Results
CLK2 is enriched in BAT and upregulated upon refeeding
To assess the potential regulatory role of CLK2 in adipose tissue, we first analyzed the expression of CLK2 mRNA transcripts in different fat depots (Figure 1A). CLK2 mRNA levels were enriched in interscapular BAT compared to subcutaneous inguinal white adipose tissue (iWAT) and visceral epididymal white adipose tissue (eWAT) depots (Figure 1A). Similar to our previous findings in the liver, CLK2 mRNA levels in BAT did not change upon fasting or refeeding (Figure 1B), and other members of the CLK family were not regulated on the mRNA level upon fasting and refeeding (Figure S1). However, CLK2 protein levels were increased during refeeding (Figure 1B). Insulin increased CLK2 protein level in differentiated primary brown adipocytes after 8 hours, with attenuation of CLK2 expression at 16 hours (Figure 1C). This effect was abolished upon pretreatment with the PI3K Inhibitor LY294002, suggesting a mechanism downstream of PI3K signaling. In addition, inhibiting protein translation with cycloheximide did not prevent the increase in CLK2 protein upon insulin treatment. Finally, treatment with insulin and the proteasome inhibitor MG132 sustained the increase in CLK2 protein levels after 16 hours, suggesting that proteasomal degradation contributes to CLK2 protein accumulation (Figure 1C). Taken together, these results indicate that CLK2 protein levels are increased upon insulin signaling and degraded via the proteasome, suggesting a mechanism of CLK2 regulation that is similar as previously described (Rodgers et al., 2010). These results demonstrate that CLK2 is regulated at the protein level in BAT in response to feeding, and that it may contribute to metabolic and energetic processes associated with food intake.
Figure 1. CLK2 is enriched in brown adipose tissue and regulated by feeding.
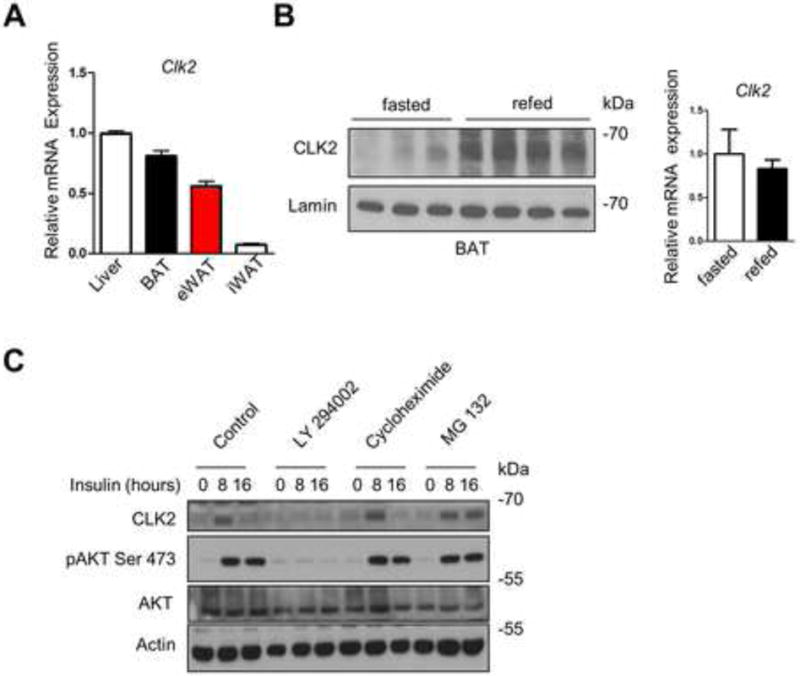
A) qRT-PCR analysis of CLK2 expression in tissue extracts of Clk2f/f mice as indicated (n=5). B) Western blots of BAT nuclear extracts from Clk2f/f mice after fasting (24h) or refeeding (12h) (left panel) and qRT-PCR analysis of BAT from Clk2f/f mice after fasting (24h) or refeeding (12) (right panel). C) Western blot of primary brown adipocytes treated with 100 nM insulin for 0, 8 or 16 hours and pre-treated as indicated. Data shown as mean ± SEM. Student’s t-test (2 data sets) or one-way-ANOVA (multiple data sets) were performed and p<0.05 was considered to be significant and indicated with *. (See also Figure S1)
Adipose-specific CLK2 KO mice exhibit decreased energy expenditure upon IF
To determine the role of CLK2 in whole body energy balance, we generated two different strains of CLK2-deficient mice. We used the CLK2 floxed (Clk2f/f) mice that have been previously described (Tabata et al., 2014) to obtain a CLK2 constitutive total body knockout mouse (Clk2tKO) (Lewandoski et al., 1997). These mice were used to isolate primary cells for adipocyte differentiation in vitro. CLK2 mRNA and protein were undetectable in primary differentiated brown adipocytes derived from these animals compared to Clk2f/f wild type control mice (Figure 2A), and there was no compensatory regulation of other CLK family members (Figure S2A). For in vivo phenotyping studies, we generated a second strain of mice by crossing Clk2f/f mice with adiponectin-driven Cre recombinase (Adiponectin-Cre-EVDR/J) mice to delete CLK2 in adipose tissue (Clk2aKO). Levels of CLK2 mRNA were markedly reduced in all adipose depots of these animals (Figure 2B) relative to Clk2f/f control mice.
Figure 2. CLK2 deletion in adipose tissue decreases energy expenditure.
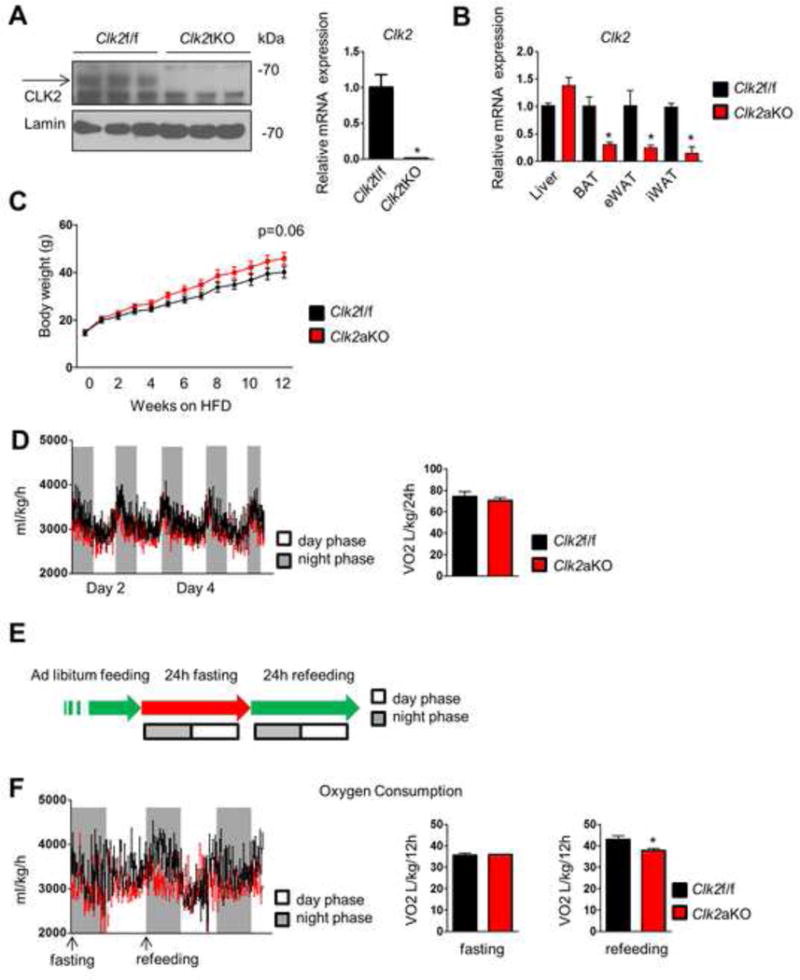
A) Western blot from primary adipocytes derived from Clk2tKO mice (left panel) and qRT-PCR analysis from cells of the same experiment (right panel). B) qRT-PCR analysis of Clk2 levels from Clk2f/f and Clk2aKO mice as indicated. C) Body weights of Clk2f/f and Clk2aKO mice chronically fed a HFD (n=5 per group). D) Oxygen consumption corrected by body weight of Clk2f/f and Clk2aKO mice chronically fed a high fat diet (HFD) (n= 8 per group, 13 weeks). E) Schematic of fasting and refeeding studies used in Figure 2F. F) Oxygen consumption corrected by body weight of Clk2f/f and Clk2aKO mice chronically fed a HFD (n= 3 per group and fasted (24h) or refed (24h). Data shown as mean ± SEM. Student’s t-test (2 data sets) or one-way-ANOVA (multiple data sets) were performed and p<0.05 was considered to be significant and indicated with *. (See also Figure S2)
The fact that CLK2 is enriched in brown fat suggests that this kinase might contribute to thermogenesis. However, no differences in body weight or core body temperature after short-term cold exposure were observed in Clk2aKO mice (Figure S2B and C). To further challenge these Clk2aKO mice, they were fed with high fat diet for a period of three months. Clk2aKO mice had a modest but consistent increase in body weight gain over time compared to Clk2f/f mice (Figure 2C). A comprehensive lab animal monitoring system (CLAMS) was used to assess parameters linked to energy balance in these mice. Clk2aKO mice had a slight reduction in total oxygen consumption that did not reach statistical significance (Figure 2D). However, when subjected to refeeding after a 24 hour fast (Figure 2E), Clk2aKO mice showed a marked decrease in oxygen consumption during the refeeding period (Figure 2F) without a change in food intake or movement (Figure S2D–G).
Since whole body energy expenditure was decreased in Clk2aKO mice upon HFD refeeding, we subjected the mice to a dietary regimen of HFD combined with IF (Hatori et al., 2012), allowing access to food only during the active (night) phase for a period of twelve weeks (Figure 3A). The rationale was to use a dietary model of increased food caloric intake that causes elevated rates of energy expenditure. The IF regimen synchronizes and restricts daily eating times and causes an increase in energy expenditure and a decrease in body weight compared to ad libitum HFD (Hatori et al., 2012). As expected, the Clk2f/f mice gained less weight during IF (Figure 3B) than when fed ad libitum (Figure 2C). Although the Clk2aKO mice also gained less weight than when fed ad libitum, the IF regimen uncovered an increased propensity for obesity, with the Clk2aKO mice gaining significantly more weight than the Clk2f/f mice (Figure 3B). Blood glucose and insulin levels were slightly but non-significantly increased in Clk2aKO mice compared to Clk2f/f mice (Figure 3C and D). Consistent with this increase in body weight, whole body oxygen consumption was reduced in Clk2aKO mice (Figure 3E), without any difference in food intake or movement (Figure S3A–C). Of note, IF lead to slightly decreased food intake in both genotypes compared to ad libitum feeding, but with no difference between control and Clk2aKO mice (Figure S3D). These results indicate that adipose tissue CLK2 is necessary to fully increase energy expenditure in the IF dietary regimen and maintain reduced body weight.
Figure 3. CLK2 deficiency exacerbates obesity during an IF regimen.
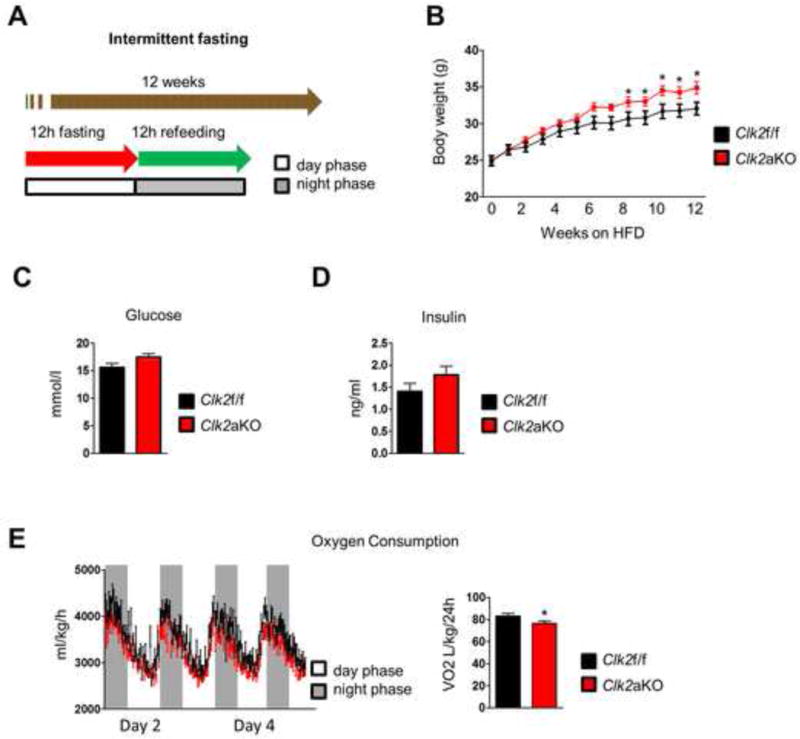
A) Schematic of IF dietary regimen used in Figure 3. B) Body weight of Clk2f/f and Clk2aKO mice chronically subjected to IF and HFD (n= 10 per group). C) Blood glucose of Clk2f/f and Clk2aKO mice after 12 weeks of IF and 2h fast before sample collection. D) Serum insulin levels of Clk2f/f and Clk2aKO mice after 12 weeks of IF and 2h fast before sample collection. E) Oxygen consumption corrected by body weight of Clk2f/f and Clk2aKO mice chronically subjected to IF and HFD (n= 8 per group). Data shown as mean ± SEM. Student’s t-test (2 data sets) or one-way-ANOVA (multiple data sets) were performed and p<0.05 was considered to be significant and indicated with *. (See also Figure S3)
CLK2 decreases BAT oxygen consumption cell autonomously
BAT thermogenic activity increases in response to high calorie diets to dissipate excess energy and ameliorate body weight gain (Harms and Seale, 2013; Rothwell and Stock, 1979). Since Clk2aKO mice exhibited reduced energy expenditure during different high fat dietary regimens, we investigated whether oxygen consumption was altered specifically in BAT from WT and Clk2aKO mice using ex vivo tissue analysis. Minced BAT from WT and Clk2aKO fasted (24h) and refed (18h) mice (Figure 4A) were used to measure oxygen consumption (Figure 4B). Consistent with the CLAMS results (Figure 2F), oxygen consumption rates were significantly lower in CLK2-deficient brown fat tissue (Figure 4B). In contrast, there was no difference in oxygen consumption in iWAT or eWAT, or in BAT after fasting (Figure S4A–C). These results indicate that the decrease in energy expenditure of Clk2aKO mice stems from a cell autonomous defect in brown adipocyte respiration after refeeding.
Figure 4. BAT oxygen consumption and UCP1 expression is reduced with CLK2 deficiency.
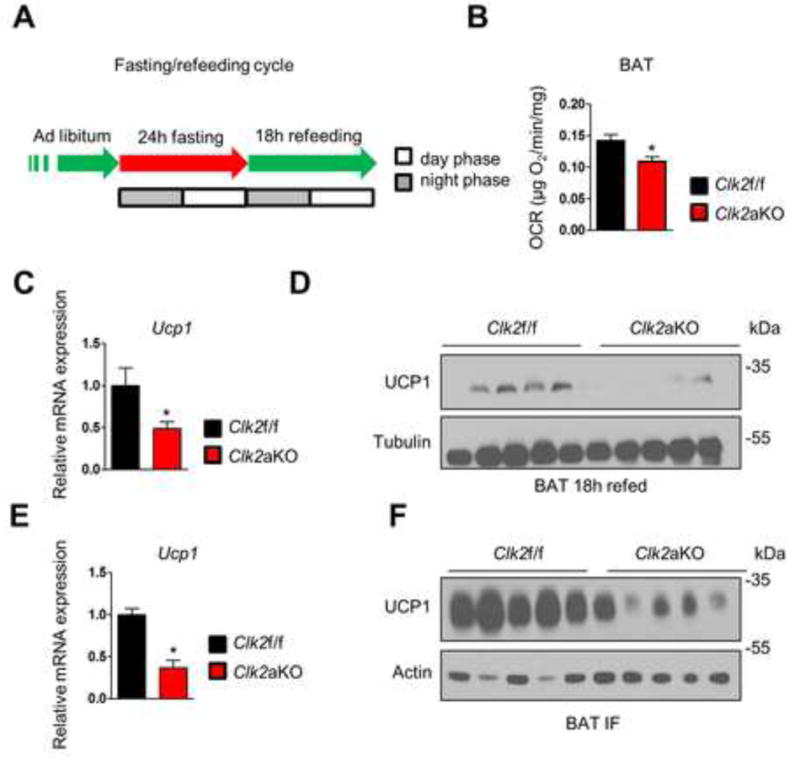
A) Schematic of fasting and refeeding studies used in Figure 4. B) Oxygen consumption rates of BAT explants from Clk2f/f and Clk2aKO mice after 18h refeeding (n=5). C) qRT-PCR analysis of BAT from lean Clk2f/f and Clk2aKO mice after 18h refeeding (n=5). D) Western blot analysis of BAT from lean Clk2f/f and Clk2aKO mice after 18h refeeding. E) qRT-PCR analysis of BAT from Clk2f/f and Clk2aKO mice subjected to IF for 12 weeks (n=5). F) Western blot analysis of BAT from Clk2f/f and Clk2aKO mice subjected to IF for 12 weeks. Data shown as mean ± SEM. Student’s t-test (2 data sets) or one-way-ANOVA (multiple data sets) were performed and p<0.05 was considered to be significant and indicated with *. (See also Figure S4)
Loss of CLK2 in brown adipocytes causes a marked reduction in UCP1 expression
One of the main thermogenic mechanisms in brown adipocytes involves mitochondrial uncoupled respiration that bypasses ATP synthesis and dissipates heat. A key component of this mechanism is uncoupling protein 1 (UCP1), an inner mitochondrial proton carrier that decreases membrane potential and conductance (Lowell and Spiegelman, 2000). To assess whether the decreased energy expenditure in Clk2aKO mice or oxygen consumption in CLK2-deficient brown adipocytes was associated with repressed expression of UCP1, we first measured UCP1 mRNA transcripts and protein levels in BAT from mice exposed to different dietary treatments. UCP1 mRNA was reduced in BAT from lean Clk2aKO mice after refeeding (Figure 4C) and after 12 weeks of IF compared to controls (Figure 4E). In alignment with this finding, protein levels for UCP1 were also decreased in CLK2-deficient mice (Figure 4D and 4F). However, despite profound changes in UCP1 protein, no changes were observed in mitochondrial mass (Figure S4D–F). These results suggest that BAT CLK2 controls the transcription of UCP1 but has no effect on mitochondrial biogenesis, as markers of mitochondrial mass remain largely unaffected.
Next, to determine if UCP1 mRNA and protein changes in BAT are cell autonomous, we isolated primary brown adipocytes from Clk2tKO mice. CLK2-deficient brown adipocytes had decreased UCP1 mRNA and substantially reduced UCP1 protein levels (Figure 5A and B). However, the degree of differentiation analyzed by measurement of specific differentiation markers including aP2, adiponectin, and PPARγ was similar between the two genotypes (Figure 5B). In addition, no differences were observed in markers of mitochondrial mass (Figure 5C). Although basal levels of UCP1 were reduced in CLK2-deficient brown adipocytes, fold induction of its mRNA and protein upon norepinephrine stimulation was similar between control and Clk2tKO cells (Figure 5D and E), demonstrating intact adrenergic signaling in the Clk2tKO cells.
Figure 5. CLK2-deficient brown adipocytes have a cell-autonomous defect in UCP1 expression.
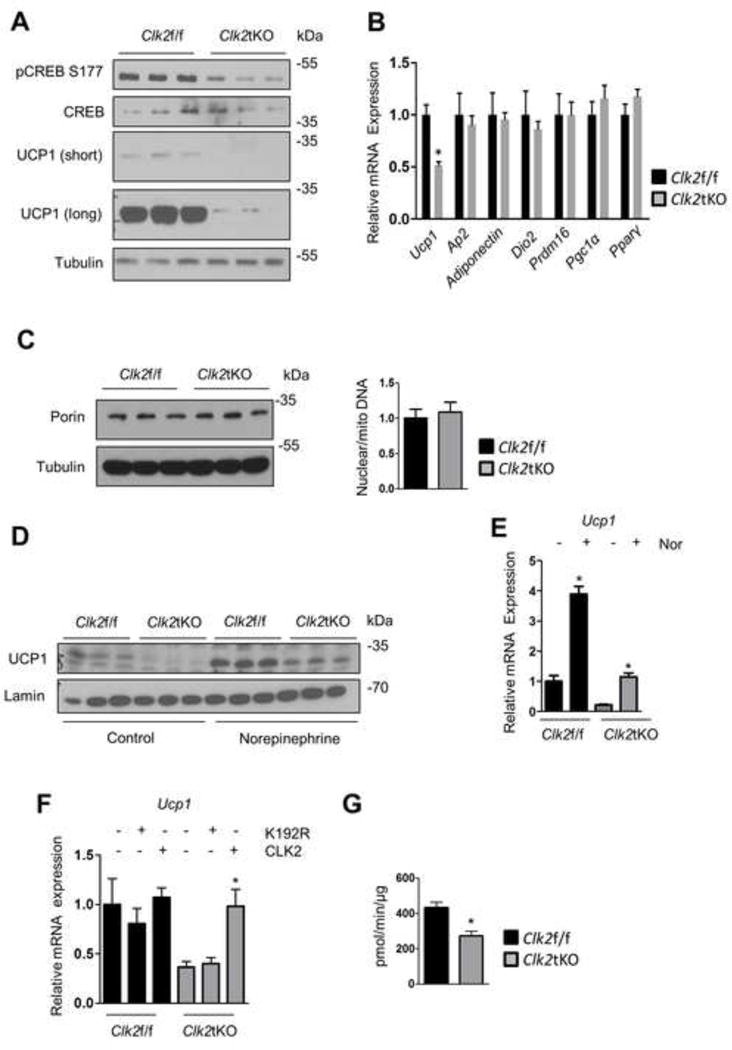
A) Western blots of primary brown adipocytes from Clk2f/f and Clk2tKO mice. B) qRT-PCR analysis from primary brown adipocytes. C) Western blots from primary brown adipocytes and qRT-PCR analysis from nuclear and mitochondrial DNA of primary brown adipocytes. D) Western blot from primary brown adipocytes treated with 100 nM norepinephrine for 24 hours. E) qRT-PCR analysis from primary brown adipocytes treated for 2 hours with 100 nM norepinephrine as indicated. F) qRT-PCR analysis from primary brown adipocytes infected with adenoviruses as indicated and harvested 36h post infection. G) Oxygen consumption rate in primary brown adipocytes. Cell culture experiments were done in triplicate and at least 3 independent experiments were performed. Data shown as mean ± SEM. Student’s t-test (2 data sets) or one-way-ANOVA (multiple data sets) were performed and p<0.05 was considered to be significant and indicated with *.
To further support the effects of CLK2 on UCP1 gene expression, primary brown adipocytes derived from Clk2f/f or Clk2tKO mice were infected with adenoviruses encoding wild type CLK2 or a kinase inactive mutant (K192R), as described previously (Rodgers et al., 2010; Rodgers et al., 2011). CLK2 ectopic expression rescued the levels of UCP1 mRNA levels in CLK2-deficient brown adipocytes, but the K192R mutant did not affect UCP1 transcript levels (Figure 5F). Lastly, using a Seahorse Extracellular Flux Analyzer, the oxygen consumption rate of primary adipocytes lacking CLK2 was reduced (Figure 5G). These results suggest that CLK2 increases UCP1 protein and mRNA levels in brown adipocytes in a cell-autonomous manner.
Brown adipose CLK2 deficiency causes PP2A-dependent CREB dephosphorylation
One of the major regulatory signals that controls energy expenditure in BAT is the canonical cAMP/PKA pathway, which is activated in response to cold or increased food intake (Bachman et al., 2002). A major effector of this response is UCP1, which is regulated through this pathway partially at the transcriptional level (Bachman et al., 2002; Lowell and Spiegelman, 2000). To determine whether components of the cAMP/PKA pathway are involved in CLK2-dependent control of UCP1 expression, we first measured intracellular levels of cAMP. Basal or forskolin-induced cAMP levels were similar in Clk2f/f and Clk2tKO brown adipocytes (Figure 6A). Since adrenergic signaling stimulates lipolysis during energy deficits (Peirce et al., 2014), we also measured lipolysis in primary differentiated adipocytes obtained from subcutaneous fat. Isoproterenol treatment induced similar levels of glycerol release and similar induction of lipolytic genes, suggesting that the lipolytic response is not affected in the absence of CLK2 (Figure S5A and B). Since the UCP1 promoter contains cAMP regulatory elements that bind to CREB (Koo et al., 2005; Lowell and Spiegelman, 2000), we measured levels of phospho-CREB (the activated form) after forskolin treatment in Clk2f/f and Clk2tKO brown adipocytes. Similar levels of phospho-CREB were observed upon these conditions in the presence or absence of CLK2 (Figure 6B), suggesting that initial increases in CREB phosphorylation are not affected by CLK2.
Figure 6. CLK2 decreases CREB dephosphorylation via a PP2A phosphatase-dependent pathway.
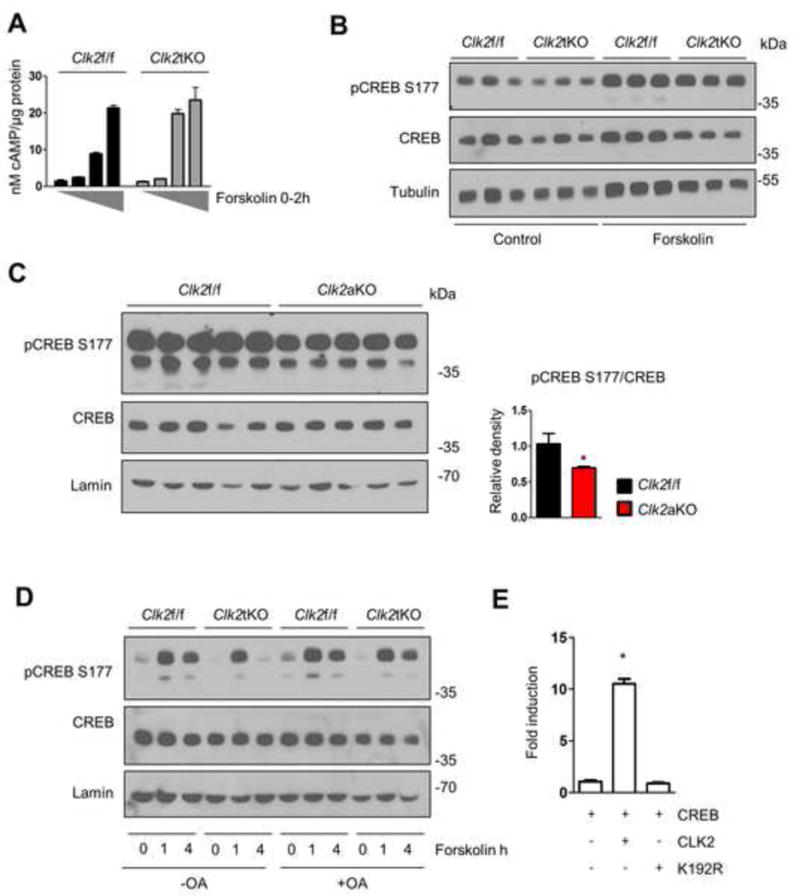
A) cAMP measurements in whole cell lysates after 10 μM forskolin treatment (0, 15 min, 1h, 2h). B) Western blot from primary brown adipocytes after 1 hour 10 μM forskolin treatment as indicated. C) Western blot of BAT from Clk2f/f and Clk2aKO mice subjected to IF for 12 weeks. D) Western blot from primary brown adipocytes after 10 μM forskolin treatment as indicated in the presence or absence of 5 nM okadaic acid (OA). E) Luciferase reporter assay from U2OS cells transfected with a cyclic AMP response binding element reporter, CREB and CLK2 or control DNA as indicated. Cell culture experiments were done in triplicate and at least 3 independent experiments were performed. Data shown as mean ± SEM. Student’s t-test (2 data sets) or one-way-ANOVA (multiple data sets) were performed and p<0.05 was considered to be significant and indicated with *. (See also Figure S5)
However, we found a decrease in CREB phosphorylation in BAT of Clk2aKO mice after IF compared to WT controls (Figure 6C), suggesting that the rate of CREB dephosphorylation could be involved in the regulation of energy expenditure by Clk2. CREB dephosphorylation is a mechanism to attenuate the cAMP response. Dephosphorylation occurs, depending on cell types and conditions, between 30 minutes and several hours after the initial stimulation (Koo et al., 2005). Notably, we found that lack of CLK2 in brown adipocytes decreased levels of phospho-CREB during the attenuation phase (Figure 6D, Figure S5C). This result suggests that CLK2 might affect the CREB phosphatase that dephosphorylates phospho-CREB at Ser 177 (Wadzinski et al., 1993). Since we previously found that hepatic CLK2 affects PP2A activity towards Akt, we used the PP2A inhibitor okadaic acid to suppress PP2A catalytic activity in WT and Clk2tKO brown adipocytes. In the absence of okadaic acid, and after 1 hour of forskolin treatment, CLK2-deficient brown adipocytes increased the levels of phospho-CREB similar to WT cells (Figure 6D). However, a strong reduction in phospho-CREB was observed in Clk2tKO cells after 4 hours. The presence of okadaic acid completely suppressed phospho-CREB reduction at 4 hours in CLK2-deficient cells (Figure 6D), suggesting that PP2A inhibition is involved in Clk2-mediated CREB phosphorylation. Treatment with okadaic acid also rescued UCP1 gene expression in Clk2aKO cells (Figure S5D). To test whether increased CREB phosphorylation in the presence of CLK2 leads to increased transcriptional activity, we also performed a luciferase reporter assay using a cAMP-responsive binding element reporter. Consistent with the effects on CREB phosphorylation, CLK2 strongly increased luciferase activity, while the kinase dead CLK2 mutant K192R or a GFP control plasmid had no effect on the activity (Figure 6E). Taken together, these data show that CLK2 in brown adipocytes does not affect cyclic AMP signaling induction, but attenuates the termination of this signal, likely by inhibiting CREB dephosphorylation and maintaining increased CREB transcriptional activity.
Discussion
In these studies, we show that CLK2 controls the thermogenic process in BAT and regulates energy expenditure. CLK2 expression is enriched in brown compared to white fat, and CLK2 is upregulated upon refeeding at the protein level. Mice lacking CLK2 in adipose tissue show decreased energy expenditure, mainly through attenuated BAT oxygen consumption. This reduced respiration rate impairs the anti-obesity effects of a time-restricted feeding regimen. Brown adipocytes lacking CLK2 exhibit decreased levels of UCP1, which may account, at least in part, for the decrease in respiration. Furthermore, CLK2-deficient cells show decreased levels of active phospho-CREB, indicating that CLK2 increases CREB transcriptional activity in BAT. Inhibition of PP2A phosphatase, which targets and inactivates CREB, rescues CREB phosphorylation in CLK2-deficient cells. Overall, these results indicate that CLK2 contributes to DIT, particularly in intermittent HFD fasting regimens.
Increased attention has been paid to IF regimens in humans, and studies have shown a similar effect on weight loss compared to caloric restriction (Seimon et al., 2015). A concept widely accepted and accountable for weight loss on time restricted feeding is DIT (Cannon and Nedergaard, 2010; Rothwell and Stock, 1979). Our results propose that CLK2 regulates DIT. Interestingly, CLK2 appears not to be involved in the initial activation of BAT through beta adrenergic signaling, but CLK2 action prolongs the effects on the thermogenic transcriptional program. Our findings showing that CLK2 affects energy expenditure at late time points of refeeding (12–24h) are consistent with a model that BAT CLK2 contributes to DIT. Thus, CLK2 does not play a role in the vital circuits maintaining body core temperature, but permits a sustained activation of brown adipose thermogenic response during nutrient excess. This allows the body to invest in effective thermogenesis in phases of caloric overload, but not during times of low energy intake. This model is supported by our results that CLK2 deficiency has no effect on cold-induced thermogenesis, and that CLK2-deficient cells are able to induce UCP1 protein and mRNA upon stimulation with norepinephrine.
We and others have previously shown that feeding increases CLK2 in insulin-sensitive tissues such as the liver (Nam et al., 2010; Rodgers et al., 2010; Rodgers et al., 2011; Tabata et al., 2014). In hepatocytes, CLK2 is directly phosphorylated by AKT and auto-phosphorylated at several residues, leading to stabilization of the protein (Nam et al., 2010; Rodgers et al., 2010). Our results suggest a similar mechanism of CLK2 activation in BAT. However, we did not detect this regulation in white adipose depots, likely due to low levels of CLK2 protein. Consistent with this, we did not observe any changes related to energetic processes in white adipose depots of CLK2aKO compared to WT mice. However, future studies with BAT-specific Clk2 knockout would be informative to clarify this specificity.
Not much is known about the termination of the CREB Ser133 phosphorylation signal, which leads to lower transcriptional activity. It has been reported that PKA-phosphorylated CREB is a substrate of PP2A (Wadzinski et al., 1993). In hepatocytes, CLK2 affects the PP2A holoenzyme complex assembly by phosphorylating a regulatory subunit, thereby regulating its phosphatase activity on phosphorylated AKT (Rodgers et al., 2011). We have shown that CREB phosphorylation is attenuated over time in CLK2-deficient cells and that the levels of phospho-Creb are lower in BAT of mice deficient in CLK2. As total CREB protein levels and initial CREB phosphorylation are not affected, a role for CLK2 in the termination of CREB activation is likely. CLK2 is known to mediate the activity of PP2A, which can dephosphorylate phospho-CREB (Cohen, 1989), and PP2A inhibition completely rescued decreased phospho-CREB levels in CLK2-deficient primary adipocytes. We have previously shown in hepatocytes that CLK2 increases PP2A activity toward AKT (Rodgers et al., 2011). However, this effect appears to be tissue-specific, because we did not detect any changes in BAT AKT phosphorylation, suggesting cell type-specific regulation of CLK2 activity toward the PP2A holoenzyme complex. It can be speculated that CLK2 in BAT interferes with the formation of a PP2A complex that preferentially targets phospho-CREB. The precise mechanisms of how CLK2 controls PP2A and CREB phosphorylation are unclear at this point, but it is likely that CLK2 phosphorylates components of the PP2A regulatory subunits providing specificity to the phosphatase catalytic activity.
In summary, our studies indicate that CLK2 mediates energy expenditure through increases in BAT oxygen consumption in postprandial fed states. Notably, these increases in energy expenditure are sufficient to maintain a decreased body weight upon a HFD IF dietary regimen. The fact that CLK2 is regulated by insulin and specifically controls the BAT thermogenic process in response to specific time-restricted food intake dietary patterns opens the possibility of developing drug-targeted therapies using this kinase or components of this pathway. BAT-specific targeting of the Clk2 pathway has the potential to increase energy expenditure and recapitulate the beneficial weight loss effects of IF, thereby revealing a potential anti-obesity therapeutic strategy.
Experimental Procedures
Animal experiments
All experiments and protocols were approved by the Institutional Animal Care and Use Committees of Dana-Farber Cancer Institute or Beth Israel Deaconess Medical Center. Clk2-AdipoCre mice (Clk2aKO) and Clk2 Zp3-Cre mice (Clk2tKO) were generated by breeding animals harboring a floxed Clk2 allele with transgenic mice expressing Adiponectin-Cre recombinase or Zona pellucida-Cre, respectively (Jeffery et al., 2014; Lewandoski et al., 1997). Mice were maintained on standard chow or 60% high fat diet (Research Diets) with 12h dark/light-cycles. For IF studies, access to food was regulated by transferring mice daily between cages with food and water and cages with water only according to a previously published protocol (Hatori et al., 2012). For cold exposure experiments, mice were placed in 4°C incubators at indicated time points, and body temperature was measured with a rectal probe. For metabolic studies, energy expenditure was analyzed using a Comprehensive Lab Animal Monitoring System (Columbus Instruments). Mice were acclimated for 24h before measurements were taken. For in vivo oxygen consumption, mean oxygen consumption per hour of each individual mouse was determined and calculated for a 24h or 12h period, respectively. A representative 24h interval was chosen to calculate oxygen consumption and for fasting or feeding periods, and the last 12 hours of a 24h period was used for the calculation.
Food intake measurements
Food intake was measured in metabolic cages continuously by feeders connected to a scale and recorded by the system. For long term studies, mice were housed individually and food intake was measured weekly weighing the food before and after the measurement period. Food intake per day was calculated from the data obtained.
Oxygen consumption
Direct ex vivo tissue respiration was performed using a Clark electrode (Strathkelvin Instruments). Freshly isolated tissue was minced in respiration buffer (1.5 mM Pyruvate, 25 mM Glucose and 2% BSA) and placed in electrode chambers. O2 consumption rate was normalized to tissue weight.
Oxygen consumption in differentiated adipocytes was measured using the Seahorse XF24 Extracellular Flux Analyzer. Cells were plated and differentiated on Seahorse XF24 V7 plates. Prior to the assay, the cell media was changed to DMEM media lacking NaHCO3 and containing 25 mM glucose and 1 mM sodium pyruvate, with pH adjusted to 7.4. Oxygen tension was measured and normalized to protein content in each well.
Primary adipocytes cell culture
The stromal vascular fraction (SVF) of brown adipose tissue of 6 weeks old mice was isolated by collagenase digestion followed by two alternative filtrations steps (using 100 and 40 μM strainers) and centrifugations during 5 min at 500 × (g). Then, cells were plated and differentiated upon confluency with an adipogenic cocktail (0.5 mM IBMX, 1 μM Dexamethasone, 1 μM Rosiglitazone, 0.02 μM Insulin and 1 nM T3) for 48h. The cells were maintained in 0.02 μM Insulin and 1 nM T3 and harvested at day 6–8 post differentiation.
Treatment of primary adipocytes
Prior to treatment with insulin, cells were preconditioned in medium containing serum, but no insulin overnight. Insulin was added to the medium at indicated concentrations. For PI3K inhibitor studies, LY294002 (Tocris Bioscience) was added to the medium 16 hours before the treatment at 50 μM concentration. Cycloheximide (Cell Signaling) was used at 50 μg/ml and added at the beginning of the assay. Proteasome inhibitor MG132 (Cell Signaling) was added at 10 μM concentration at the beginning of the assay.
Forskolin (Sigma Aldrich) and norepinephrine (Sigma Aldrich) were used at indicated concentrations. Prior to any treatment, fresh medium was added 1 hour in advance.
Gene expression and Western Blot analysis
Total RNA from cultured cells or tissues was purified using TRIzol (Invitrogen) for cDNA synthesis (ABI High Capacity Reverse Transcription Kit). Relative mRNA expression was quantified by qPCR using SYBR Green dye (ABI) and specific primers (see Table S1 for primer sequences). For Western Blotting, whole cell lysates were prepared with RIPA buffer, separated by SDS-PAGE and transferred to ImmobilonP membranes (Millipore). The following antibodies were used: anti-CLK2 (NeoBioLab), anti-UCP1 (Abcam), pCREB (Cell Signaling), total CREB (Cell Signaling), anti-Tubulin (Milipore), anti-Lamin (Abcam), anti-Actin (Cell Signaling), anti-Porin (Abcam) anti-pAKT S473 (Cell Signaling), and anti-Pan AKT (Cell Signaling).
Mitochondrial DNA measurement
DNA was isolated from tissues or cells using a kit according to the manufacturers instruction (DNeasy Blood & Tissue Kit, Quiagen). DNA concentration was adjusted and qRT PCR was performed using primers for a genomic locus (18s) and a mitochondrial locus (Cox1). Relative mitochondrial DNA amount was calculated as a ratio of genomic versus mitochondrial DNA.
Lipolysis assay
Determination of free glycerol was performed as described (Eguchi et al., 2011). In brief, primary adipocytes were washed twice with DMEM and then incubated for 6 h in serum-free DMEM containing 1% fatty acid–free BSA in the presence or absence of 10 μM isoproterenol. Conditioned medium was then analyzed for glycerol using the Free Glycerol Determination Kit (Sigma). Adipocytes were then rinsed with PBS and harvested in RIPA buffer. The protein content of cell lysates was determined using the DC Protein Assay kit (BioRad).
Constructs
Plasmids and adenoviral constructs of CLK2 and the kinase-dead K192R control were used as previously published (Rodgers et al., 2010).
Supplementary Material
Acknowledgments
This work was supported by:
M.H.: Deutsche Forschungsgemeinschaft DFG, HA 7246/1-1, Medizinische Fakultät, RWTH Aachen University, Rotationstellenprogramm
A.K.R.: National Institute of Diabetes and Digestive and Kidney Diseases NRSA F32 DK102293-03
C.T.: Deutsche Forschungsgemeinschaft DFG, TR 285/10-1
P.P.: American Diabetes Association, National Institutes of Health/National Institute of Diabetes and Digestive and Kidney Diseases 1-R01-DK-089883-01A1
We would like to thank: Joe T. Rodgers for donation of reagents which were of critical importance to this work. Bruce M. Spiegelman, James Lo and all members of the Spiegelman lab for helpful discussion. A special thanks is given to all members of the Puigserver lab: Ajith Thomas and Devin McDonald for technical assistance, Joeva Barrow, Meghan Soustek, Eduardo Balsa, Clint Tavares, Christoph Herbel, Yoonjin Lee and Henning Fenselau for their scientific and personal support. We also thank Janet Veloz from the BIDMC animal facility for her great support on all animal work.
Footnotes
Publisher's Disclaimer: This is a PDF file of an unedited manuscript that has been accepted for publication. As a service to our customers we are providing this early version of the manuscript. The manuscript will undergo copyediting, typesetting, and review of the resulting proof before it is published in its final citable form. Please note that during the production process errors may be discovered which could affect the content, and all legal disclaimers that apply to the journal pertain.
Author Contributions
M.H. designed and performed experiments, analyzed data, and wrote the manuscript. C.L. and F.V. helped with the experiments and revised the manuscript. A.K.R, M.T. and J.A.H. revised the manuscript. C.T. and K.S. helped with the revision and analyzed the data. P.P. designed experiments, analyzed data and wrote the manuscript.
References
- Bachman ES, Dhillon H, Zhang CY, Cinti S, Bianco AC, Kobilka BK, Lowell BB. betaAR signaling required for diet-induced thermogenesis and obesity resistance. Science. 2002;297:843–845. doi: 10.1126/science.1073160. [DOI] [PubMed] [Google Scholar]
- Cannon B, Nedergaard J. Metabolic consequences of the presence or absence of the thermogenic capacity of brown adipose tissue in mice (and probably in humans) International journal of obesity. 2010;34(Suppl 1):S7–16. doi: 10.1038/ijo.2010.177. [DOI] [PubMed] [Google Scholar]
- Cohen P. The structure and regulation of protein phosphatases. Annual review of biochemistry. 1989;58:453–508. doi: 10.1146/annurev.bi.58.070189.002321. [DOI] [PubMed] [Google Scholar]
- Corkery DP, Holly AC, Lahsaee S, Dellaire G. Connecting the speckles: Splicing kinases and their role in tumorigenesis and treatment response. Nucleus. 2015;6:279–288. doi: 10.1080/19491034.2015.1062194. [DOI] [PMC free article] [PubMed] [Google Scholar]
- Cypess AM, Lehman S, Williams G, Tal I, Rodman D, Goldfine AB, Kuo FC, Palmer EL, Tseng YH, Doria A, et al. Identification and importance of brown adipose tissue in adult humans. The New England journal of medicine. 2009;360:1509–1517. doi: 10.1056/NEJMoa0810780. [DOI] [PMC free article] [PubMed] [Google Scholar]
- Eguchi J, Wang X, Yu S, Kershaw EE, Chiu PC, Dushay J, Estall JL, Klein U, Maratos-Flier E, Rosen ED. Transcriptional control of adipose lipid handling by IRF4. Cell metabolism. 2011;13:249–259. doi: 10.1016/j.cmet.2011.02.005. [DOI] [PMC free article] [PubMed] [Google Scholar]
- Hanes J, von der Kammer H, Klaudiny J, Scheit KH. Characterization by cDNA cloning of two new human protein kinases. Evidence by sequence comparison of a new family of mammalian protein kinases. Journal of molecular biology. 1994;244:665–672. doi: 10.1006/jmbi.1994.1763. [DOI] [PubMed] [Google Scholar]
- Harms M, Seale P. Brown and beige fat: development, function and therapeutic potential. Nature medicine. 2013;19:1252–1263. doi: 10.1038/nm.3361. [DOI] [PubMed] [Google Scholar]
- Haslam DW, James WP. Obesity. Lancet. 2005;366:1197–1209. doi: 10.1016/S0140-6736(05)67483-1. [DOI] [PubMed] [Google Scholar]
- Hatori M, Vollmers C, Zarrinpar A, DiTacchio L, Bushong EA, Gill S, Leblanc M, Chaix A, Joens M, Fitzpatrick JA, et al. Time-restricted feeding without reducing caloric intake prevents metabolic diseases in mice fed a high-fat diet. Cell metabolism. 2012;15:848–860. doi: 10.1016/j.cmet.2012.04.019. [DOI] [PMC free article] [PubMed] [Google Scholar]
- Jeffery E, Berry R, Church CD, Yu S, Shook BA, Horsley V, Rosen ED, Rodeheffer MS. Characterization of Cre recombinase models for the study of adipose tissue. Adipocyte. 2014;3:206–211. doi: 10.4161/adip.29674. [DOI] [PMC free article] [PubMed] [Google Scholar]
- Koo SH, Flechner L, Qi L, Zhang X, Screaton RA, Jeffries S, Hedrick S, Xu W, Boussouar F, Brindle P, et al. The CREB coactivator TORC2 is a key regulator of fasting glucose metabolism. Nature. 2005;437:1109–1111. doi: 10.1038/nature03967. [DOI] [PubMed] [Google Scholar]
- Lee P, Bova R, Schofield L, Bryant W, Dieckmann W, Slattery A, Govendir MA, Emmett L, Greenfield JR. Brown Adipose Tissue Exhibits a Glucose-Responsive Thermogenic Biorhythm in Humans. Cell metabolism. 2016;23:602–609. doi: 10.1016/j.cmet.2016.02.007. [DOI] [PubMed] [Google Scholar]
- Lewandoski M, Wassarman KM, Martin GR. Zp3-cre, a transgenic mouse line for the activation or inactivation of loxP-flanked target genes specifically in the female germ line. Current biology: CB. 1997;7:148–151. doi: 10.1016/s0960-9822(06)00059-5. [DOI] [PubMed] [Google Scholar]
- Lowell BB, Spiegelman BM. Towards a molecular understanding of adaptive thermogenesis. Nature. 2000;404:652–660. doi: 10.1038/35007527. [DOI] [PubMed] [Google Scholar]
- Nam SY, Seo HH, Park HS, An S, Kim JY, Yang KH, Kim CS, Jeong M, Jin YW. Phosphorylation of CLK2 at serine 34 and threonine 127 by AKT controls cell survival after ionizing radiation. The Journal of biological chemistry. 2010;285:31157–31163. doi: 10.1074/jbc.M110.122044. [DOI] [PMC free article] [PubMed] [Google Scholar]
- Nedergaard J, Bengtsson T, Cannon B. Unexpected evidence for active brown adipose tissue in adult humans. American journal of physiology. Endocrinology and metabolism. 2007;293:E444–452. doi: 10.1152/ajpendo.00691.2006. [DOI] [PubMed] [Google Scholar]
- Peirce V, Carobbio S, Vidal-Puig A. The different shades of fat. Nature. 2014;510:76–83. doi: 10.1038/nature13477. [DOI] [PubMed] [Google Scholar]
- Rodgers JT, Haas W, Gygi SP, Puigserver P. Cdc2-like kinase 2 is an insulin-regulated suppressor of hepatic gluconeogenesis. Cell metabolism. 2010;11:23–34. doi: 10.1016/j.cmet.2009.11.006. [DOI] [PMC free article] [PubMed] [Google Scholar]
- Rodgers JT, Vogel RO, Puigserver P. Clk2 and B56beta mediate insulin-regulated assembly of the PP2A phosphatase holoenzyme complex on Akt. Molecular cell. 2011;41:471–479. doi: 10.1016/j.molcel.2011.02.007. [DOI] [PMC free article] [PubMed] [Google Scholar]
- Rothwell NJ, Stock MJ. A role for brown adipose tissue in diet-induced thermogenesis. Nature. 1979;281:31–35. doi: 10.1038/281031a0. [DOI] [PubMed] [Google Scholar]
- Seimon RV, Roekenes JA, Zibellini J, Zhu B, Gibson AA, Hills AP, Wood RE, King NA, Byrne NM, Sainsbury A. Do intermittent diets provide physiological benefits over continuous diets for weight loss? A systematic review of clinical trials. Molecular and cellular endocrinology. 2015;418(Pt 2):153–172. doi: 10.1016/j.mce.2015.09.014. [DOI] [PubMed] [Google Scholar]
- Tabata M, Rodgers JT, Hall JA, Lee Y, Jedrychowski MP, Gygi SP, Puigserver P. Cdc2-like kinase 2 suppresses hepatic fatty acid oxidation and ketogenesis through disruption of the PGC-1alpha and MED1 complex. Diabetes. 2014;63:1519–1532. doi: 10.2337/db13-1304. [DOI] [PMC free article] [PubMed] [Google Scholar]
- van Marken Lichtenbelt WD, Vanhommerig JW, Smulders NM, Drossaerts JM, Kemerink GJ, Bouvy ND, Schrauwen P, Teule GJ. Cold-activated brown adipose tissue in healthy men. The New England journal of medicine. 2009;360:1500–1508. doi: 10.1056/NEJMoa0808718. [DOI] [PubMed] [Google Scholar]
- Wadzinski BE, Wheat WH, Jaspers S, Peruski LF, Jr, Lickteig RL, Johnson GL, Klemm DJ. Nuclear protein phosphatase 2A dephosphorylates protein kinase A-phosphorylated CREB and regulates CREB transcriptional stimulation. Molecular and cellular biology. 1993;13:2822–2834. doi: 10.1128/mcb.13.5.2822. [DOI] [PMC free article] [PubMed] [Google Scholar]
Associated Data
This section collects any data citations, data availability statements, or supplementary materials included in this article.


