

Abstract
Nonalcoholic fatty liver is associated with obesity‐related metabolic disturbances, but little is known about the metabolic perturbations preceding fatty liver disease. We performed comprehensive metabolic profiling to assess how circulating metabolites, such as lipoprotein lipids, fatty acids, amino acids, and glycolysis‐related metabolites, reflect the presence of and future risk for fatty liver in young adults. Sixty‐eight lipids and metabolites were quantified by nuclear magnetic resonance metabolomics in the population‐based Young Finns Study from serum collected in 2001 (n = 1,575), 2007 (n = 1,509), and 2011 (n = 2,002). Fatty liver was diagnosed by ultrasound in 2011 when participants were aged 34‐49 years (19% prevalence). Cross‐sectional associations as well as 4‐year and 10‐year risks for fatty liver were assessed by logistic regression. Metabolites across multiple pathways were strongly associated with the presence of fatty liver (P < 0.0007 for 60 measures in age‐adjusted and sex‐adjusted cross‐sectional analyses). The strongest direct associations were observed for extremely large very‐low‐density lipoprotein triglycerides (odds ratio [OR] = 4.86 per 1 standard deviation, 95% confidence interval 3.48‐6.78), other very‐low‐density lipoprotein measures, and branched‐chain amino acids (e.g., leucine OR = 2.94, 2.51‐3.44). Strong inverse associations were observed for high‐density lipoprotein measures, e.g., high‐density lipoprotein size (OR = 0.36, 0.30‐0.42) and several fatty acids including omega‐6 (OR = 0.37, 0.32‐0.42). The metabolic associations were attenuated but remained significant after adjusting for waist, physical activity, alcohol consumption, and smoking (P < 0.0007). Similar aberrations in the metabolic profile were observed already 10 years before fatty liver diagnosis. Conclusion: Circulating lipids, fatty acids, and amino acids reflect fatty liver independently of routine metabolic risk factors; these metabolic aberrations appear to precede the development of fatty liver in young adults. (Hepatology 2017;65:491‐500).
Abbreviations
- BMI
body mass index
- HDL
high‐density lipoprotein
- NMR
nuclear magnetic resonance
- OR
odds ratio
- SD
standard deviation
- VLDL
very‐low‐density lipoprotein
In conjunction with the rising prevalence of obesity, nonalcoholic fatty liver disease has become a major public health problem that affects every third adult in developed countries.1 Physical inactivity2 and unhealthy dietary habits3 are the major behavioral risk factors of fatty liver. Fatty liver is robustly associated with well‐known cardiometabolic risk factors (such as obesity, dyslipidemia, and insulin resistance) and increases the risk for type 2 diabetes and cardiovascular disease.4, 5 Fatty liver, i.e., mild steatosis, can develop into more severe liver disease, an inflammatory steatohepatitis, and irreversible fibrosis or cirrhosis.1 Although fatty liver is related to obesity and insulin resistance, its molecular pathogenesis remains poorly understood, and therapeutic options are limited.1, 6
Fatty liver is caused by the accumulation of triglyceride deposits in the liver and their tendency to form lipid droplets.1 Fat accumulation has been linked to increased nonesterified fatty acid inflow to the liver, hepatic de novo lipogenesis, impaired mitochondrial fat oxidation, and inadequate hepatic fat secretion through very‐low‐density lipoproteins (VLDLs).1, 7 Because the function of the liver is critical in multiple pathways regulating systemic metabolism, it can be argued that characterizing a metabolic signature of mild steatosis may shed light on the pathogenesis of fatty liver disease. Until now, metabolomics studies on fatty liver have been conducted in small cross‐sectional case–control settings or in connection with bariatric surgery. These studies have revealed significant associations of overt nonalcoholic steatosis and steatohepatitis with levels of lipoprotein lipids, fatty acids, amino acids, and ketone bodies.8, 9, 10, 11, 12 However, there is a paucity of long‐term prospective studies with comprehensive metabolic profiling of blood samples from apparently healthy, young individuals. In order to elucidate the metabolic disturbances associated with not only the clinical manifestations of fatty liver but also the changes preceding the appearance of its signs and symptoms, we assessed cross‐sectional and prospective associations of 68 circulating lipoprotein lipids, fatty acids, amino acids, and other metabolic measures with fatty liver disease in a general‐population cohort of young and middle‐aged men and women. We hypothesized that circulating metabolites would be biomarkers for the presence of fatty liver and tested whether the metabolites would even be predictive for the risk of future fatty liver disease onset.
Materials and Methods
STUDY POPULATION
The Cardiovascular Risk in Young Finns Study is a population‐based, multicenter cohort follow‐up study being conducted in five Finnish university hospitals. The study began in 1980, when 3,596 children and adolescents (83.1% of those invited) aged 3, 6, 9, 12, 15, and 18 years randomly chosen from the Finnish national population register participated in the first clinical examinations.13 When they reached adulthood, follow‐up examinations were carried out in 2001, 2007, and 2011. In the 2011 survey, liver fat status was examined with ultrasound for 2,046 participants, who were then between 34 and 49 years old.
The analyses included in the present study include both cross‐sectional and prospective approaches. The cross‐sectional analyses of the 2011 survey data include n = 2,002 participants with assessment of liver fat status and metabolic measures quantified by nuclear magnetic resonance (NMR) metabolomics. The prospective analyses focus on the metabolic measures quantified from serum samples collected in 2001 (baseline of the present study) as predictors of fatty liver in 2011 for n = 1,575 participants. The metabolic associations in the prospective analyses were further validated using metabolomics data from 2007 (n = 1,509 with 4‐year follow‐up). All three adulthood examinations included assessment of anthropometrics and routine cardiovascular risk factors, including levels of liver enzymes and questionnaire‐based data on alcohol consumption and smoking status. All participants provided written informed consent, and the study was approved by the local ethics committees. The study protocol conformed to the ethical guidelines of the 1975 Declaration of Helsinki.
ASSESSMENT OF CLINICAL CHARACTERISTICS
In the clinical examinations, waist circumference, weight, and height were measured and body mass index (BMI) was calculated as kilograms per square meters. Blood pressure was measured with a random‐zero sphygmomanometer. Venous overnight fasting blood was drawn for biomarker analyses. Data on cigarette smoking (no versus yes), leisure‐time physical activity (an index score ranging 5‐15),14 mental disorders, cancer, and alcohol consumption were collected using questionnaires. To characterize long‐term alcohol consumption, the mean value of standard drinks per day assessed in 2001, 2007, and 2011 was used. A categorized four‐level alcohol intake variable was constructed as described.15 Complete information on history of human immunodeficiency virus and hepatitis C was obtained from the Finnish National Hospital Discharge Register. None of the participants had a diagnosis of hepatitis C or human immunodeficiency virus, which could potentially have contributed to the diagnosis of fatty liver.
METABOLITE QUANTIFICATION
A high‐throughput NMR metabolomics platform was used for the quantification of 68 lipid and metabolite measures that represent a broad molecular signature of systemic metabolism from serum samples collected in 2001, 2007, and 2011.16, 17, 18, 19 All metabolites were measured using a single experimental setup that allows for the simultaneous quantification of routine lipids, lipoprotein subclass distributions, fatty acids, as well as other low–molecular weight metabolites, such as amino acids and glycolysis‐related metabolites in absolute concentration units (e.g., millimoles per liter). NMR‐based metabolic profiling has been employed in various epidemiological and genetic studies,20, 21, 22 details of the experimentation have been described, and the method has recently been reviewed.16, 17 Concentrations of serum high‐sensitivity C‐reactive protein and serum activity of gamma‐glutamyl transferase, aspartate aminotransferase, and alanine aminotransferase were measured using standard clinical laboratory methods; and serum insulin was measured by microparticle enzyme immunoassay.13, 23 These conventional biomarkers of fatty liver were analyzed here to facilitate comparison with the reported metabolic associations.
IMAGING OF THE LIVER FAT STATUS
Ultrasonographic examinations were performed with Acuson Sequoia 512 ultrasound mainframes (Acuson, Mountain View, CA). The liver fat was scanned using 4.0‐MHz adult abdominal transducers. All participants with images of acceptable quality were included in the study. A trained sonographer graded the liver fat status from the ultrasonographic images using five widely accepted criteria for fatty liver: (1) the liver‐to‐kidney contrast, (2) parenchymal brightness, (3) deep beam attenuation, (4) bright vessel walls, and (5) visibility of the neck of the gallbladder. For statistical analyses, we used a binary outcome variable (normal liver versus fatty liver) based on the sonographer's clinical judgment of the image data. In addition, a categorical fatty liver score (0‐9) was formed based on the above criteria, as detailed in Supporting Table S1.
STATISTICAL ANALYSIS
Variables with skewed distributions were log‐transformed prior to the analyses. Metabolic associations with the dichotomous fatty liver diagnosis were assessed using logistic regression models separately for each metabolic measure. Cross‐sectional associations were assessed with fatty liver status as outcome and the metabolic measure from the same time point as the explanatory variable, with adjustment for age and sex. The analyses were further assessed with additional adjustment for waist circumference (or alternatively for BMI), alcohol consumption, physical activity index, and smoking status (fully adjusted model; mean substitution was used for missing values [<3.1%]). Similar logistic regression models were employed for the prospective analyses, with metabolite levels and covariates from the year 2001 or 2007 baseline data used as predictors of fatty liver status in 2011. To minimize the number of individuals with a possible fatty liver at baseline in 2001 or in 2007, participants having alanine aminotransferase >30 U/L were excluded from these analyses.24, 25 In order to facilitate comparison across different metabolic measures, odd ratios (ORs) from the logistic regression models were scaled to 1 standard deviation (SD) increment in metabolite concentration. All analyses were conducted without stratification because we found no interaction attributable to sex or high versus low alcohol consumption (using 30 g/day in men and 20 g/day in women as the cutoff point). Continuous associations between the 68 metabolic measures and the 0‐9 categorical fatty liver score were assessed by Spearman correlations. Multiple testing correction was performed by accounting for 68 tests using the Bonferroni method, with P < 0.0007 considered statistically significant.
Results
The present study examined 2,002 participants aged 34‐49 with the fatty liver assessment conducted by ultrasound along with a comprehensive metabolic profile quantified from a serum sample provided on the same day in 2011. In addition, 1,575 of the study participants had metabolic data based on serum samples from 2001 available, which made it possible to assess 10‐year prospective associations. The overall prevalence of fatty liver was 18.6% (n = 372), with the prevalence being higher in men (28.0%) than in women (10.8%). The clinical characteristics of the individuals with and without fatty liver are summarized in Table 1. Mean concentrations (SD) of the 68 metabolic measures analyzed are listed for normal liver and fatty liver participants in Supporting Table S1.
Table 1.
Clinical Characteristics of the Study Participants in 2011 and ORs for the Prevalence of Fatty Liver
|
Normal Liver Status (n = 1,630) |
Fatty Liver Status (n = 372) |
OR | ||||
|---|---|---|---|---|---|---|
| Mean | SD | Mean | SD | 95% Confidence Interval | ||
| Men | 40.1% | — | 68.3% | — | 3.32b | 2.61‐4.23 |
| Age (years, range) | 41.6 | (34‐49) | 43.2 | (34‐49) | 1.07c | 1.05‐1.10 |
| Circulating biomarkers | ||||||
| Aspartate aminotransferase (U/L)a | 21.6 | 10.4 | 31.8 | 32.3 | 1.98 | 1.74‐2.25 |
| Alanine aminotransferase (U/L)a | 14.8 | 9.7 | 31.7 | 36.4 | 3.34 | 2.85‐3.91 |
| Gamma‐glutamyl transferase (U/L)a | 27.6 | 27.7 | 62.5 | 70.8 | 2.78 | 2.41‐3.21 |
| Insulin (mU/L)a | 8.1 | 9.4 | 18.2 | 23.3 | 3.60 | 3.03‐4.27 |
| C‐reactive protein (mg/L)a | 1.70 | 2.70 | 3.15 | 4.17 | 2.20 | 1.92‐2.51 |
| Anthropometrics and blood pressure | ||||||
| Waist circumference (cm)a | 88.7 | 12.2 | 105.4 | 14.2 | 3.80 | 3.22‐4.49 |
| BMI (kg/m2)a | 25.5 | 4.3 | 30.9 | 5.6 | 3.34 | 2.88‐3.89 |
| Systolic blood pressure (mm Hg) | 117 | 13 | 127 | 14 | 1.80 | 1.59‐2.03 |
| Diastolic blood pressure (mm Hg) | 73 | 10 | 82 | 10 | 2.02 | 1.77‐2.30 |
| Behavioral variables | ||||||
| Leisure‐time physical activity (5‐15) | 9.2 | 1.8 | 8.3 | 1.8 | 0.79 | 0.73‐0.84 |
| Smoking prevalence (%) | 14.2 | 18.0 | 1.27 | 0.92‐1.75 | ||
| Alcohol intake (categorized 1‐4) | 1.85 | 0.58 | 2.11 | 0.73 | 1.54 | 1.27‐1.87 |
Characteristics data are mean (SD). Age‐ and sex‐adjusted odd ratios and their 95% confidence intervals are per 1‐SD increment in circulating biomarkers, anthropometric variables and blood pressure, and per 1‐step increment in sex, age, and behavioral variables.
Log‐transformed prior to calculating the ORs.
Age‐adjusted OR.
Sex‐adjusted OR.
We have previously presented the cross‐sectional associations of conventional metabolic risk factors with fatty liver in the Cardiovascular Risk in Young Finns Study.6 Here, we report the cross‐sectional and prospective associations for selected risk markers to facilitate interpretation of the association magnitudes observed for the metabolic measures quantified by NMR metabolomics. The strongest ORs for the presence of fatty liver were observed for waist, insulin, alanine aminotransferase, and male sex (Table 1). For instance, each 1‐SD unit increment in waist circumference (12 cm) was associated with a 3.8‐fold higher risk for prevalent fatty liver.
CROSS‐SECTIONAL ASSOCIATIONS OF METABOLITE MEASURES WITH FATTY LIVER
The cross‐sectional ORs for fatty liver for each metabolic measure are shown in Fig. 1. Age‐adjusted and sex‐adjusted associations are indicated by blue bars. Overall, 60 out of 68 metabolic measures were robustly associated with fatty liver in cross‐sectional settings (P < 0.0007). The ORs were attenuated upon additional adjustment for alcohol consumption, waist circumference, physical activity index, and smoking (red bars); but 41 measures remained significant at P < 0.0007. The corresponding metabolite associations adjusted for BMI rather than waist circumference are listed in Supporting Table S2. High concentrations of large VLDL particles, and particularly the triglyceride concentration in extremely large VLDL particles, were most strongly reflective of the presence of fatty liver. Higher concentrations of large high‐density lipoprotein (HDL) particles were robustly inversely associated with fatty liver, whereas higher concentrations of small HDL particles were directly associated with fatty liver. Several measures of lipoprotein particle size were also strongly associated with the presence of fatty liver, with inverse associations observed for both low‐density lipoprotein and HDL particle diameters. Triglyceride‐related lipid measures were generally more strongly associated with fatty liver than the corresponding cholesterol measures within the same lipoprotein subfractions.
Figure 1.
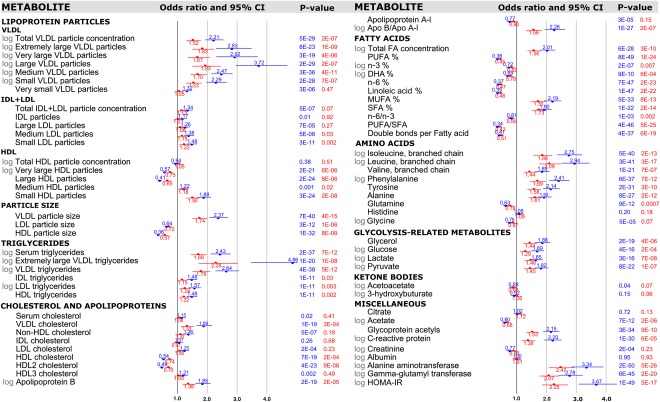
Cross‐sectional associations of metabolic measures with presence of fatty liver (n = 1,939‐2,002 of whom 339‐372 had diagnosed fatty liver in 2011). ORs and their 95% confidence intervals are per 1 standard deviation increment in the metabolic measures and shown with adjustment for sex and age (blue) and additionally for waist, alcohol intake, leisure‐time physical activity and smoking (red). P values listed in exponential format denote metabolite associations that were statistically significant associations when accounting for Bonferroni correction (P < 0.0007). Abbreviations: Apo, apolipoprotein; CI, confidence interval; DHA, docosahexaenoic acid; FA, fatty acid; HOMA‐IR, homeostatic model assessment of insulin resistance; IDL, intermediate‐density lipoprotein; LDL, low‐density lipoprotein; MUFA, monounsaturated fatty acid; PUFA, polyunsaturated fatty acid; SFA, saturated fatty acid.
The proportions of specific fatty acids relative to the total fatty acids were also strongly associated with fatty liver. Polyunsaturated fatty acids were robustly inversely associated with fatty liver, in particular for n‐6 (i.e., omega‐6) fatty acids. The levels of both monounsaturated and saturated fatty acids were directly associated with fatty liver status, albeit not as strongly as observed for serum triglycerides. Many small molecules in the circulation were also robustly associated with fatty liver, this being most prominent for elevated concentrations of branched‐chain and aromatic amino acids. Higher levels of the inflammatory markers glycoprotein acetyls and C‐reactive protein were also associated with fatty liver. The ORs for many of the metabolic measures quantified by NMR metabolomics were of similar magnitude or higher than those of conventional risk markers of fatty liver (Table 1).
In addition to the analyses of the binary diagnosis of fatty liver, we calculated Spearman's correlation coefficients between the categorical fatty liver score and all metabolic measures (Supporting Table S1). The correlation pattern was highly consistent with the above‐mentioned association pattern of metabolites with the dichotomous measure of fatty liver.
PROSPECTIVE ASSOCIATIONS OF METABOLIC MEASURES WITH FATTY LIVER
To examine how metabolic disturbances relate to the risk of future onset of fatty liver, we tested the 10‐year predictive associations of the metabolites which had been measured in 2001 (baseline; when the study population was aged 24‐39) with the fatty liver diagnosed in 2011. Fifty‐four individuals who showed evidence of the presence of fatty liver disease were excluded at the baseline in 2001 as their levels of alanine aminotransferase were >30 U/L. The metabolic associations with the 10‐year risk for fatty liver are shown in Fig. 2, with age‐adjusted and sex‐adjusted associations again shown in blue. In general, the prospective association pattern was very similar and only modestly weaker than the corresponding cross‐sectional associations. Aberrations in lipoprotein metabolism and fatty acid balance were predictive of the 10‐year risk for fatty liver even after adjusting for baseline waist circumference (or alternatively for BMI, Supporting Table S2), smoking, physical activity, and alcohol intake. Disturbances in the circulating concentrations of amino acids and various glycolysis precursors also preceded the onset of fatty liver. Interestingly, the ORs for many of the metabolic biomarkers from NMR profiling were as strong predictors of the 10‐year risk as observed for more established risk markers such as levels of liver enzymes and insulin resistance index.
Figure 2.
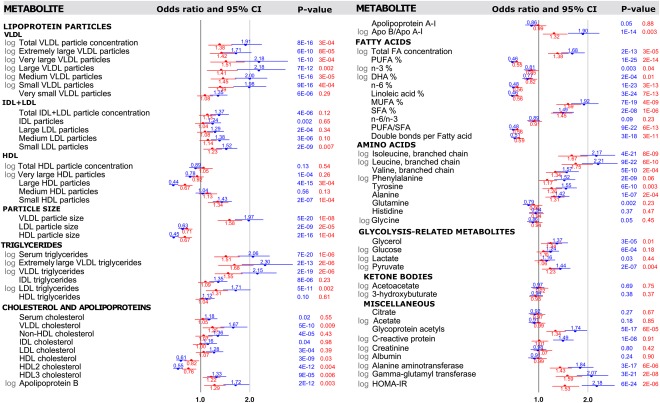
Prospective associations of metabolic measures with 10‐year risk for fatty liver (n = 1,516‐1,575 with metabolite data at the 2001 baseline, of whom 263‐275 had fatty liver diagnosed in 2011). ORs (95% confidence intervals) are per 1 standard deviation increment in the baseline metabolic measures and shown with adjustment for sex and age (blue) and additionally for baseline waist, alcohol intake, leisure‐time physical activity, and smoking (red). P values listed in exponential format denote metabolite associations that were statistically significant associations when accounting for Bonferroni correction (P < 0.0007). Individuals with suspected fatty liver in 2001 were excluded from analyses (alanine aminotransferase >30 U/L). Abbreviations: Apo, apolipoprotein; CI, confidence interval; DHA, docosahexaenoic acid; FA, fatty acid; HOMA‐IR, homeostatic model assessment of insulin resistance; IDL, intermediate‐density lipoprotein; LDL, low‐density lipoprotein; MUFA, monounsaturated fatty acid; PUFA, polyunsaturated fatty acid; SFA, saturated fatty acid.
We further validated the prospective biomarker associations with fatty liver risk based on the metabolite concentrations quantified from serum samples drawn in 2007 (n = 1,509). The ORs for the 4‐year risk of fatty liver are shown in Supporting Fig. S1. These validation analyses demonstrated highly coherent results between the metabolic association patterns for 4‐year and 10‐year risks of fatty liver. Furthermore, all results remained essentially unaltered if excluding participants suffering from psychotic disorders or cancer in 2011 (12.5% of the study population) from the analyses.
Discussion
In this large prospective study of fatty liver in young and middle‐aged adults, detailed metabolic profiling revealed a myriad of circulating biomarkers associated not only with the presence of fatty liver but also with a future risk of developing this disease. Prominent metabolic biomarkers for the risk of fatty liver were observed among lipids and lipoprotein subclasses, fatty acid composition, and numerous low–molecular weight metabolites, such as amino acids and glycolysis‐related metabolites. Many of the biomarker associations were comparable with or even stronger than those of traditional risk markers of fatty liver, such as BMI, liver enzymes, insulin resistance index, and serum triglycerides and HDL cholesterol (Table 1 and Fig. 1). The pattern of metabolic biomarkers linked with fatty liver disease was observed up to 10 years prior to the ultrasonographically detected fatty liver, suggesting that the diverse alterations in the systemic metabolism precede the onset of fatty liver in apparently healthy young adults. The prospective biomarker associations cover multiple metabolic pathways and, perhaps surprisingly, remained robust even when adjusted for routine risk markers of fatty liver. These results reveal many novel metabolic aberrations characterizing the presence of fatty liver and provide insights into the metabolic dynamics of the pathogenesis.
The overall metabolic signature of fatty liver observed in the cross‐sectional analysis was correspondingly perturbed both 4 years and 10 years preceding the clinically detected fatty liver. The detailed association pattern of metabolic biomarkers linked with the presence of fatty liver is reminiscent of the metabolic deviations caused by higher adiposity.23 However, almost all of the biomarkers for fatty liver disease remained predictive, albeit attenuated, when adjusting for waist circumference and behavioral risk factors. The strongest individual biomarkers not only for the presence of fatty liver but also for its future risk were VLDL particles and the related triglyceride concentrations. These results are in line with several reviews summarizing the most important metabolic biomarkers linked with prevalent fatty liver disease1, 7, 26 but are here extended to long‐term prospective analyses of the early manifestations of fatty liver in young and middle‐aged men and women. The findings regarding circulating triglycerides are not unexpected in view of the intrinsic role of hepatic triglyceride accumulation in the pathogenesis of fatty liver.1 Recently, increase in the mean size of VLDL particles and decrease in small VLDL particle concentration have been linked to the severity of the more advanced disease states, i.e., steatohepatitis and fibrosis.27 Nevertheless, the particularly strong associations of the very largest VLDL particles and the prospective nature of these results are novel observations. Similar to the systemic perturbations resembling those encountered in the metabolic syndrome, low large HDL particle concentration and low HDL size displayed prominent associations as biomarkers for fatty liver. In contrast, low‐density lipoprotein particle concentrations were much weaker predictors of fatty liver than the other lipoprotein measures. However, small low‐density lipoprotein particle size was strongly predictive of fatty liver, in agreement with previous reports from cross‐sectional settings in older individuals.23, 28 Overall, these findings indicate that early metabolic aberrations in the lipoprotein subclass profile seem to precede the development of fatty liver.
The composition of serum fatty acids was strongly predictive of the risk for fatty liver. For example, n‐6 fatty acids, and to a weaker extent n‐3 fatty acids, were inversely associated with the prevalence of fatty liver. These biomarker relations are similar to those observed for incident type 2 diabetes29 and cardiovascular disease.20 Similarly, an increased monounsaturated fatty acid proportion in the circulation has been associated with a higher cardiovascular risk20 and was here robustly directly associated with the risk of fatty liver disease. Coherent results on the fatty acid balance have been observed in small cross‐sectional studies comparing nonalcoholic steatohepatitis patients to healthy lean controls10 and steatosis patients with type 2 diabetes.30 The association patterns were similar in the cross‐sectional and prospective analyses, and the ORs remained robust also for the 10‐year risk of incident fatty liver. This emphasizes the long‐term predictive value of these fatty acid ratios. Furthermore, the ORs for the fatty acid measures were only modestly attenuated after covariate adjustment, suggesting that these biomarker associations may not be mediated simply by adiposity and physical inactivity. Instead, the mechanisms behind the links between fatty acids and liver fat may relate to the interplay between fatty acids and gene expression. For example, polyunsaturated fatty acids may influence liver fat accumulation because long‐chain polyunsaturated fatty acids can affect signaling molecules that inhibit lipogenesis and increase beta‐oxidation.31 Our present findings are in accordance with these putative mechanisms.
Notwithstanding the importance of lipid measures in the metabolic syndrome and their potential role in the pathogenesis of fatty liver, many biomarkers in other metabolic pathways were also strongly linked with the risk for fatty liver. Circulating levels of branched‐chain and aromatic amino acids were strongly directly associated with the presence of fatty liver as well as its future risk, confirming previous small cross‐sectional studies.32, 33, 34 Deviating levels of these amino acids have been considered to be attributable to dysfunctional mitochondrial energy metabolism, adiposity, and insulin resistance and have been associated with the risk for the development of type 2 diabetes in multiple studies.22, 23, 33, 35, 36, 37 Prospective studies have suggested that aberrations in the dispositions of branched‐chain and aromatic amino acids precede insulin resistance,35 and here we extend these findings by revealing the predictive associations with the 10‐year risk for fatty liver. In addition, the levels of glutamine have been inversely associated with insulin resistance and diabetes risk,35, 38 and here the glutamine concentration in serum was also inversely associated with the presence of fatty liver. The prospective associations of several glycolysis‐related and gluconeogenesis‐related metabolites and glycoprotein acetyls (a marker of low‐grade inflammation)39 were also reflective of the presence of and the future risk for fatty liver. These observations illustrate how multiple pathways in the systemic metabolism are perturbed prior to the development of fatty liver. The results provide a plethora of novel biological insights into the pathogenesis of fatty liver in the general population. Furthermore, the diverse metabolic perturbations observed already in young and middle‐aged adults with fatty liver disease help to clarify the role of fatty liver as a risk factor for cardiovascular disease40, 41: our results demonstrate that a diagnosis of fatty liver is accompanied by pronounced disturbances throughout the systemic metabolic profile. Using the same metabolomics platform as applied here, we have recently shown that elevated circulating levels of aromatic amino acids and monounsaturated fatty acid proportions, as well as lower n‐3 and n‐6 fatty acid levels, are predictive of a higher cardiovascular event risk on top of the well‐established risk factors.18 These molecular perturbations appear to arise before there is any clinically detectable fatty liver and are therefore likely independent of potential atherogenic effects caused directly by hepatic steatosis. The biological mechanisms underlying many of the observed biomarker associations remain elusive. Further investigations will be required to clarify the potential causal relations of these metabolic markers in the pathogenesis of fatty liver.
This study has both strengths and limitations. Fatty liver was diagnosed based on semiquantitative ultrasonography, which has limitations in terms of low sensitivity.42 The methodology was chosen for its feasibility to be applied in large population studies. We were unable to detect severe conditions beyond mild steatosis; however, the relatively young age of the asymptomatic population suggests that the prevalence of severe steatosis would be minimal.43 Coherent associations with metabolic biomarkers were obtained when analyzing fatty liver as a categorical score. The lack of ultrasound‐based fatty liver diagnosis at the 2001 survey (baseline for metabolic biomarkers) prevented formal analyses of fatty liver incidence; however, the young age group, long follow‐up, and exclusion of individuals with high baseline alanine aminotransferase are all likely indicators of the minimal prevalence of fatty liver at baseline. The lack of replication in an independent cohort is a limitation. However, the concordant results of the prospective analyses at two different time points enhance the validity of the biomarker findings. The strengths of the study include the large population‐based setting of relatively young participants with small loss to follow‐up and consistent findings from detailed metabolic profiling at three time points during the 10 years of follow‐up.
In conclusion, circulating biomarkers from multiple metabolic pathways are strongly reflective of the presence of mild steatosis in asymptomatic young adults. The metabolic biomarkers are also predictive of the risk for fatty liver 10 years prior to its diagnosis, indicating that many aberrations in the systemic metabolic profile seemingly precede the onset of overt fatty liver. These results shed new light on the multiple metabolic pathways related to fatty liver and may eventually make it possible to achieve early detection of fatty liver disease and subsequently to target preventive strategies based on the detailed metabolic profile of an individual.
Author names in bold designate shared co‐first authorship.
Supporting information
Additional Supporting Information may be found at onlinelibrary.wiley.com/doi/10.1002/hep.28899/suppinfo.
Supporting Information
Acknowledgment
We thank Irina Lisinen for excellent data management.
Potential conflict of interest: Dr. Kangas is employed by and owns stock in Brainshake Ltd. Dr. Würtz is employed by and owns stock in Brainshake Ltd. Dr. Soininen is employed by and owns stock in Brainshake Ltd.
Supported by the Academy of Finland (134309, 126925, 121584, 124282, 129378, 117797, 41071, 286284); the Social Insurance Institution of Finland; Kuopio, Tampere, and Turku University Hospital Medical Funds; Juho Vainio Foundation; Paavo Nurmi Foundation; Finnish Foundation of Cardiovascular Research; Finnish Cultural Foundation; Emil Aaltonen Foundation; and Yrjö Jahnsson Foundation. The serum NMR metabolomics platform and its development have been supported by Strategic Research Funding from the University of Oulu, the Academy of Finland (294834), the Novo Nordisk Foundation, the Sigrid Juselius Foundation, the Yrjö Jahnsson Foundation, and the Finnish Diabetes Research Foundation.
REFERENCES
- 1. Cohen JC, Horton JD, Hobbs HH. Human fatty liver disease: old questions and new insights. Science 2011;332:1519‐1523. [DOI] [PMC free article] [PubMed] [Google Scholar]
- 2. Kwak MS, Kim D, Chung GE, Kim W, Kim YJ, Yoon JH. Role of physical activity in nonalcoholic fatty liver disease in terms of visceral obesity and insulin resistance. Liver Int 2014;35:944‐952. [DOI] [PubMed] [Google Scholar]
- 3. Yasutake K, Kohjima M, Kotoh K, Nakashima M, Nakamuta M, Enjoji M. Dietary habits and behaviors associated with nonalcoholic fatty liver disease. World J Gastroenterol 2014;20:1756‐1767. [DOI] [PMC free article] [PubMed] [Google Scholar]
- 4. Lu H, Liu H, Hu F, Zou L, Luo S, Sun L. Independent association between nonalcoholic fatty liver disease and cardiovascular disease: a systematic review and meta‐analysis. Int J Endocrinol 2013;2013:124958. [DOI] [PMC free article] [PubMed] [Google Scholar]
- 5. Targher G, Day CP, Bonora E. Risk of cardiovascular disease in patients with nonalcoholic fatty liver disease. N Engl J Med 2010;363:1341‐1350. [DOI] [PubMed] [Google Scholar]
- 6. Suomela E, Oikonen M, Virtanen J, Parkkola R, Jokinen E, Laitinen T, et al. Prevalence and determinants of fatty liver in normal weight and overweight young adults. The Cardiovascular Risk in Young Finns Study. Ann Med 2015;47:40‐46. [DOI] [PubMed] [Google Scholar]
- 7. Haas JT, Francque S, Staels B. Pathophysiology and mechanisms of nonalcoholic fatty liver disease. Annu Rev Physiol 2016;78:181‐205. [DOI] [PubMed] [Google Scholar]
- 8. Kalhan SC, Guo L, Edmison J, Dasarathy S, McCullough AJ, Hanson RW, et al. Plasma metabolomic profile in nonalcoholic fatty liver disease. Metabolism 2011;60:404‐413. [DOI] [PMC free article] [PubMed] [Google Scholar]
- 9. Oresic M, Hyötyläinen T, Kotronen A, Gopalacharyulu P, Nygren H, Arola J, et al. Prediction of non‐alcoholic fatty‐liver disease and liver fat content by serum molecular lipids. Diabetologia 2013;56:2266‐2274. [DOI] [PMC free article] [PubMed] [Google Scholar]
- 10. Puri P, Wiest MM, Cheung O, Mirshahi F, Sargeant C, Min HK, et al. The plasma lipidomic signature of nonalcoholic steatohepatitis. Hepatology 2009;50:1827‐1838. [DOI] [PMC free article] [PubMed] [Google Scholar]
- 11. Männistö VT, Simonen M, Soininen P, Tiainen M, Kangas AJ, Kaminska D, et al. Lipoprotein subclass metabolism in nonalcoholic steatohepatitis. J Lipid Res 2014;55:2676‐2684. [DOI] [PMC free article] [PubMed] [Google Scholar]
- 12. Männistö VT, Simonen M, Hyysalo J, Soininen P, Kangas AJ, Kaminska D, et al. Ketone body production is differentially altered in steatosis and non‐alcoholic steatohepatitis in obese humans. Liver Int 2015;35:1853‐1861. [DOI] [PubMed] [Google Scholar]
- 13. Raitakari OT, Juonala M, Rönnemaa T, Keltikangas‐Järvinen L, Räsänen L, Pietikäinen M, et al. Cohort profile: the cardiovascular risk in Young Finns Study. Int J Epidemiol 2008;37:1220‐1226. [DOI] [PubMed] [Google Scholar]
- 14. Telama R, Yang X, Viikari J, Välimäki I, Wanne O, Raitakari O. Physical activity from childhood to adulthood: a 21‐year tracking study. Am J Prev Med 2005;28:267‐273. [DOI] [PubMed] [Google Scholar]
- 15. Juonala M, Viikari JS, Kähönen M, Laitinen T, Taittonen L, Loo BM, et al. Alcohol consumption is directly associated with carotid intima‐media thickness in Finnish young adults: the Cardiovascular Risk in Young Finns Study. Atherosclerosis 2009;204:e93‐e98. [DOI] [PubMed] [Google Scholar]
- 16. Soininen P, Kangas AJ, Würtz P, Suna T, Ala‐Korpela M. Quantitative serum nuclear magnetic resonance metabolomics in cardiovascular epidemiology and genetics. Circ Cardiovasc Genet 2015;8:192‐206. [DOI] [PubMed] [Google Scholar]
- 17. Soininen P, Kangas AJ, Würtz P, Tukiainen T, Tynkkynen T, Laatikainen R, et al. High‐throughput serum NMR metabonomics for cost‐effective holistic studies on systemic metabolism. Analyst 2009;134:1781‐1785. [DOI] [PubMed] [Google Scholar]
- 18. Würtz P, Raiko JR, Magnussen CG, Soininen P, Kangas AJ, Tynkkynen T, et al. High‐throughput quantification of circulating metabolites improves prediction of subclinical atherosclerosis. Eur Heart J 2012;33:2307‐2316. [DOI] [PubMed] [Google Scholar]
- 19. Inouye M, Kettunen J, Soininen P, Silander K, Ripatti S, Kumpula LS, et al. Metabonomic, transcriptomic, and genomic variation of a population cohort. Mol Syst Biol 2010;6:441. [DOI] [PMC free article] [PubMed] [Google Scholar]
- 20. Würtz P, Havulinna AS, Soininen P, Tynkkynen T, Prieto‐Merino D, Tillin T, et al. Metabolite profiling and cardiovascular event risk: a prospective study of 3 population‐based cohorts. Circulation 2015;131:774‐785. [DOI] [PMC free article] [PubMed] [Google Scholar]
- 21. Kettunen J, Tukiainen T, Sarin AP, Ortega‐Alonso A, Tikkanen E, Lyytikäinen LP, et al. Genome‐wide association study identifies multiple loci influencing human serum metabolite levels. Nat Genet 2012;44:269‐276. [DOI] [PMC free article] [PubMed] [Google Scholar]
- 22. Würtz P, Mäkinen VP, Soininen P, Kangas AJ, Tukiainen T, Kettunen J, et al. Metabolic signatures of insulin resistance in 7,098 young adults. Diabetes 2012;61:1372‐1380. [DOI] [PMC free article] [PubMed] [Google Scholar]
- 23. Würtz P, Wang Q, Kangas AJ, Richmond RC, Skarp J, Tiainen M, et al. Metabolic signatures of adiposity in young adults: Mendelian randomization analysis and effects of weight change. PLoS Med 2014;11:e1001765. [DOI] [PMC free article] [PubMed] [Google Scholar]
- 24. Ong JP, Pitts A, Younossi ZM. Increased overall mortality and liver‐related mortality in non‐alcoholic fatty liver disease. J Hepatol 2008;49:608‐612. [DOI] [PubMed] [Google Scholar]
- 25. Aragon G, Younossi ZM. When and how to evaluate mildly elevated liver enzymes in apparently healthy patients. Cleve Clin J Med 2010;77:195‐204. [DOI] [PubMed] [Google Scholar]
- 26. Tacer KF, Rozman D. Nonalcoholic fatty liver disease: focus on lipoprotein and lipid deregulation. J Lipids 2011;2011:783976. [DOI] [PMC free article] [PubMed] [Google Scholar]
- 27. Jiang ZG, Tapper EB, Connelly MA, Pimentel CM, Feldbrugge L, Kim M, et al. Steatohepatitis and liver fibrosis are predicted by the characteristics of very low density lipoprotein in nonalcoholic fatty liver disease. Liver Int 2016;36:1213‐1220. [DOI] [PMC free article] [PubMed] [Google Scholar]
- 28. DeFilippis AP, Blaha MJ, Martin SS, Reed RM, Jones SR, Nasir K, et al. Nonalcoholic fatty liver disease and serum lipoproteins: the Multi‐Ethnic Study of Atherosclerosis. Atherosclerosis 2013;227:429‐436. [DOI] [PMC free article] [PubMed] [Google Scholar]
- 29. Mahendran Y, Cederberg H, Vangipurapu J, Kangas AJ, Soininen P, Kuusisto J, et al. Glycerol and fatty acids in serum predict the development of hyperglycemia and type 2 diabetes in Finnish men. Diabetes Care 2013;36:3732‐3738. [DOI] [PMC free article] [PubMed] [Google Scholar]
- 30. Petit JM, Guiu B, Duvillard L, Jooste V, Brindisi MC, Athias A, et al. Increased erythrocytes n‐3 and n‐6 polyunsaturated fatty acids is significantly associated with a lower prevalence of steatosis in patients with type 2 diabetes. Clin Nutr 2012;31:520‐525. [DOI] [PubMed] [Google Scholar]
- 31. Nakamura MT, Cheon Y, Li Y, Nara TY. Mechanisms of regulation of gene expression by fatty acids. Lipids 2004;39:1077‐1083. [DOI] [PubMed] [Google Scholar]
- 32. Lake AD, Novak P, Shipkova P, Aranibar N, Robertson DG, Reily MD, et al. Branched chain amino acid metabolism profiles in progressive human nonalcoholic fatty liver disease. Amino Acids 2015;47:603‐615. [DOI] [PMC free article] [PubMed] [Google Scholar]
- 33. Sunny NE, Kalavalapalli S, Bril F, Garrett TJ, Nautiyal M, Mathew JT, et al. Cross‐talk between branched‐chain amino acids and hepatic mitochondria is compromised in nonalcoholic fatty liver disease. Am J Physiol Endocrinol Metab 2015;309:E311‐E319. [DOI] [PMC free article] [PubMed] [Google Scholar]
- 34. Cheng S, Wiklund P, Autio R, Borra R, Ojanen X, Xu L, et al. Adipose tissue dysfunction and altered systemic amino acid metabolism are associated with non‐alcoholic fatty liver disease. PLoS One 2015;10:e0138889. [DOI] [PMC free article] [PubMed] [Google Scholar]
- 35. Würtz P, Soininen P, Kangas AJ, Rönnemaa T, Lehtimäki T, Kähönen M, et al. Branched‐chain and aromatic amino acids are predictors of insulin resistance in young adults. Diabetes Care 2013;36:648‐655. [DOI] [PMC free article] [PubMed] [Google Scholar]
- 36. Stancakova A, Civelek M, Saleem NK, Soininen P, Kangas AJ, Cederberg H, et al. Hyperglycemia and a common variant of GCKR are associated with the levels of eight amino acids in 9,369 Finnish men. Diabetes 2012;61:1895‐1902. [DOI] [PMC free article] [PubMed] [Google Scholar]
- 37. Wang TJ, Larson MG, Vasan RS, Cheng S, Rhee EP, McCabe E, et al. Metabolite profiles and the risk of developing diabetes. Nat Med 2011;17:448‐453. [DOI] [PMC free article] [PubMed] [Google Scholar]
- 38. Cheng S, Rhee EP, Larson MG, Lewis GD, McCabe EL, Shen D, et al. Metabolite profiling identifies pathways associated with metabolic risk in humans. Circulation 2012;125:2222‐2231. [DOI] [PMC free article] [PubMed] [Google Scholar]
- 39. Ritchie SC, Würtz P, Nath AP, Abraham G, Havulinna AS, Fearnley LG, et al. The biomarker GlycA is associated with chronic inflammation and predicts long‐term risk of severe infection. Cell Systems 2015;1:293‐301. [DOI] [PubMed] [Google Scholar]
- 40. Bhatia LS, Curzen NP, Calder PC, Byrne CD. Non‐alcoholic fatty liver disease: a new and important cardiovascular risk factor? Eur Heart J 2012;33:1190‐1200. [DOI] [PubMed] [Google Scholar]
- 41. Rider OJ, Banerjee R, Rayner JJ, Shah R, Murthy VL, Robson MD, et al. Investigating a liver fat:arterial stiffening pathway in adult and childhood obesity. Arterioscler Thromb Vasc Biol 2016;36:198‐203. [DOI] [PubMed] [Google Scholar]
- 42. Saadeh S, Younossi ZM, Remer EM, Gramlich T, Ong JP, Hurley M, et al. The utility of radiological imaging in nonalcoholic fatty liver disease. Gastroenterology 2002;123:745‐750. [DOI] [PubMed] [Google Scholar]
- 43. Hyysalo J, Männistö VT, Zhou Y, Arola J, Karja V, Leivonen M, et al. A population‐based study on the prevalence of NASH using scores validated against liver histology. J Hepatol 2014;60:839‐846. [DOI] [PubMed] [Google Scholar]
Associated Data
This section collects any data citations, data availability statements, or supplementary materials included in this article.
Supplementary Materials
Additional Supporting Information may be found at onlinelibrary.wiley.com/doi/10.1002/hep.28899/suppinfo.
Supporting Information