

Abstract
Purpose
Cancers often have considerable induction periods. This confers a risk of reverse causation bias in studies of cancer risk associated with drug use, as early symptoms of a yet undiagnosed cancer might lead to drug treatment in the period leading up to the diagnosis. This bias can be alleviated by disregarding exposure for some time before the cancer diagnosis (lag time). We aimed at assessing the duration of lag time needed to avoid reverse causation bias.
Methods
We identified all Danish patients with incident cancer between 2000 and 2012 (n = 353 087). Incident use of prescription drugs was assessed prior to their cancer diagnosis as well as among population controls (n = 1 402 400). Analyses were conducted for all cancers and for breast, lung, colon and prostate cancer individually. Further, analyses were performed for a composite measure of all incident drug use as well as for nine pre‐specified individual drug classes, representing drug treatment likely to be prescribed for symptoms of the given cancers.
Results
The incidence rate for new drug treatment among cancer cases was stable around 130 per 1000 persons per month until 6 months prior to cancer diagnosis where it increased gradually and peaked at 434 in the month immediately preceding the cancer diagnosis. Considerable variation was observed among cancers, for example, breast cancer showed almost no such effect. The pre‐selected drug classes showed a stronger increase prior to cancer diagnoses than drugs overall.
Conclusions
Incident use of drugs increases in the months prior to a cancer diagnosis. To avoid reverse causation, 6 months' lag time would be sufficient for most drug‐cancer associations. © 2016 The Authors. Pharmacoepidemiology and Drug Safety published by John Wiley & Sons Ltd.
Keywords: cancer, epidemiology, reverse causation bias, adverse drug effects, pharmacoepidemiology
Introduction
Many cancers have considerable induction periods, and patients will therefore often have a lengthy pre‐diagnostic period.1 A yet undiagnosed cancer might cause symptoms that are misinterpreted as benign illness. For example, gastrointestinal cancers might give rise to abdominal pain, which is treated with, for example, proton pump inhibitors or laxatives, before any attempts of diagnostic work‐up are made. Further, the more frequent health care contact for the individual patient leading up to the diagnosis might in itself lead to the initiation of drug treatment, for example, the clinical work‐up might reveal a previously undiagnosed diabetic condition or hypertension, which then leads to initiation of new drug therapy. Both of these factors might be observed as an increase in new drug treatments given to patients before their cancer diagnosis.
Such a drug use pattern would have implications for pharmacoepidemiological studies of cancer risk associated with use of drugs. In these studies, onset of new drug treatment prior to diagnosis raises the possibility for reverse causation bias.2 For example, if we were to study the association between proton pump inhibitors and gastric cancer, we might find an association solely attributable to the fact that early cancer symptoms (before the diagnosis is made) are misinterpreted as acid related disorders and treated with proton‐pump inhibitors. The conventional approach to this reverse causation problem is to disregard a certain period (lag time) before the cancer diagnosis when accounting for drug exposure.3, 4 This solution is applicable both in cohort and case‐control designs. To our knowledge, however, there has been no systematic appraisal of this phenomenon.
In this study, we aimed to inform the choice of lag‐time period in studies on drug–cancer associations to avoid reverse causation bias. We did so using the Danish nationwide health registries on cancer5 and prescription drugs6 to investigate the onset of new drug treatments in the period leading up to a cancer diagnosis.
Methods
Sampling all Danish patients with incident cancer between 2000 and 2012, we assessed drug use in a 24‐month window prior to the date of cancer diagnosis. Drug use patterns among cancer cases were compared with the drug use among population controls, matched to cases by sex, age and calendar time.
Study population
Using the Danish Cancer Registry,5 we identified all incident cancer cases in Denmark between 2000 and 2012. For each cancer case, we identified four population controls, matched on sex, age and calendar time (date of the case diagnosis). For both cancer cases and the population controls, we excluded children, individuals with a prior cancer diagnosis (except non‐melanoma skin cancer) and individuals that had migrated in or out of Denmark within the last 10 years.
Drug use
Incident drug use was defined as an individual's first‐ever filling of a prescription drug according to the Danish National Prescription Registry,6 defining drugs at the level of the single substance. As the registry holds data from 1995, this ensured a minimum of 5 years prescription data when identifying new users.
For cancer cases and population controls, we assessed incident use of prescription drugs in monthly intervals relative to the date of the cancer diagnosis (or day of sampling for controls), going back 24 months. In each month, we estimated the incidence rate (IR) of drug use by—within that month—counting the number of new drug treatments and dividing by follow‐up among cancer cases (or population controls), thus calculating the IR with a unit of new treatments per person‐month.
Analysis
In an overall analysis, the IR for any new drug treatment was calculated in the 2 years preceding any cancer diagnosis and compared with that of population controls. Similar analyses were carried out specifically for the four most common cancers: lung, breast, prostate and colon cancer. Lastly, we performed the analysis on these four types of cancer for six pre‐specified drug classes, selected as drugs that could likely be prescribed for symptoms for a given cancer: drugs against overactive bladder and drugs against prostatic hyperplasia (possibly associated with a later diagnosis of prostate cancer), inhaled beta‐agonists and cough suppressants (lung cancer), and drugs against constipation or diarrhoea and proton pump inhibitors (colon cancer). No relevant drug could be identified for early symptoms of breast cancer. Furthermore, we included use of opioids, which is possibly related to all cancer diagnoses, as well as oral antidiabetics and statins, as markers for drugs that might be initiated following health care contacts. For a full list of definitions for these drugs, see Appendix A. In these analyses, we only considered individuals at risk for incident drug use, that is we disregarded those with ever‐use of the drugs in question prior to the time window of assessment.
Results
We identified 353 087 eligible cancer cases that were matched to 1 402 400 population controls. The four most common types of cancer were breast (n = 51 774), colon (n = 29 505), lung (n = 45 509) and prostate cancer (n = 41 115).
In all analyses, the pattern of incident drug use was very similar between cancer cases and populations controls in the time period of 24 to 12 months prior to cancer diagnosis. Thus, only results from the 12‐month window prior to diagnosis are presented throughout.
The overall IR for new drug treatment among all cancer cases was stable around 130 per 1000 persons per month until 6 months prior to cancer diagnosis where it increased and peaked at 434 new drug treatments per 1000 persons per month in the month immediately preceding the cancer diagnosis (Figure 1). This pattern varied considerably between the four most common cancers (Figure 2): Almost no increase was observed for breast cancer cases, while prostate, colon and lung cancer peaked at 397, 428 and 741 new drug treatments per 1000 persons per month in the month prior to cancer diagnosis, respectively. No noticeable changes were observed among the population controls.
Figure 1.
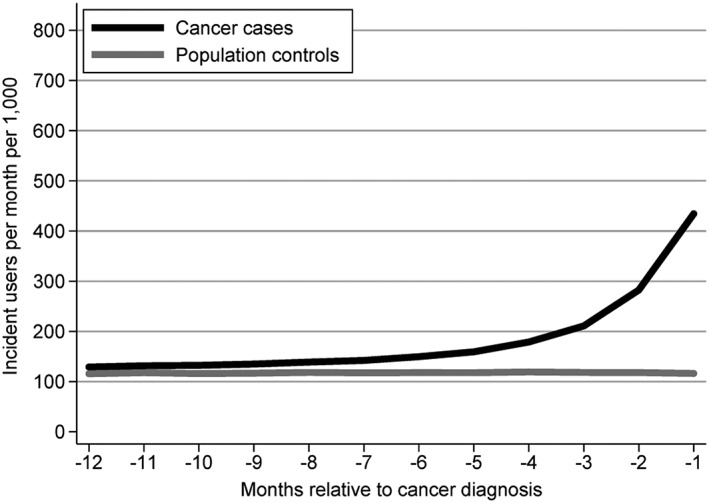
Number of new drug treatments per 1000 persons per month in a 12‐month window prior to cancer diagnosis among cancer cases and compared with the pattern among age‐ and sex‐matched population controls.
Figure 2.
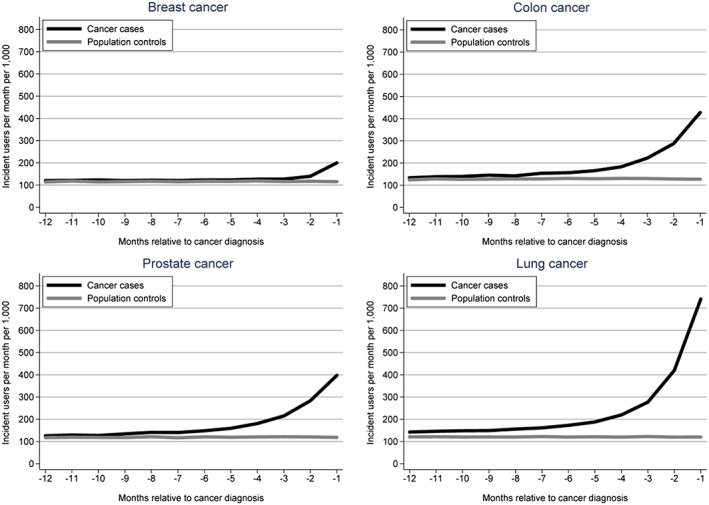
Number of new drug treatments per 1000 persons per month in a 12‐month window prior to cancer diagnosis among breast, colon, prostate and lung cancer cases, compared with the pattern among age‐ and sex‐matched population controls.
The pre‐selected site‐specific drugs all showed a noticeable increase prior to cancer diagnosis (Figure 3). New use of the three non‐specific drugs included in the analysis all showed an increase prior to cancer diagnosis, especially opioid analgesics, which increased prior to all cancers except breast cancer, most pronounced for lung cancer, increasing 15‐fold and peaking at 70 new drug treatments per 1000 per month (Figure 3).
Figure 3.
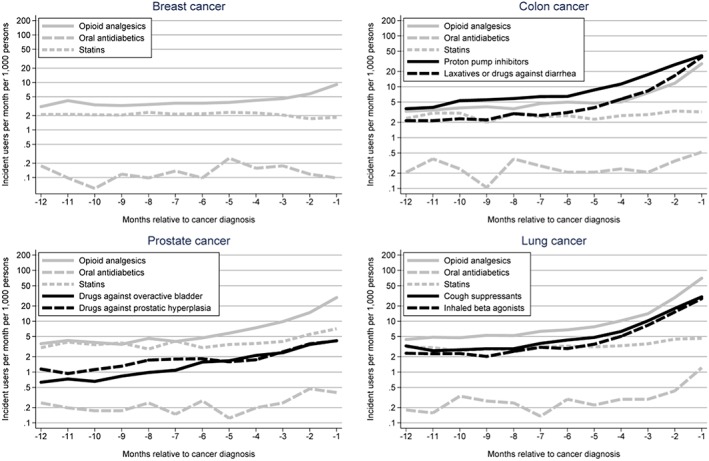
Number of new drug treatments per 1000 persons per month in a 12‐month window prior to cancer diagnosis among cancer cases for pre‐selected drug classes. Note the logarithmic Y‐axis.
In a post hoc analysis, we explored the drug classes contributing to the increased overall IR observed among cases. For the 6‐month time window prior to the cancer diagnosis, we calculated cumulative incidence proportions (risks) for incident use of individual drug classes (fourth ATC‐level, e.g. A02BC proton pump inhibitors), while restricting to those at risk, that is, never users of these drugs by the start of the time window. We reported the 20 drug classes with the largest absolute risk difference, comparing cancer cases to population controls. The results for all cancers (Table 1), showed that the increase in drug use was driven by proton pump inhibitors, analgesics and antibiotics. Similar analyses for the four most common cancers (eTable1a‐d), showed that the increased drug use was driven by therapy either specific to the individual cancer, such as laxatives prior to a colon cancer diagnosis, or related to cancer diagnoses in general (analgesics and antibiotics).
Table 1.
Analysis of the 20 individual drug classes with the largest absolute difference in the 6‐month risk of incident use comparing cases (all cancers) to population controls.
| Risk | Absolute risk difference (%) | |||
|---|---|---|---|---|
| ATC | Drug class | Cases (%) | Controls (%) | |
| A02BC | Proton pump inhibitors | 6.8 | 1.6 | 5.2 |
| J01CA | Penicillins with extended spectrum | 6.9 | 2.1 | 4.8 |
| N02AX | Other opioids | 6.0 | 1.5 | 4.4 |
| J01CE | Beta‐lactamase sensitive penicillins | 7.6 | 4.0 | 3.6 |
| J01FA | Macrolides | 4.5 | 1.7 | 2.8 |
| N02AA | Natural opium alkaloids | 3.5 | 0.9 | 2.6 |
| M01AE | Propionic acid derivatives | 5.1 | 2.5 | 2.6 |
| N02BE | Anilides | 4.0 | 1.7 | 2.3 |
| A03FA | Propulsives | 2.6 | 0.4 | 2.1 |
| N05CF | Benzodiazepine related drugs | 3.0 | 0.8 | 2.1 |
| M01AB | Acetic acid derivatives and related substances | 3.5 | 1.5 | 2.0 |
| J01MA | Fluoroquinolones | 2.4 | 0.7 | 1.7 |
| J01EB | Short‐acting sulfonamides | 2.6 | 0.9 | 1.7 |
| N05BA | Benzodiazepine derivatives | 2.3 | 0.6 | 1.7 |
| H02AB | Glucocorticoids | 2.6 | 1.0 | 1.6 |
| C03CA | Sulfonamides, plain | 2.3 | 0.9 | 1.4 |
| A12BA | Potassium | 2.1 | 0.8 | 1.3 |
| A06AD | Osmotically acting laxatives | 1.8 | 0.5 | 1.2 |
| G04CA | Alpha‐adrenoreceptor antagonists | 1.6 | 0.3 | 1.2 |
| R05DA | Opium alkaloids and derivatives | 2.0 | 0.8 | 1.2 |
Notes:
ATC = Anatomical‐Therapeutical‐Chemical
Discussion
Our study demonstrated a very clear increase in new drug use in the months preceding a cancer diagnosis. We have demonstrated both a specific and an unspecific component, the first apparently related to specific symptoms of the cancers, the second probably to unrelated conditions revealed during frequent physician contacts before the cancer diagnosis. The pattern differs between cancers. For most drug‐cancer associations, six months’ lag time appears to be sufficient to avoid substantial reverse causation.
Our study has several strengths. The Danish cancer registry has virtually complete and valid registration of all cancers in a well‐defined, stable population,5 and the prescription registry has offered complete coverage of the Danish population since 1995.6 Among the weaknesses is that we cannot account for the handling of the earliest cancer symptoms in primary care. However, we find it unlikely that GPs to any great extent would treat for example colon cancer‐related abdominal pain with proton pump inhibitors if they suspected the pain to be cancer‐related. Diagnostic process delay is unlikely to play a major role; according to Danish law, there is an expedited diagnostic work‐up if a cancer suspicion is voiced.
In general, there are two reasons to apply lag time in studies of drug–cancer associations; the problem of reverse causation as demonstrated in this paper and the fact that exposure immediately before the cancer diagnosis usually cannot be considered as contributing to the development of the cancer. By including such etiologically irrelevant exposure, true associations would be attenuated. At least for colon7 and prostate8 cancer, there is good evidence of a long latency from first cancer development to a clinically overt cancer.
The potential downside of applying lag time in a drug–cancer study relates to the concept of drugs as a cancer promotor,9 that is exposures that may mediate late critical steps in carcinogenesis. Empirically, this may appear as a relatively short interval between exposure and clinically overt cancer. If we routinely apply lag time in all analyses, we would overlook such associations. Late‐stage cancer promotion has been demonstrated for some immunomodulating drugs10 particularly in patients with organ transplant, where exposure as short as six months may trigger a clinical cancer diagnosis.11 Other good examples are, however, quite rare, especially associated with such shortness of exposure. Researchers are encouraged to explore the exposure pattern leading up to a cancer diagnosis in a given study, to inform the choice of lag‐time.
We conclude that lag time should be considered in studies of drug–cancer associations and that 6 months is usually sufficient to avoid reverse causation bias. However, sound clinical reasoning should prevail concerning the manifestations of the specific cancers.
Conflicts of Interest
The authors declare no conflict of interest.
Key Points.
Cancers that are not yet diagnosed may cause symptoms that are confused with benign diseases and treated as such.
This may result in reverse causation bias, whereby drug treatment that precedes the cancer diagnosis may be suspected of causing the cancer, while in reality it is used to treat early cancer symptoms. The bias can be alleviated by disregarding exposure for some time before the cancer diagnosis (lag time).
Reverse causation has two components; a specific one that is related to the cancer's early symptoms and an unspecific one that is related to frequent physician contact before the cancer diagnosis.
Our study demonstrated both components, the specific being the dominant.
Our data suggests that for most cancers, six months of lag time is sufficient to avoid reverse causation bias.
Supporting information
Appendix A – Definitions of drugs included in the main analysis
eTable 1a Analysis of the 20 individual drug classes with the largest absolute difference in the six‐month risk of incident use comparing breast cancer cases to population controls.
eTable 1b Analysis of the 20 individual drug classes with the largest absolute difference in the six‐month risk of incident use comparing colon cancer cases to population controls.
eTable 1c Analysis of the 20 individual drug classes with the largest absolute difference in the six‐month risk of incident use comparing prostate cancer cases to population controls.
eTable 1d Analysis of the 20 individual drug classes with the largest absolute difference in the six‐month risk of incident use comparing lung cancer cases to population controls.
Supporting info item
Acknowledgements
Laurel Habel, Mette MK Reilev and Maja Hellfritzsch are all acknowledged for valuable input to the presentation of the manuscript. Morten Olesen is acknowledged for help with data management. The work was funded by the Danish Council for Independent Research (grant 4004‐00234B).
Pottegård, A. , and Hallas, J. (2017) New use of prescription drugs prior to a cancer diagnosis. Pharmacoepidemiol Drug Saf, 26: 223–227. doi: 10.1002/pds.4145.
References
- 1. Umar A, Dunn BK, Greenwald P. Future directions in cancer prevention. Nat Rev Cancer 2012; 12: 835–848. doi:10.1038/nrc3397. [DOI] [PubMed] [Google Scholar]
- 2. Csizmadl I, Collet J‐P, Boivin J, Strom BL. (eds.). Bias and confounding in pharmacoepidemiology In Pharmacoepidemiology (4th edn). 2007. [Google Scholar]
- 3. Pottegård A, Friis S, Christensen Rd, Habel LA, Gagne JJ, Hallas J. Identification of associations between prescribed medications and cancer: a nationwide screening study. EBioMedicine 2016; 7: 73–79. doi:10.1016/j.ebiom.2016.03.018. [DOI] [PMC free article] [PubMed] [Google Scholar]
- 4. Pottegård A, Friis S, Hallas J. Cancer risk in long‐term users of vitamin K antagonists: a population‐based case‐control study. Int J Cancer J Int Cancer 2013; 132: 2606–2612. doi:10.1002/ijc.27905. [DOI] [PubMed] [Google Scholar]
- 5. Gjerstorff ML. The Danish Cancer Registry. Scand J Public Health 2011; 39: 42–45. doi:10.1177/1403494810393562. [DOI] [PubMed] [Google Scholar]
- 6. Pottegård A, Schmidt SA, Wallach‐Kildemoes H, Sørensen HT, Hallas J, Schmidt M. Data resource profile: the Danish National Prescription Registry. Int J Epidemiol 2016; pii: dyw213. [DOI] [PMC free article] [PubMed] [Google Scholar]
- 7. Hofstad B, Vatn MH, Andersen SN, et al. Growth of colorectal polyps: redetection and evaluation of unresected polyps for a period of three years. Gut 1996; 39: 449–456. [DOI] [PMC free article] [PubMed] [Google Scholar]
- 8. Schmid HP, McNeal JE, Stamey TA. Observations on the doubling time of prostate cancer. The use of serial prostate‐specific antigen in patients with untreated disease as a measure of increasing cancer volume. Cancer 1993; 71: 2031–2040. [DOI] [PubMed] [Google Scholar]
- 9. Tennant R. What is a tumor promoter? Environ Health Perspect 1999; 107: A390–A391. [DOI] [PMC free article] [PubMed] [Google Scholar]
- 10. Ingvar A, Smedby KE, Lindelöf B, et al. Immunosuppressive treatment after solid organ transplantation and risk of post‐transplant cutaneous squamous cell carcinoma. Nephrol Dial Transplant Off Publ Eur Dial Transpl Assoc ‐ Eur Ren Assoc 2010; 25: 2764–2771. doi:10.1093/ndt/gfp425. [DOI] [PubMed] [Google Scholar]
- 11. Rose J, Harms S, Wolf JM. Rapidly growing squamous‐cell carcinoma of the hand in a renal transplant recipient: a case report. J Bone Joint Surg Am 2011; 93: 199–202. doi:10.2106/JBJS.J.00337. [DOI] [PubMed] [Google Scholar]
Associated Data
This section collects any data citations, data availability statements, or supplementary materials included in this article.
Supplementary Materials
Appendix A – Definitions of drugs included in the main analysis
eTable 1a Analysis of the 20 individual drug classes with the largest absolute difference in the six‐month risk of incident use comparing breast cancer cases to population controls.
eTable 1b Analysis of the 20 individual drug classes with the largest absolute difference in the six‐month risk of incident use comparing colon cancer cases to population controls.
eTable 1c Analysis of the 20 individual drug classes with the largest absolute difference in the six‐month risk of incident use comparing prostate cancer cases to population controls.
eTable 1d Analysis of the 20 individual drug classes with the largest absolute difference in the six‐month risk of incident use comparing lung cancer cases to population controls.
Supporting info item