

Abstract
Neurons perform computations by integrating excitatory and inhibitory synaptic inputs. Yet, it is rarely understood what computation is being performed, or how much excitation or inhibition this computation requires. Here we present evidence for a neuronal computation that maximizes the signal-to-noise power ratio (SNR). We recorded from OFF delta retinal ganglion cells in the guinea pig retina and monitored synaptic currents that were evoked by visual stimulation (flashing dark spots). These synaptic currents were mediated by a decrease in an outward current from inhibitory synapses (disinhibition) combined with an increase in an inward current from excitatory synapses. We found that the SNR of combined excitatory and disinhibitory currents was voltage sensitive, peaking at membrane potentials near resting potential. At the membrane potential for maximal SNR, the amplitude of each current, either excitatory or disinhibitory, was proportional to its SNR. Such proportionate scaling is the theoretically best strategy for combining excitatory and disinhibitory currents to maximize the SNR of their combined current. Moreover, as spot size or contrast changed, the amplitudes of excitatory and disinhibitory currents also changed but remained in proportion to their SNRs, indicating a dynamic rebalancing of excitatory and inhibitory currents to maximize SNR.
SIGNIFICANCE STATEMENT We present evidence that the balance of excitatory and disinhibitory inputs to a type of retinal ganglion cell maximizes the signal-to-noise ratio power ratio (SNR) of its postsynaptic currents. This is significant because chemical synapses on a retinal ganglion cell require the probabilistic release of transmitter. Consequently, when the same visual stimulus is presented repeatedly, postsynaptic currents vary in amplitude. Thus, maximizing SNR may be a strategy for producing the most reliable signal possible given the inherent unreliability of synaptic transmission.
Keywords: bipolar cell, ganglion cell, retina, synapse
Introduction
At an isolated nerve cell terminal, vesicles fuse with the membrane and release neurotransmitter at random times (Del Castillo and Katz, 1954; Barrett and Stevens, 1972; Stevens, 1993). When a terminal is wired into a neural circuit, the statistics of release can be shaped by feedback processes, such as recurrent inhibition, voltage-gated channels, and corelease of protons, but this shaping does not eliminate randomness (DeVries, 2001; Freed et al., 2003). Accordingly, if the same signal is sent across a synapse over many trials, the signal sets the mean rate of vesicular release, but noise appears as trial-to-trial variability in this rate. This variability makes a synapse a less reliable transmitter of the original signal. Such “synaptic noise” can cascade from one level of neuronal processing to the next (Ala-Laurila et al., 2011; Freed and Liang, 2014). Therefore, at the systems level, synaptic noise may contribute to the unreliability of neuronal computations that lead to predictions, decisions, and motor control (Ernst and Banks, 2002; Gold and Shadlen, 2007; Medina and Lisberger, 2007; Fetsch et al., 2011).
Almost all neurons combine currents from multiple presynaptic terminals, and if these currents each had different amounts of signal and noise, this would suggest that currents with greater signal-to-noise ratio (SNR) should be giving greater weight. The rationale for such a strategy is illustrated in Figure 1, in which the SNR is quantified as the square of the mean current divided by its variance. Given that two currents have unequal SNR but equal amplitude, it would be a poor strategy to simply add them, because the resulting current would have a lower SNR than one of the currents. A slightly better strategy is to eliminate the current with lower SNR, thus retaining the current with higher SNR. The best strategy is to make the final amplitude of each current proportional to its SNR, which results in a combined current whose SNR is the sum of the two original SNRs. This strategy is known in the field of telecommunications as maximal-ratio combining (MRC; Brennan, 1959) where it is used, for example, to optimally combine signals from multiple antennas that have different levels of noise.
Figure 1.
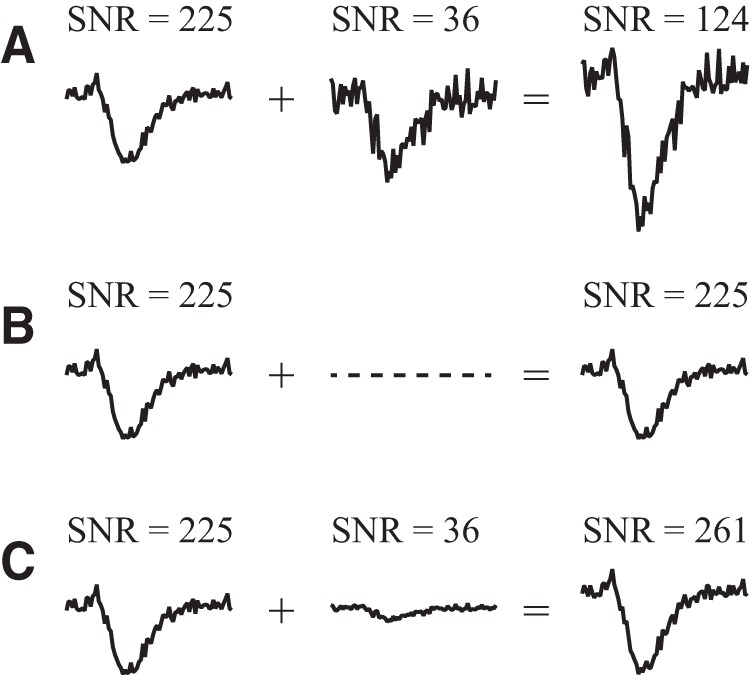
Strategy for combining synaptic currents to maximize SNR, illustrated with synthesized traces. A–C, Given two currents, one with a high SNR and another with a low SNR, there are at least three possible strategies for combining them: adding the currents in equal proportion, which reduces SNR (A); eliminating the low SNR current, which preserves SNR (B); and scaling each current in proportion to its SNR, which is the best strategy because it maximizes SNR (C).
To test for this strategy, we recorded in the whole-cell mode from ganglion cells in an in vitro preparation of the guinea pig retina. We choose the OFF delta retinal ganglion cell because it is conserved across mammals (Dacey, 1989; Rockhill et al., 2002; Manookin et al., 2010) and because it generates a burst of spikes by the combined action of two groups of synapses: excitatory synapses release transmitter at an increased rate, thereby increasing conductance to an inward current; and inhibitory synapses release transmitter at a decreased rate, thereby decreasing conductance to an outward current (disinhibition). Such combined excitation/disinhibition to trigger spikes is a common motif among neurons (“push-pull”; Belgum et al., 1987; Rudolph et al., 2007; Manookin et al., 2008; Monier et al., 2008; Piwkowska et al., 2008; Gabriel et al., 2011, 2012; Ausborn et al., 2012). In a push-pull neuron, both excitatory and inhibitory synapses provide inward currents, and if these inward currents occur concurrently, they will sum to increase signal. The OFF delta cell has such a concurrent push-pull synaptic input (Manookin et al., 2008, 2010), which suggested that it might successfully use a strategy to maximize SNR.
Materials and Methods
Electrophysiology.
All procedures conformed to National Institutes of Health guidelines for animals in research and were reviewed by the University of Pennsylvania Committee for the Care and Use of Animals. An adult male Hartley guinea pig (weight, 400–600 g; age, >8 weeks old) was anesthetized with ketamine (133 mg/kg, i.m.), xylazine (13 mg/kg, i.m.), and pentobarbital (100 mg/kg, i.p.). An eye was removed, and the animal was killed by overdose with pentobarbital (0.1 ml, i.c.). A piece of retina ∼1 cm2 in size, attached to pigment epithelium, choroid, and sclera, was taken from the dorsal visual streak, mounted in a chamber on an upright microscope, and superfused with oxygenated Ames' medium (Sigma-Aldrich).
A glass patch pipette (5–8 MΩ) was formed with a Sutter P-87 puller (Sutter Instrument). For whole-cell recordings, the pipette was filled with one of two solutions. Solution 1 contained the following (in mm): 128 CsOH, 110 gluconic acid, 6 NaCl, 3 MgCl2, 10 ascorbic acid, 2 ATP-2Na, 0.5 GTP-2Na, 1 EGTA-6Na, 10 phosphocreatine di-Tris, 0.4 Lucifer yellow-2K, and 2 QX314-Cl, pH 7.4, 288 mOsm kg−1. With this pipette solution and Ames' medium, the measured liquid junction potential was −12 mV, and the measured reversal potentials for inhibition (Einh) and excitation (Eexc) were Einh = −67.0 ± 0.4 mV and Eexc = 0.9 ± 0.8 mV (N = 8 cells). Solution 2 contained the following (in mm): 135 CsOH, 142 gluconic acid, 7 NaOH, 10 HEPES, 4 EGTA-4Na, and 7 QX314-Cl. With this pipette solution, the calculated liquid junction potential was −15 mV, and the calculated reversal potentials were Einh = −58 mV and Eexc = 4 mV (Barry, 1994). To measure reversal potentials for synaptic conductances, pipettes were filled with Ames' solution, to which was added the amino acid neurotransmitters glycine, GABA, or glutamate (100 mm). The tip of the pipette was placed near the dendrites of the cell, as confirmed by differential interference contrast (DIC) optics. To expel “puffs” of neurotransmitter, we applied pulses of positive pressure (10 ms, 5 bar; Picospritzer III, Parker-Hannifin).
Recordings were acquired with a Multiclamp 700B patch-clamp amplifier and digitized at 10 kHz (Digidata 1440A, pClamp 10, Molecular Devices; 4-pole Bessel filter, cutoff frequency = 4 kH). Access resistance (Ra) and membrane resistance (Rm) were monitored periodically during recordings with test pulses [membrane potential (Vm) = −58 mV, 10 mV, 10 ms; Ra = 13 ± 5 MΩ; Rm = 32 ± 5 MΩ]. After recording, holding voltages were corrected for the liquid junction potential and for the voltage drop across Ra. Before measuring light-evoked currents, they were boxcar filtered to 40 Hz, but filtering to higher frequencies produced the same results.
For whole-cell recording, we used a pipette holder that was designed to stabilize the junction potential between silver that is silver-chloride coated (Ag-AgCl) and pipette solution. When an Ag-AgCl electrode is newly immersed in a pipette solution that approximates the low chloride concentrations natural to neurons (5–15 mm), the junction potential between wire and solution drifts for <30 min then stabilizes (Kay, 1992; Shao and Feldman, 2007). We limited drift to 2 mV by using a pipette holder with two chambers that were filled with pipette solution and connected by a narrow polyimide tube (inner diameter, 410 μm; outer diameter, 520 μm; ALA Scientific Instruments). The first chamber held the pipette, and the second held an Ag-AgCl pellet, which was thus insulated from any changes in junction potential caused by removing and inserting the pipette.
For perforated patch recordings, gramicidin was stored as a powder at 8°C. For each recording, gramicidin powder was freshly sonicated into DMSO, which was sonicated into solution, then backfilled into the patch pipette (2 μg/ml). A gigaseal was established between the pipette and cell membrane, and the integration of gramicidin into the membrane was monitored by measuring Ra. It took 20–40 min before Ra dropped to <50 MΩ; at this point, recording began. We found that the cell maintained a stable resting potential during the course of the experiment, indicating minimal intrusion of cesium through the perforated patch. To confirm that the membrane patch was intact, we viewed the cell with epifluorescent optics to make sure that it had excluded fluorescent Lucifer yellow that was in the pipette solution. We aborted the recording if the cell stopped spiking at positive holding potentials, a sign that the pipette solution, containing the Na-channel blocker QX-314, had entered the cell and that the membrane patch was disrupted. We used a conventional one-chamber holder but relied on the junction potential between Ag/Ag-Cl and solution to stabilize by the time gramicidin was integrated into the membrane and recording had begun. Accordingly, after the recording, we removed the pipette from the cell, blew the pipette tip free of membrane, measured the voltage across the pipette, and subtracted this voltage from the membrane potential.
Compartmental modeling of retinal ganglion cells and electrophysiology of neocortical pyramidal neurons suggest that under whole-cell voltage clamp, a significant portion of the current that enters dendritic synapses is lost before it reaches the site of the pipette at the soma (Williams and Mitchell, 2008; Poleg-Polsky and Diamond, 2011). A similar amount of current loss occurs under current clamp (Williams and Mitchell, 2008). This suggests that whole-cell voltage clamp characterizes the synaptic currents that reach the soma and the site of spike initiation, the initial segment. We did not observe spikelets that are the sign of regenerative currents from dendrites (Oesch et al., 2005).
Visual stimulus.
A 1-inch-wide computer monitor with a green phosphor (Lucivid MR1–103; Microbrightfield) displayed a rectangular raster which was focused through a 4× 0.1 numerical aperture (NA) objective lens onto the retina (3 × 4 mm, 600 × 800 pixels, 60 Hz refresh rate). To increase the number of gray levels, we used an active circuit that combined two 8 bit outputs of a standard video card into a single 12 bit video signal (Pelli and Zhang, 1991; Li et al., 2003). We used the third video output to synchronize the visual stimulus and the recording. Stimuli were programmed in MATLAB (MathWorks) using procedures provided by the Psychophysics Toolbox (Brainard, 1997). The relationship between gun voltage and stimulus intensity was linearized by a lookup table. The intensity of the rectangular area, which served as the background to a flashing spot, was equivalent to 27 nW mm−2 on the retina, which, due to the overlap of stimulus and photoreceptor spectra, caused the following isomerization rates (R*): 7 × 10⁴ R* s−1 in a rod, 2 × 10⁴ R* s−1 in an M cone, and 3 × 10² R* s−1 in an S cone (λrodmax = 500 nm, λconemax = 529 nm; rod outer segment, 16.2 × 3 μm2; cone outer segment, 8 × 3 μm2; Yin et al., 2006). At these photoisomerization rates, the OFF delta cell has noncolor opponent responses that are approximately equally divided between rods and M cone signals (Yin et al., 2006). Also at these photoisomerization rates, rod signals enter ganglion cells predominantly via cones and cone bipolar cells (Manookin et al., 2008). Contrast was defined as (Intensitystimulus − Intensitybackground)/Intensitybackground (Weber contrast).
Imaging.
To visualize ganglion cells for recording, the retina with attached pigment and sclera was transilluminated with infrared (IR) light and examined with DIC optics (IR-DIC, 800–840 nm, 60× water-immersion lens, 0.9 NA). During recording, Lucifer Yellow diffused from the pipette into the cell. After recording, and often while the patch pipette was still attached, cells were photographed with a cooled CCD camera (Hamamatsu), producing a stack of optical sections (20× water-immersion lens, 0.5 NA). To measure the depth at which ganglion cell dendrites stratified in the inner plexiform layer (IPL), a stack of ∼10 optical sections was captured that combined IR-DIC images of somas at both edges of the IPL and fluorescent dendrites within the IPL. To quantify stratification, we counted the number of sections from the fluorescent dendrites to somas at either edge of the IPL. OFF alpha and OFF delta cells were identified as those with dendritic trees >250 μm in diameter that ramified in the top (outer) half of the IPL, but the OFF delta cell ramified closer to the top edge of the IPL than the OFF alpha cell (Rockhill et al., 2002; Manookin et al., 2008; Freed and Liang, 2010).
Calculating the amplitudes of excitatory and disinhibitory currents.
To calculate the amplitude of the excitatory current at Vmax where SNR peaked, we first measured the amplitude of the isolated excitatory current while clamping to Einh. At Einh, the excitatory current would be isolated because the disinhibitory current would lack electrical force and be nulled out. The excitatory current would experience a change in electrical force as the membrane potential changes from Einh to Vmax. To account for this change in electrical force, we multiplied the amplitude of the isolated excitatory current by (Eexc − Vmax)/(Eexc − Einh), which resulted in the amplitude of the excitatory current at Vmax. The amplitude of the disinhibitory current at Vmax was calculated in similar fashion: the isolated current was measured by clamping to Eexc and multiplied by (Vmax − Einh)/(Eexc − Einh).
Equations for the voltage dependence of SNR.
According to standard equations, the mean amplitude of the combined excitatory and disinhibitory currents is:
where <…> indicates averaging over stimulus repeats, and Δginh and Δgexc are stimulus-evoked changes in inhibitory and excitatory conductances, respectively (Taylor and Vaney, 2002; Manookin et al., 2008).
We modified the standard equations to produce an equation for the variance of the combined currents:
where σΔg,inh2 and σΔg,exc2 are (noise) variances of inhibitory and excitatory conductance changes, respectively. The SNR of the combined currents is the ratio of the square of its mean to its variance:
 |
When Equation 3 is substituted with Equations 1 and 2 and is graphed again as Vm, it assumes a dome-shaped function with a single maximum (Figs. 2C, 3A,B; and see Fig. 5A).
Figure 2.
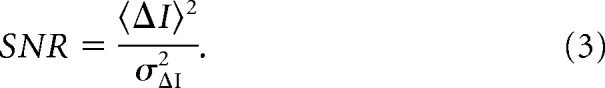
Experiments that demonstrate the voltage sensitivity of SNR. A, A retina is superfused with oxygenated medium; a patch electrode seals to a ganglion cell in whole-cell mode; a dark spot is projected onto the photoreceptor layer. B, The dark spot is flashed repeatedly, evoking synaptic currents (three repeats are shown). The evoked current ΔI is the current amplitude during the presentation of the spot minus the current amplitude before the spot. C, Signal, noise, and SNR plotted against Vm for an illustrative OFF delta ganglion cell. The colored dashed lines show the reversal potentials for disinhibitory and excitatory currents (Einh and Eexc). The data points in panels from left to right are fit with Equations 1, 2, and 3, respectively (Materials and Methods; from Eq. 3: Einh = −67 mV, Eexc = 1 mV, Δginh = −23 nS, Δgexc = 7 nS, σΔg,inh = 4 nS, σΔg,exc = 1 nS). All traces are from a spot with 150 μm radius and −100% contrast.
Figure 3.

SNR peaks in a narrow range of membrane potentials across different stimulus configurations. These experiments used pipette solution 1 with Einh = −67 mV and Eexc = 1 mV. A, SNR as a function of Vm for different spot contrasts (from bottom to top: −20%, −40%, −60%, −100%; 150 μm radius; N = 32 cells). B, SNR as a function of Vm for different spot radii (25, 50, 150, and 100 μm; −100% contrast; N = 28 cells). The largest radius (150 μm) reduces SNR because it activates the receptive field surround, antagonizing signals from the receptive field center. C, D, The membrane potentials at which maximal SNR occurs for different spot contrasts and radii. Error bars represent the SEM in this and subsequent figures. The SNRs of isolated excitatory and inhibitory currents are indicated as green and red dots at the intercepts of the curves with the vertical dashed lines that indicate the reversal potentials Einh and Eexc.
Figure 5.
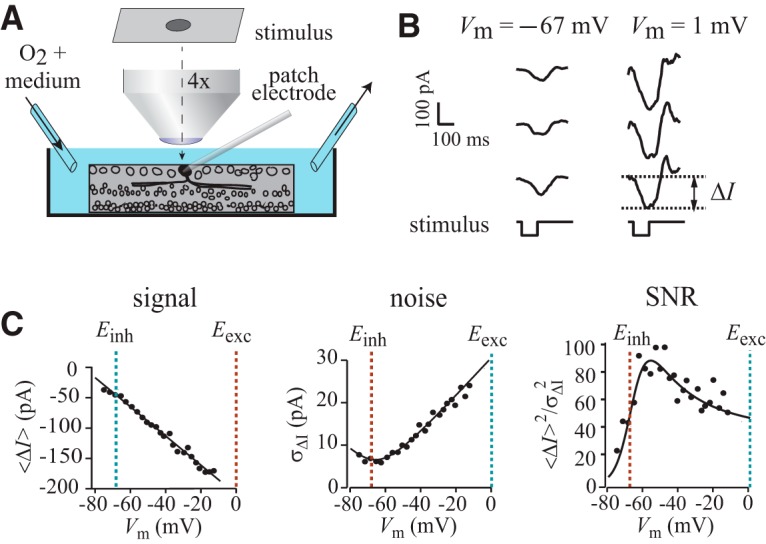
Changing pipette solution changes the membrane potential at which SNR peaks but not the balance of electrical forces on excitatory and disinhibitory conductances. A, Signal, noise, and SNR for an illustrative ganglion cell that was filled with pipette solution 2, which set Einh to −58 mV and Eexc to 4 mV. The data points in panels from left to right are fit with Equations 1, 2, and 3, respectively (Eq. 3: Einh = −56 mV, Eexc = 4 mV, Δginh = −5 nS, Δgexc = 2 nS, σΔg,inh = 0.6 nS, σΔg,exc = 0.2 nS). B, SNR as a function of Vm for pipette solutions 1 and 2 (N = 7 and 8 cells, respectively). SNR was maximal at statistically different membrane potentials for the two pipette solutions (asterisk). C, The horizontal axis shows the balance of forces on excitatory and disinhibition conductances (εinh) that produced maximum SNR. Each data point represents a cell. The balance of force for maximal SNR was similar for the two pipette solutions. All data shown here are for a dark spot of 100 μm radius and −100% contrast.
Derivation of the MRC strategy from synaptic conductances.
We found the conditions under which SNR of the combined excitatory and disinhibitory currents reaches a maximum. We started with Equation 3 and substituted Equations 1 and 2 for mean and variance. The resulting equation was simplified by writing the balance of electrical forces on excitatory and disinhibitory conductances:
 |
which is complementary to εexc = 1 − εinh. We took the simplified equation and found where its derivative with respect to εinh/(−εexc) equals zero. By this means, we found that the condition for maximal SNR
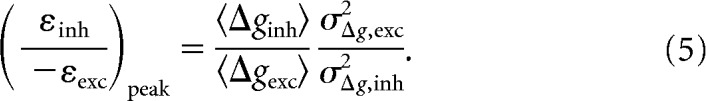 |
We took advantage of the fact that the SNR of a conductance is SNR = 〈Δg〉2/σΔg2 and substituted this into Equation 5 to get
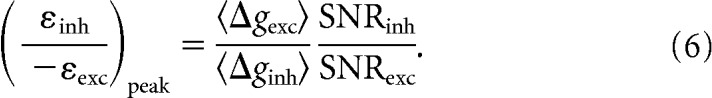 |
Next, to find the current amplitudes that maximize SNR, we made use of the fact that
 |
and rewrote Equation 6 as
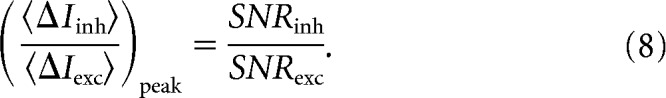 |
According to Equation 8, SNR is maximized when the excitatory and disinhibitory currents have amplitudes that are in proportion to their SNRs, which is the MRC strategy (Brennan, 1959). The MRC strategy is usually described as a weighting factor that is multiplied by each input, where the weighting factor is the signal divided by noise variance, but we measured the result of this weighting, and so we express the strategy in terms of the final amplitudes of excitatory and disinhibitory currents. To provide a tractable metric for the balance of currents that varied from 0 to 1, Equation 8 was rewritten as Equations 21 and 22 in Results.
Finally, to derive the maximal SNR for the combined currents, we substituted Equation 5 into Equation 3 to derive Equation 9:
Equation 9 is identical to the equation for maximal SNR derived from the MRC strategy (Brennan, 1959).
Equations 1 through 9 assume voltage-independent conductances and negligible noise correlations as supported experimentally. Plots of signal against membrane potential, which are equivalent to current—voltage (I–V) plots, were substantially linear, which would not occur with significant voltage-dependent conductances (Fig. 2C; also see Figs. 5A, 6B,D). Changing the pipette solution causes maximal SNR to occur at a different membrane potential and at the same balance of electrical forces (εinh; see Fig. 5), which would not occur if maximal SNR depended substantially on voltage-dependent conductances. Significant noise correlations between excitatory and disinhibitory currents would increase noise in their combined currents above the value given by Equation 2, which would decrease maximal SNR below the value predicted by Equation 9 (Cafaro and Rieke, 2010). Yet the OFF delta cell approximated the theoretically predicted value (Fig. 4C,D), which would not occur if noise correlations contributed significantly to the integration of synaptic conductances by the OFF delta cell.
Figure 6.

The resting potential of the OFF delta cell sets up electrical forces on excitatory and disinhibitory conductances that are close to those that maximize SNR. A, Puffing glycine evoked an initial current due to chloride anions (Cl−) and a delayed current due to bicarbonate anions (HCO3−; Cordero-Erausquin et al., 2005; Price et al., 2009). The initial Cl− current was measured at the time indicated by the dashed line. B, I–V plot of Cl−. The membrane potential that zeroed out the current is Einh. C, I–V plot without transmitter to determine Vrest. D, I–V plot of glutamate currents to determine Eexc. E, Summary of perforated patch results: the absolute values of Einh and Vrest varied from cell to cell (Einh = −76.0 ± 1.0 mV, N = 10; Vrest = −61.5 ± 1.2 mV, N = 10; Eexc = −0.7 ± 0.4 mV, N = 9), but the electrical forces on excitation and disinhibition depend on voltage differences, which were more consistent (symbols connected by lines). F, The horizontal axis shows the balance of electrical forces on excitatory and disinhibitory conductances (εinh).The red dots represent individual cells that were recorded in whole-cell mode and show the balance of forces that maximizes SNR (SNRmax, from Fig. 3). The blue dots represent individual cells that were recorded in perforated patch mode and show the balance set by the resting potential (Vrest, calculated from the data in E). The balance of forces that maximizes SNR is close to the balance set by the resting potential.
Figure 4.
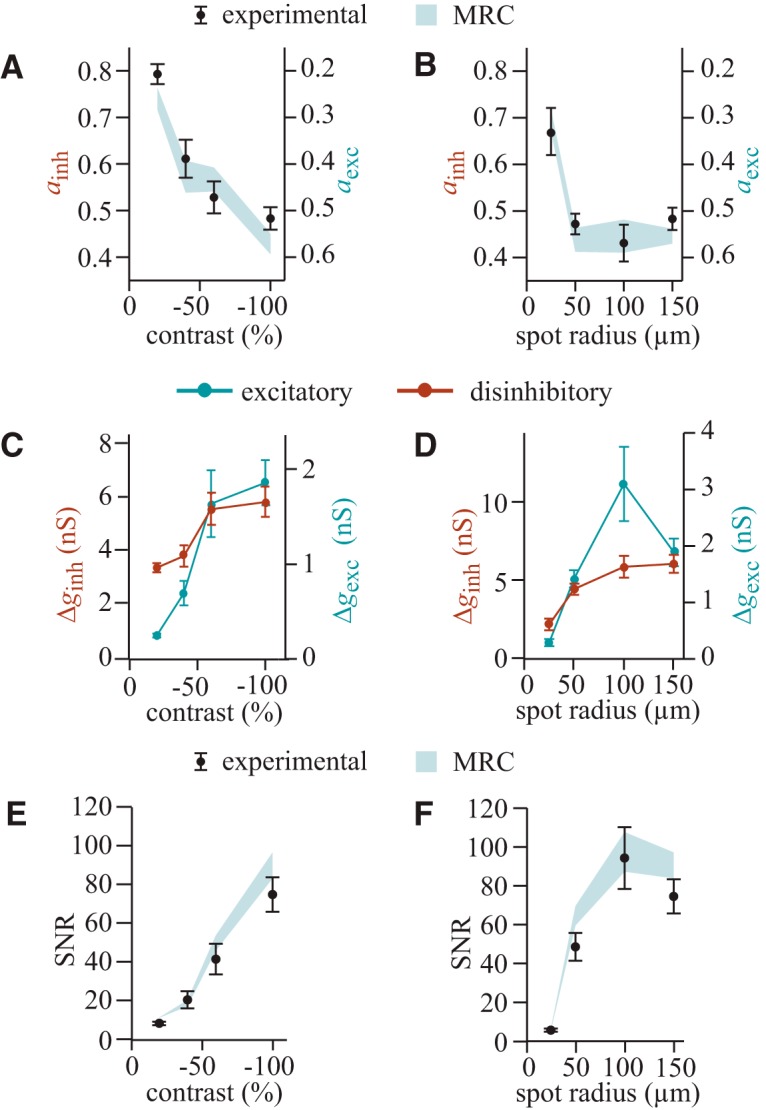
The balance of excitatory and disinhibitory currents closely approximates the MRC strategy. A, B, The amplitudes of inhibitory and excitatory currents that maximize SNR (black data points ± SEM) match the values stipulated by the MRC strategy (blue-gray areas). Here the currents are normalized to provide two complementary metrics, ainh and aexc, that vary from 0 to 1 (Eq. 21). C, D, Both the Δgexc and the Δginh change with contrast and spot radius. Note the axes for disinhibitory (left) and excitatory conductances (right) have different scaling; the disinhibitory conductance is always larger than the excitatory one. E, F, The experimental values for maximal SNR of the combined excitatory and disinhibitory currents are close to their MRC values. In all panels, the MRC values have a range because they are derived from experimental measurements that vary from cell to cell.
A functional relationship between release rates at excitatory and inhibitory synapses that maximizes SNR.
Here we derive input–output functions of excitatory and inhibitory synapses that will implement the MRC strategy. At a synapse, the release of a vesicle causes a quantal current in the postsynaptic cell, which is an instantaneous rise to maximal amplitude p followed by a slow exponential decay with time constant τ. Quanta occur at times that follow Poisson statistics, and quantal currents sum linearly to form a synaptic current (〈I〉; Freed, 2000; Freed and Liang, 2010). We can normalize the stimulus-evoked change in quantal rate as α · n, where α is the change in quantal rate caused by the stimulus and n is the baseline rate before the stimulus (see Fig. 7B,C). Therefore, the mean stimulus-evoked current is
By the standard equations for shot noise (Dodge et al., 1968; Katz and Miledi, 1972; Wong and Knight, 1980), the baseline variance of the current before the visual stimulus is
and the variance of the current during the time the visual stimulus is
Baseline variance (Eq. 11) and the variance during presentation of the stimulus (Eq. 12) sum to equal the stimulus-evoked variance, which is therefore as follows:
Equation 8 for the optimization strategy can be rewritten as
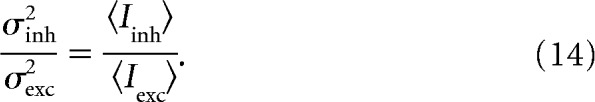 |
Equations 10 and 13, when written for excitatory and inhibitory synapses and substituted into Equation 14, give
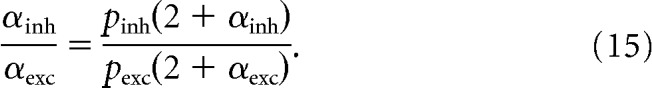 |
To simplify Equation 15, an inhibitory vesicle causes a greater conductance than an excitatory one, but at resting potential its driving force is less, with the result that inhibitory and excitatory quantal currents are of approximately equal size but of opposite polarity: pinh/pexc = −1 (Tian et al., 1998). Thus, simplifying Equation 15 and solving it for αinh gives
 |
Photoreceptors send the same signal x to OFF and ON bipolar cells, which control release at excitatory and inhibitory synapses on the OFF delta cell (see Fig. 7A). The signal at the AII amacrine cell is inverted with respect to the ON bipolar, which sets a condition on vesicular released:
Because vesicular release cannot go below zero, this implies that, for both inhibitory and excitatory synapses, α ∈ [−1, ∞]. Substituting Condition 17 into Equation 16 gives the functional equation
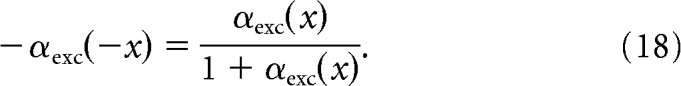 |
A solution to the functional Equation 18 is
Substituting Equation 18 back into Condition 17 gives
Therefore, the synapses will implement the optimization strategy if their quantal rates, normalized to their baseline rate, are exponential functions of the signal x in the photoreceptor, such that the functions for excitatory and inhibitory synapses are identical if they are flipped over the ordinate (see Fig. 7D).
Figure 7.

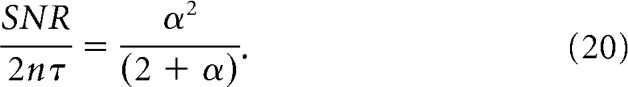
Retinal circuitry controls vesicular release at excitatory and inhibitory synapses on the OFF delta cell to maximize the SNR of their combined synaptic currents [ON bipolar cell (ON BP); OFF bipolar cell (OFF BP), AII amacrine cell (AII)]. A, The circuit that transmits signal x from photoreceptors to the OFF delta cell. The signal is transmitted along the inhibitory pathway (cone → ON BP ↔ AII → OFF delta cell, red neurons) which includes two sign-inverting synapses (⊝; ON BP ↔ AII is an electrical coupling). The same signal is transmitted through the excitatory pathway (cone → OFF BP → OFF delta cell, blue-green), which includes two sign-conserving synapses (⊕). Both excitatory and inhibitory pathways transmit noninverted versions of the signal x to the OFF delta cell. B, The transfer function of the excitatory synapse (OFF BP → OFF delta cell). A dark spot depolarizes the OFF bipolar cell (positive), which increases vesicle rate from baseline nexc by amount αexc · nexc. C, The transfer function for the inhibitory synapse (AII → OFF delta cell). A dark spot hyperpolarizes the AII amacrine cell (negative), which decreases vesicle rate from the baseline ninh by amount αinh · ninh. D, αexc and αinh are exponential functions of the same signal x and the functions are identical except for being reflected over the ordinate (Eqs. 19a and 19b; Materials and Methods). E, The gray area represents all values of SNR that could be obtained by combined excitatory and disinhibitory synaptic currents in the OFF delta cell. The combined currents in the OFF delta cell reach the maximally attainable SNR which is the sum of the SNRs of the individual excitatory and disinhibitory currents (Eq. 20; Materials and Methods).
Finally, to understand how the neural circuit presynaptic to the OFF delta cell implements the optimization strategy, we needed an equation for the SNR of a current as a function of the stimulus-evoked changes in vesicle release rate n (see Fig. 7E). From Equations 10 and 13, and because SNR = 〈I〉2/σ2, the normalized SNR of the stimulus-evoked current is
 |
Results
SNR is maximal in a narrow range of hyperpolarized membrane potentials across different stimulus configurations
While viewing the inner surface of the guinea pig retina microscopically, we selected large (15–25 μm diameter) ganglion cell somas and recorded currents in the whole-cell mode (Fig. 2A). We flashed a dark spot on a gray background that was projected onto the photoreceptor layer of the retina (radius, 50–150 μm; contrast, −20% to −100%). We selected ganglion cells that responded to the onset of the dark spot with an inward current that reversed near the Nernst potential for the chloride ion, which indicated a large disinhibitory synaptic conductance. These characteristics, combined with dendritic morphology and stratification, identified retinal ganglion cells of the OFF delta type (Materials and Methods; Liang and Freed, 2010; Manookin et al., 2010; Stafford et al., 2014). Previous studies (Manookin et al., 2010; Stafford et al., 2014) of guinea pig OFF delta cells show nonlinear I–V relationships for small dark spots of high contrast (radius, 100 μm; contrast, >25%), evidence of voltage-dependent NMDA conductances. Yet in our experiments, which used spots in a range of sizes and contrasts, the I–V relationship was linear, possibly because our experimental conditions were different, including a higher mean intensity of visual stimulation (Materials and Methods).
We tested a general prediction of the MRC strategy that the SNR of the combined inputs will vary as the amplitudes of excitatory and disinhibitory currents vary. The amplitude of a current is the product of a conductance and an electrical force established by the membrane potential. Therefore, by adjusting the membrane potential, which sets the balance of electrical forces that are applied to excitatory and disinhibitory conductances, we could adjust the balance of excitatory and inhibitory currents. We clamped the membrane potential to 20 to 40 different potentials (−80 to 0 mV; Fig. 2B). For each membrane potential, we flashed the dark spot 90 times (100 ms every 500 ms). Signal <ΔI> was calculated by subtracting the baseline current before the stimulus from the current during the stimulus and then by averaging this evoked current over stimulus repeats. Noise (σΔI) was calculated as the SD of the evoked current over stimulus repeats and SNR as the ratio 〈ΔI〉2/σΔI2. We plotted SNR against Vm and found a dome-shaped curve with single maximum, whose location, when averaged across all cells, spot sizes, and contrasts, was Vm = −53.1 ± 0.9 mV (N = 62 cells, SEM except where noted; Fig. 2C). Remarkably, different spot sizes and contrasts maximized the SNR close to the same potential (Fig. 3; see Discussion).
The amplitudes of excitatory and disinhibitory currents closely approximate the MRC strategy
We tested a specific prediction of the MRC strategy that setting the amplitude of each current in proportion to its SNR will maximize the SNR of the combined currents. To test for this, we normalized the amplitude of excitatory and disinhibitory currents to values that ranged from 0 to 1:
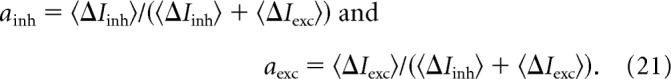 |
In this normalized form, the strategy of making each current proportional to its SNR is expressed as
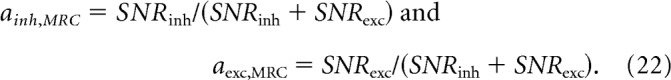 |
We calculated the amplitudes of excitatory and disinhibitory currents at the membrane potential where SNR peaked and substituted these amplitudes into Equation 21 to derive the experimental values for ainh and aexc (Materials and Methods, Calculating the amplitudes of excitatory and disinhibitory currents). We measured the SNRs of isolated excitatory and inhibitory currents that were recorded by clamping to Einh or Eexc, respectively, and substituted these SNRs into Equation 22 to derive the MRC values of ainh and aexc. The result was that, as spot contrast or radius increased, there was a consistently good match between experimental and MRC values of ainh and aexc (Fig. 4A,B). The balance of currents was not constant but changed with the stimulus: ainh was >0.5 for low contrast or radius, indicating that the disinhibitory current was larger than the excitatory current, but as contrast or radius increased, the ainh value approached 0.5, indicating that disinhibitory and excitatory currents became more similar in amplitude. A previous study of the OFF delta cell showed that the balance of disinhibitory and excitatory currents changes with contrast (Manookin et al., 2008, 2010), to which we add that this balance follows the MRC strategy.
To see whether the rebalancing of excitatory and disinhibitory currents required adjustments in synaptic conductances, we recorded isolated excitatory or disinhibitory currents while clamping at Vm = Einh or Eexc, respectively. We then divided the amplitude of the recorded currents by the electrical forces imposed by Vm to derive the light-evoked excitatory and disinhibitory conductances. The excitatory conductance was always smaller than the disinhibitory conductance (Fig. 4C,D). As spot contrast increased, both conductances increased monotonically. As spot radius increased, the excitatory conductance increased monotonically, but the disinhibitory conductance increased then decreased. Therefore, as stimulus contrast or radius changes, SNR is maximized by a variety of excitatory and disinhibitory conductance values.
The SNR of combined excitation and disinhibition approaches its theoretically maximal value
The result of implementing the MRC strategy should be a combined current whose maximum SNR is equal to the sum of the SNRs of the individual currents (Brennan, 1959):
To test for this result, we located the maximum in plots of SNR against Vm and took this as the experimental value of SNR. We measured the SNRs of isolated excitatory and inhibitory currents, respectively, then substituted into Equation 9 to calculate the MRC value of SNR. Experimental and MRC values of SNR changed with spot size and contrast, but they tracked one another closely, although sometimes the experimental value was slightly below the MRC value (Fig. 4E,F).
SNR depends on the electrical forces on excitatory and disinhibitory conductances
To explain the voltage dependence of SNR, we took standard equations for the contribution of synaptic conductances to synaptic currents and modified them to include the variance of the conductances over stimulus repeats. These equations fit signal, noise, and SNR when plotted against membrane potential (Eqs. 1, 2, and 3, respectively; Materials and Methods; Figs. 2C, 3A,B, 5A). From these equations, we determined the conditions for maximal SNR, and they were identical to the MRC strategy: when each current is in proportion to its SNR, the combined currents will reach a maximal SNR that is equal to the sum of the individual SNRs (Materials and Methods).
According to these equations, the membrane potential sets electrical forces on excitatory and disinhibitory conductances, which scales excitatory and disinhibitory currents. When we clamp to a membrane potential that scales each current in proportion to its SNR, then the SNR of the combined currents is maximized. Yet, if we were to alter the concentration of ions in our recording pipette, and thereby alter the reversal potentials Einh or Eexc, then at this same membrane potential, electrical forces would be different, and SNR no longer maximal at this same membrane potential. Instead, maximal SNR should occur at the same balance of forces on excitation and disinhibition, because this would provide the same balance of currents. Therefore, maximal SNR should depend on the balance of electrical forces, not on the membrane potential per se.
To test this prediction, we developed a metric εinh for the balance of electrical forces (Materials and Methods):
 |
For the pipette solution used in the experiments described so far (solution 1), the reversal potential for the excitatory current was Eexc = 0.9 mV, and the reversal potential for the disinhibitory current was Einh = −67 mV (Materials and Methods). For a spot of 100 μm radius and −100% contrast, SNR peaked at a membrane potential of −56 ± 1 mV (N = 7 cells) which, when entered into Equation 4, set the balance of electrical forces to εinh = 0.18 ± 0.02.
When we presented the same stimulus, but used pipette solution 2 that set up different ionic gradients and therefore different reversal potentials (Einh = −58 mV, Eexc = 4 mV), the maximal SNR was located at a distinctly different membrane potential (−45 ± 1 mV, N = 8 cells vs −56 ± 1 mV; Wilcoxon signed rank test that does not assume normal distribution, two-tailed, p = 0.00002). Yet, as predicted, maximal SNR required a similar balance of electrical forces (εinh = 0.21 ± 0.06 vs 0.18 ± 0.02; mean ± SD, p = 0.43; Fig. 5).
The balance of electrical forces on excitation and inhibition that maximizes SNR occurs close to the resting potential
We asked whether the balance of electrical forces that maximizes the SNR of postsynaptic currents is obtained at the membrane potentials over which the neuron normally operates. Membrane potential varies during visual stimulation, but potentials that trigger spikes are within 10 mV depolarized from the resting potential Vrest (Liang and Freed, 2012). Therefore, we determined the balance of electrical forces set by Vrest. To make this determination under conditions that were close to physiologically normal, we changed the mode of voltage clamping to perforated patch because this mode minimally alters ionic gradients. We projected a gray background, and measured the reversal potential of passive synaptic currents to obtain the resting potential (Vrest = −62 ± 1 mV, N = 10 cells). We puffed the neurotransmitter glutamate or glycine to obtain reversal potentials for the excitatory and disinhibitory currents, respectively (Einh = −76 ± 1 mV, N = 10 cells; Eexc = −1 ± 0.5 mV, N = 9 cells; Fig. 6A–E). Entering these measures into Equation 4 resulted in a balance of electrical forces at the resting potential of εinh = 0.19 ± 0.01. For the 62 cells recorded in whole-cell mode, we used Equation 4 to convert the membrane potential at which the SNR peaked into a balance of electrical forces, which resulted in εinh = 0.18 ± 0.01. Thus, the balance of electrical forces in perforated patch mode was close to the balance at which SNR peaked in whole-cell mode (εinh = 0.19 ± 0.01 vs 0.18 ± 0.01; Fig. 6F). This result suggests that the OFF delta ganglion cell rests near potentials that set up electrical forces that maximize SNR (Discussion).
A proposed circuit mechanism for scaling synaptic currents in proportion to their SNRs
We considered how the retinal circuitry presynaptic to a ganglion cell might implement the optimization strategy by controlling the mean release rate at both excitatory and inhibitory synapses (Fig. 7A). We represented vesicular release rate at excitatory and inhibitory synapses by mathematical functions and then derived the functional relationship between release rate at these two synapses that would maximize the SNR of the combined synaptic currents despite changes in release rate at both synapses (Materials and Methods). In this circuit, OFF and ON bipolar cells sense glutamate released by the same cone synapse, but this glutamate has opposite effects on their membrane potentials—implementing both sign-conserving and sign-inverting transmission at the same synapse. Crucial to this circuit is the AII amacrine cell, which carries “crossover” inhibition from the ON pathway to the OFF pathway (Xin and Bloomfield, 1999; Rentería et al., 2006; Liang and Freed, 2010). Due to this synaptic configuration, the same sign-conserved signal reaches the OFF delta cell through excitatory and inhibitory synapses but is conveyed by opposing transient changes in vesicular release rate.
We normalized the changes in vesicular rate so that the stimulus increases vesicular release at the excitatory synapse from a baseline rate (nexc) by the amount αexc · nexc. The stimulus decreases the rate at the inhibitory synapse from a baseline rate (ninh) by the amount αinh · ninh (Fig. 7B,C). The timing of vesicular release was based on evidence that as stimulus contrast increases, mean current increases in proportion to its variance, a signature of Poisson statistics (Freed, 2005). Given this mathematical characterization of vesicular release, we demonstrated that if SNR is to remain maximized as release rates αexc and αinh change, then αexc and αinh must have a unique functional relationship (Eq. 18 in Materials and Methods). One solution to this functional relationship is that both αexc and αinh are exponential functions of the same signal x caused by the visual stimulus, identical except for being reflected over the ordinate (Fig. 7D). Exponentials are consistent with synaptic signal processing and with the kinetics of calcium channels required for vesicular release (Llinas et al., 1981; Keen and Hudspeth, 2006). The result is that the SNR of the synaptic currents in the OFF delta cell reaches its maximum value (Fig. 7E).
The circuit described by these equations has “hard-wired” parameters, which cannot have arbitrary values but must be constrained if the functional relationship between synaptic release at excitatory and inhibitory synapses is to implement the MRC strategy. We offer our derivation as a demonstration that it is possible to harmonize the considerable amount that is known about the structure/function of this circuit with the MRC strategy. Yet, the hard-wired nature of the circuit naturally raises the question of how, if the circuit worked this way, would its parameters be “tuned up” so that they have the correct values to implement MRC. Circuit wiring could be genetically or developmentally determined. Alternatively, the circuit may not be hard wired as we described it, but instead its parameters may adapt to each stimulus configuration. For example, the circuit parameters could be adjusted through a feedback loop whose input is the variance of neuronal signals and that reduces this variance by adjusting circuit parameters. Such adaptation would require time to sample the signal and estimate variance, perhaps on the order of seconds, but to determine maximal SNR took long enough (>15 min) that it was not possible for us to assess whether the MRC strategy was implemented with a delay.
Discussion
By voltage clamping the OFF delta retinal ganglion cell in the whole-cell mode, we found that the SNR of combined excitatory and disinhibitory currents is voltage dependent. We also found that the integration of excitatory and disinhibitory currents follows the MRC strategy: the experimental balance of amplitudes (ainh) approximates the MRC-specified balance of amplitudes (Fig. 4A,B), and maximal SNR approximates its MRC value (Fig. 4C,D). We are not aware of any report where the excitatory/disinhibitory balance of a neuron is related directly to a strategy for maximizing SNR and recommend that other neurons with push-pull synaptic inputs be examined experimentally to see whether they also follow such a strategy.
To fit the voltage dependence of SNR, we took the standard equations for the contribution of synaptic conductances to synaptic currents and modified these equations to include noise (Eq. 3 in Materials and Methods). From these modified equations, we derived the MRC strategy, thereby providing an explanation of how this strategy could be implemented. According to this explanation, as the membrane depolarizes from Einh to Eexc, the electrical force on the excitatory conductance decreases and the electrical force on the inhibitory conductance increases. Eventually, as the membrane depolarizes, a balance of electrical forces is attained that sets the amplitudes of excitatory and disinhibitory currents so that they are proportional to their individual SNRs, and this balance of electrical forces maximizes the SNR of the combined excitatory and disinhibitory currents. Consistent with this explanation, keeping the stimulus the same, but changing the reversal potentials for excitation and disinhibition, alters the membrane potential at which SNR peaks, but retains the balance of electrical forces that maximizes SNR (Fig. 5). This result is expected if synaptic conductances and the balance of electrical forces determine current amplitude, not the membrane potential per se.
According to this explanation, mean excitatory and disinhibitory conductances and their SNRs are approximately constant—for a given stimulus configuration—and the resulting currents are mixed together in different proportions as the membrane potential changes to give a plot of SNR against Vm. As the stimulus changes, so do the conductances and their SNRs (Fig. 4C,D), and, accordingly, each stimulus produces a slightly different plot of SNR against Vm (Fig. 2A,B). Yet for all these plots, SNR peaks in a narrow range of membrane potentials that are approximately one-fifth of the distance between Einh and Eexc, and closer to Einh. This range of potentials sets a balance of electrical forces that is close to the balance established by the resting potential of the neuron in perforated patch mode, which suggests that the OFF delta cell, with its ionic conductances relatively intact, rests near potentials that maximize the SNR of synaptic currents. Future experiments may determine more exactly whether SNR peaks at the resting potential or, more depolarized, peaks at the spike threshold. We speculate that SNR peaking over a narrow range of potentials is an example of how different aspects of neuronal design work together and are congruent. The membrane potentials over which a ganglion cell operates is constrained to a narrow range by a complement of voltage-gated channels that, along with the time derivative of membrane potential, sets spike threshold (Fohlmeister and Miller, 1997). The resting potential must remain close enough to spike threshold that synaptic currents can modulate the firing rate. Synaptic conductances change as the stimulus changes but are restricted to values that, when subjected to the balance of electrical forces set by the membrane potential, maximize SNR.
We have shown that in the OFF delta retinal ganglion cell, excitation and disinhibition combine to increase SNR to a value that approaches the sum of their SNRs (the MRC value). Yet many neurons fire spikes when excitatory synapses release transmitter at an increased rate, increasing conductance to an inward current (excitation), and when inhibitory synapses release transmitter at an increased rate, increasing conductance to an outward current (inhibition). Inward and outward currents antagonize one another, reducing signal, but both currents contribute noise. Therefore, the combination of excitation and inhibition is most likely to decrease SNR. Indeed, in preliminary experiments, we flashed a bright spot and recorded from the ON alpha cell of the guinea pig retina, which fires spikes to excitation coupled to inhibition (Manookin et al., 2010), and found that within the operating range of voltages, SNR was reduced below its MRC value. Many neurons fire spikes to a combination of excitation and inhibition, which implies that the MRC strategy is unlikely to be ubiquitous among neurons.
The measure of SNR we used is a measure of the reproducibility of amplitude, which is not the only quality of neuronal signaling that can be measured or maximized. Indeed, neurons that fire spikes to a combination of excitation and inhibition have been shown to improve the reproducibility of timing. For example, the ON–OFF directionally selective ganglion cell of the mammalian retina has presynaptic circuitry that precisely regulates the relative timing of excitation and inhibition, and thereby increases the reliability with which a spike pattern is reproduced (Cafaro and Rieke, 2010). Thus, OFF delta and ON–OFF ganglion cells may exemplify two strategies to improve the reproducibility of signaling: excitation coupled with disinhibition to improve amplitude; and excitation coupled with inhibition to improve timing.
The MRC strategy may yet be demonstrated in neurons that, as the OFF delta cell does, couples excitation with disinhibition in a push-pull fashion to fire spikes. Examples of such neurons can be found in disparate neuronal systems: simple cells in rat primary visual cortex responding to moving gratings; directionally selective cells in fish optic tectum responding to moving bars; and motor neurons in fish spinal cord responding to swimming motor patterns (Monier et al., 2008; Gabriel et al., 2011, 2012; Ausborn et al., 2012). Even for neurons that receive complicated temporal patterns of excitation and inhibition, a momentary excitation–disinhibition can be the most effective pattern for generating spikes (Rudolph et al., 2007). Yet, to implement MRC as the OFF delta cell does, requires a presynaptic circuit ensuring that excitation and disinhibition carry the same signal and that the amplitudes of both inputs remain proportional to SNR as the stimulus changes. The retina offers a better opportunity for exploring the mechanism for MRC than most other neural systems, because its circuitry is better characterized, but similar circuits may be found in other neural systems.
Notes
Supplemental material for this article is available at http://goo.gl/yuawm7. A graph and its legend that illustrate the voltage sensitivity of SNR from synaptic currents recorded from the ON alpha retinal ganglion cell. This material has not been peer reviewed.
Footnotes
This work was supported by the National Eye Institute Grant R01-EY-013333 (to M.A.F.).
References
- Ala-Laurila P, Greschner M, Chichilnisky EJ, Rieke F (2011) Cone photoreceptor contributions to noise and correlations in the retinal output. Nat Neurosci 14:1309–1316. 10.1038/nn.2927 [DOI] [PMC free article] [PubMed] [Google Scholar]
- Ausborn J, Mahmood R, El Manira A (2012) Decoding the rules of recruitment of excitatory interneurons in the adult zebrafish locomotor network. Proc Natl Acad Sci U S A 109:E3631–E3639. 10.1073/pnas.1216256110 [DOI] [PMC free article] [PubMed] [Google Scholar]
- Barrett EF, Stevens CF (1972) Quantal independence and uniformity of presynaptic release kinetics at the frog neuromuscular junction. J Physiol 227:665–689. 10.1113/jphysiol.1972.sp010053 [DOI] [PMC free article] [PubMed] [Google Scholar]
- Barry PH. (1994) JPCalc, a software package for calculating liquid junction potential corrections in patch-clamp, intracellular, epithelial and bilayer measurements and for correcting junction potential measurements. J Neurosci Methods 51:107–116. 10.1016/0165-0270(94)90031-0 [DOI] [PubMed] [Google Scholar]
- Belgum JH, Dvorak DR, McReynolds JS, Miyachi E (1987) Push-pull effect of surround illumination on excitatory and inhibitory inputs to mudpuppy retinal ganglion cells. J Physiol 388:233–243. 10.1113/jphysiol.1987.sp016612 [DOI] [PMC free article] [PubMed] [Google Scholar]
- Brainard DH. (1997) The psychophysics toolbox. Spat Vis 10:433–436. [PubMed] [Google Scholar]
- Brennan DG. (1959) Linear diversity combining techniques. Proc IREE 47:1075–1102. 10.1109/JRPROC.1959.287136 [DOI] [Google Scholar]
- Cafaro J, Rieke F (2010) Noise correlations improve response fidelity and stimulus encoding. Nature 468:964–967. 10.1038/nature09570 [DOI] [PMC free article] [PubMed] [Google Scholar]
- Cordero-Erausquin M, Coull JA, Boudreau D, Rolland M, De Koninck Y (2005) Differential maturation of GABA action and anion reversal potential in spinal lamina I neurons: impact of chloride extrusion capacity. J Neurosci 25:9613–9623. 10.1523/JNEUROSCI.1488-05.2005 [DOI] [PMC free article] [PubMed] [Google Scholar]
- Dacey DM. (1989) Monoamine-accumulating ganglion cell type of the cat's retina. J Comp Neurol 288:59–80. 10.1002/cne.902880106 [DOI] [PubMed] [Google Scholar]
- Del Castillo J, Katz B (1954) Quantal components of the endplate potential. J Physiol 124:560–573. 10.1113/jphysiol.1954.sp005129 [DOI] [PMC free article] [PubMed] [Google Scholar]
- DeVries SH. (2001) Exocytosed protons feedback to suppress the Ca2+ current in mammalian cone photoreceptors. Neuron 32:1107–1117. 10.1016/S0896-6273(01)00535-9 [DOI] [PubMed] [Google Scholar]
- Dodge FA Jr, Knight BW, Toyoda J (1968) Voltage noise in Limulus visual cells. Science 160:88–90. 10.1126/science.160.3823.88 [DOI] [PubMed] [Google Scholar]
- Ernst MO, Banks MS (2002) Humans integrate visual and haptic information in a statistically optimal fashion. Nature 415:429–433. 10.1038/415429a [DOI] [PubMed] [Google Scholar]
- Fetsch CR, Pouget A, DeAngelis GC, Angelaki DE (2011) Neural correlates of reliability-based cue weighting during multisensory integration. Nat Neurosci 15:146–154. 10.1038/nn.2983 [DOI] [PMC free article] [PubMed] [Google Scholar]
- Fohlmeister JF, Miller RF (1997) Impulse encoding mechanisms of ganglion cells in the tiger salamander retina. J Neurophysiol 78:1935–1947. [DOI] [PubMed] [Google Scholar]
- Freed MA. (2000) Rate of quantal excitation to a retinal ganglion cell evoked by sensory input. J Neurophysiol 83:2956–2966. [DOI] [PubMed] [Google Scholar]
- Freed MA. (2005) Quantal encoding of information in a retinal ganglion cell. J Neurophysiol 94:1048–1056. 10.1152/jn.01276.2004 [DOI] [PubMed] [Google Scholar]
- Freed MA, Liang Z (2010) Reliability and frequency response of excitatory signals transmitted to different types of retinal ganglion cell. J Neurophysiol 103:1508–1517. 10.1152/jn.00871.2009 [DOI] [PMC free article] [PubMed] [Google Scholar]
- Freed MA, Liang Z (2014) Synaptic noise is an information bottleneck in the inner retina during dynamic visual stimulation. J Physiol 592:635–651. 10.1113/jphysiol.2013.265744 [DOI] [PMC free article] [PubMed] [Google Scholar]
- Freed MA, Smith RG, Sterling P (2003) Timing of quantal release from the retinal bipolar terminal is regulated by a feedback circuit. Neuron 38:89–101. 10.1016/S0896-6273(03)00166-1 [DOI] [PubMed] [Google Scholar]
- Gabriel JP, Ausborn J, Ampatzis K, Mahmood R, Eklöf-Ljunggren E, El Manira A (2011) Principles governing recruitment of motoneurons during swimming in zebrafish. Nat Neurosci 14:93–99. 10.1038/nn.2704 [DOI] [PubMed] [Google Scholar]
- Gabriel JP, Trivedi CA, Maurer CM, Ryu S, Bollmann JH (2012) Layer-specific targeting of direction-selective neurons in the zebrafish optic tectum. Neuron 76:1147–1160. 10.1016/j.neuron.2012.12.003 [DOI] [PubMed] [Google Scholar]
- Gold JI, Shadlen MN (2007) The neural basis of decision making. Annu Rev Neurosci 30:535–574. 10.1146/annurev.neuro.29.051605.113038 [DOI] [PubMed] [Google Scholar]
- Katz B, Miledi R (1972) The statistical nature of the acetycholine potential and its molecular components. J Physiol 224:665–699. 10.1113/jphysiol.1972.sp009918 [DOI] [PMC free article] [PubMed] [Google Scholar]
- Kay AR. (1992) An intracellular medium formulary. J Neurosci Methods 44:91–100. 10.1016/0165-0270(92)90002-U [DOI] [PubMed] [Google Scholar]
- Keen EC, Hudspeth AJ (2006) Transfer characteristics of the hair cell's afferent synapse. Proc Natl Acad Sci U S A 103:5537–5542. 10.1073/pnas.0601103103 [DOI] [PMC free article] [PubMed] [Google Scholar]
- Liang Z, Freed MA (2010) The On pathway rectifies the Off pathway of the mammalian retina. J Neurosci 30:5533–5543. 10.1523/JNEUROSCI.4733-09.2010 [DOI] [PMC free article] [PubMed] [Google Scholar]
- Liang Z, Freed MA (2012) Cross inhibition from ON to OFF pathway improves the efficiency of contrast encoding in the mammalian retina. J Neurophysiol 108:2679–2688. 10.1152/jn.00589.2012 [DOI] [PMC free article] [PubMed] [Google Scholar]
- Li X, Lu ZL, Xu P, Jin J, Zhou Y (2003) Generating high gray-level resolution monochrome displays with conventional computer graphics cards and color monitors. J Neurosci Methods 130:9–18. 10.1016/S0165-0270(03)00174-2 [DOI] [PubMed] [Google Scholar]
- Llinas R, Steinberg IZ, Walton K (1981) Presynaptic calcium currents in squid giant synapse. Biophys J 33:289–321. 10.1016/S0006-3495(81)84898-9 [DOI] [PMC free article] [PubMed] [Google Scholar]
- Manookin MB, Beaudoin DL, Ernst ZR, Flagel LJ, Demb JB (2008) Disinhibition combines with excitation to extend the operating range of the OFF visual pathway in daylight. J Neurosci 28:4136–4150. 10.1523/JNEUROSCI.4274-07.2008 [DOI] [PMC free article] [PubMed] [Google Scholar]
- Manookin MB, Weick M, Stafford BK, Demb JB (2010) NMDA receptor contributions to visual contrast coding. Neuron 67:280–293. 10.1016/j.neuron.2010.06.020 [DOI] [PMC free article] [PubMed] [Google Scholar]
- Medina JF, Lisberger SG (2007) Variation, signal, and noise in cerebellar sensory-motor processing for smooth-pursuit eye movements. J Neurosci 27:6832–6842. 10.1523/JNEUROSCI.1323-07.2007 [DOI] [PMC free article] [PubMed] [Google Scholar]
- Monier C, Fournier J, Frégnac Y (2008) In vitro and in vivo measures of evoked excitatory and inhibitory conductance dynamics in sensory cortices. J Neurosci Methods 169:323–365. 10.1016/j.jneumeth.2007.11.008 [DOI] [PubMed] [Google Scholar]
- Oesch N, Euler T, Taylor WR (2005) Direction-selective dendritic action potentials in rabbit retina. Neuron 47:739–750. 10.1016/j.neuron.2005.06.036 [DOI] [PubMed] [Google Scholar]
- Pelli DG, Zhang L (1991) Accurate control of contrast on microcomputer displays. Vision Res 31:1337–1350. 10.1016/0042-6989(91)90055-A [DOI] [PubMed] [Google Scholar]
- Piwkowska Z, Pospischil M, Brette R, Sliwa J, Rudolph-Lilith M, Bal T, Destexhe A (2008) Characterizing synaptic conductance fluctuations in cortical neurons and their influence on spike generation. J Neurosci Methods 169:302–322. 10.1016/j.jneumeth.2007.11.010 [DOI] [PubMed] [Google Scholar]
- Poleg-Polsky A, Diamond JS (2011) Imperfect space clamp permits electrotonic interactions between inhibitory and excitatory synaptic conductances, distorting voltage clamp recordings. PLoS One 6:e19463. 10.1371/journal.pone.0019463 [DOI] [PMC free article] [PubMed] [Google Scholar]
- Price TJ, Cervero F, Gold MS, Hammond DL, Prescott SA (2009) Chloride regulation in the pain pathway. Brain Res Rev 60:149–170. 10.1016/j.brainresrev.2008.12.015 [DOI] [PMC free article] [PubMed] [Google Scholar]
- Rentería RC, Tian N, Cang J, Nakanishi S, Stryker MP, Copenhagen DR (2006) Intrinsic ON responses of the retinal OFF pathway are suppressed by the ON pathway. J Neurosci 26:11857–11869. 10.1523/JNEUROSCI.1718-06.2006 [DOI] [PMC free article] [PubMed] [Google Scholar]
- Rockhill RL, Daly FJ, MacNeil MA, Brown SP, Masland RH (2002) The diversity of ganglion cells in a mammalian retina. J Neurosci 22:3831–3843. [DOI] [PMC free article] [PubMed] [Google Scholar]
- Rudolph M, Pospischil M, Timofeev I, Destexhe A (2007) Inhibition determines membrane potential dynamics and controls action potential generation in awake and sleeping cat cortex. J Neurosci 27:5280–5290. 10.1523/JNEUROSCI.4652-06.2007 [DOI] [PMC free article] [PubMed] [Google Scholar]
- Shao XM, Feldman JL (2007) Micro-agar salt bridge in patch-clamp electrode holder stabilizes electrode potentials. J Neurosci Methods 159:108–115. 10.1016/j.jneumeth.2006.07.001 [DOI] [PMC free article] [PubMed] [Google Scholar]
- Stafford BK, Manookin MB, Singer JH, Demb JB (2014) NMDA and AMPA receptors contribute similarly to temporal processing in mammalian retinal ganglion cells. J Physiol 592:4877–4889. 10.1113/jphysiol.2014.276543 [DOI] [PMC free article] [PubMed] [Google Scholar]
- Stevens CF. (1993) Quantal release of neurotransmitter and long-term potentiation. Cell 72:55–63. 10.1016/S0092-8674(05)80028-5 [DOI] [PubMed] [Google Scholar]
- Taylor WR, Vaney DI (2002) Diverse synaptic mechanisms generate direction selectivity in the rabbit retina. J Neurosci 22:7712–7720. [DOI] [PMC free article] [PubMed] [Google Scholar]
- Tian N, Hwang TN, Copenhagen DR (1998) Analysis of excitatory and inhibitory spontaneous synaptic activity in mouse retinal ganglion cells. J Neurophysiol 80:1327–1340. [DOI] [PubMed] [Google Scholar]
- Williams SR, Mitchell SJ (2008) Direct measurement of somatic voltage clamp errors in central neurons. Nat Neurosci 11:790–798. 10.1038/nn.2137 [DOI] [PubMed] [Google Scholar]
- Wong F, Knight BW (1980) Adapting bump model for eccentric cells ofLimulus. J Gen Physiol 76:539–557. 10.1085/jgp.76.5.539 [DOI] [PMC free article] [PubMed] [Google Scholar]
- Xin D, Bloomfield SA (1999) Comparison of the responses of AII amacrine cells in the dark- and light-adapted rabbit retina. Vis Neurosci 16:653–665. [DOI] [PubMed] [Google Scholar]
- Yin L, Smith RG, Sterling P, Brainard DH (2006) Chromatic properties of horizontal and ganglion cell responses follow a dual gradient in cone opsin expression. J Neurosci 26:12351–12361. 10.1523/JNEUROSCI.1071-06.2006 [DOI] [PMC free article] [PubMed] [Google Scholar]