

Abstract
Background
Because managed care is increasingly prevalent in health care finance and delivery, it is important to ascertain its effects on health care quality relative to that of fee-for-service plans. Some stakeholders are concerned that basing gatekeeping, provider selection, and utilization management on cost may lower quality of care. To date, research on this topic has been inconclusive, largely because of variation in research methods and covariates. Patient age has been the only consistently evaluated outcome predictor. This study provides a comprehensive assessment of the association between managed care and inpatient mortality for Medicare and privately insured patients.
Methods
A cross-sectional design was used to examine the association between managed care and inpatient mortality for four common inpatient conditions. Data from the 2009 Healthcare Cost and Utilization Project State Inpatient Databases for 11 states were linked to data from the American Hospital Association Annual Survey Database. Hospital discharges were categorized as managed care or fee for service. A phased approach to multivariate logistic modeling examined the likelihood of inpatient mortality when adjusting for individual patient and hospital characteristics and for county fixed effects.
Results
Results showed different effects of managed care for Medicare and privately insured patients. Privately insured patients in managed care had an advantage over their fee-for-service counterparts in inpatient mortality for acute myocardial infarction, stroke, pneumonia, and congestive heart failure; no such advantage was found for the Medicare managed care population. To the extent that the study showed a protective effect of privately insured managed care, it was driven by individuals aged 65 years and older, who had consistently better outcomes than their non-managed care counterparts.
Conclusions
Privately insured patients in managed care plans, especially older adults, had better outcomes than those in fee-for-service plans. Patients in Medicare managed care had outcomes similar to those in Medicare FFS. Additional research is needed to understand the role of patient selection, hospital quality, and differences among county populations in the decreased odds of inpatient mortality among patients in private managed care and to determine why this result does not hold for Medicare.
Keywords: Managed care, Inpatient mortality, Fee for service
Background
The emergence of managed care in health care finance and delivery has created a need to evaluate whether it improves or erodes health care quality compared with fee-for-service plans and to establish which factors contribute to any differences in outcomes. Some stakeholders have been concerned that implementation of gatekeeping, constraints on provider selection, and utilization management based on cost might contribute to reduced quality of care. Unfortunately, it is difficult to draw conclusions about differential outcomes in managed care versus fee-for-service plans from the literature. Direct comparisons are problematic because individual investigations vary in research methods and covariates. Additionally, effects may be masked if managed care attracts healthier patients who accept less personal control over specific provider and service choices in exchange for lower premiums.
An additional layer of contention in the managed care debate involves the health care outcomes of those insured by Medicare versus private insurance. Overall, inpatient mortality has steadily decreased over time [1–3]. One recent study of observed rates of inpatient mortality suggested that mortality may be declining more rapidly for Medicare patients compared with privately insured patients for acute myocardial infarction (AMI), stroke, pneumonia, and congestive heart failure (CHF) [3].
Research findings on the association between managed care and inpatient mortality for Medicare and privately insured patients have been mixed. Two studies that compared Medicare beneficiaries in managed care and fee-for-service settings found no differences in inpatient mortality [4, 5]. However, these studies examined patients hospitalized for only one medical condition. In a study of Medicare beneficiaries only, Afendulis and colleagues [6] found that patients in Medicare Advantage had fewer hospitalizations and lower mortality than those in traditional Medicare, but they concluded that these differences may be attributable to higher payment rates for more services. Additional studies included all payers and found that patients in managed care had lower inpatient mortality rates compared with patients in fee-for-service plans [7, 8]. However, one of these studies was limited to intensive care unit data in a single state, and the other study examined a single diagnosis-related group.
Although authors have cited results from studies with similar findings to strengthen the discussion of their own work, the research designs have not always been comparable. Studies have reported that patient characteristics such as age, sex, payer, and severity of illness influence the association between managed care and inpatient mortality [5, 7, 8]. Fewer studies have evaluated the contribution of hospital characteristics to this relationship [8]. With the exception of age, no patient or hospital predictor has been included consistently across the studies. Thus, questions remain regarding the effects of patient and hospital characteristics on the inpatient mortality of patients in managed care.
The purpose of this study was to provide a comprehensive assessment of the association between managed care and inpatient mortality among Medicare and privately insured patients with four common inpatient conditions. We made adjustments for patient characteristics, hospital characteristics, and unobserved county effects. We used recent data from a population of patients from 11 states. Further, we examined managed care within the context of Medicare and private insurance environments to determine whether expected primary payer modifies this relationship.
Methods
Data source
We used the 2009 Healthcare Cost and Utilization Project (HCUP) State Inpatient Databases (SID). HCUP is a family of health care databases developed through a voluntary federal-state-industry partnership sponsored by the Agency for Healthcare Research and Quality. The SID include a census of hospitals for states with a summary record for each discharge, regardless of payer. This analysis included inpatient discharges for both Medicare and privately insured patients aged 18 years and older from nonfederal, community, nonrehabilitation hospitals. Patients who were transferred out to another acute care hospital were excluded from the analysis, whereas patients who were transferred in to the hospital were included. Eleven states reported expected primary payer categories that distinguished between managed care and non-managed care plans: Arizona, California, Connecticut, Massachusetts, Michigan, Minnesota, Nevada, New Hampshire, New York, Ohio, and Pennsylvania. These states captured 36% of total adult (18 years and older) U.S. discharges and 38% of the adult U.S. population in 2009. We linked SID data to the American Hospital Association (AHA) Annual Survey Database to identify hospital characteristics. The HCUP databases are consistent with the definition of limited data sets under the Health Insurance Portability and Accountability Act (HIPAA) Privacy Rule and contain no direct patient identifiers. The use of HCUP data is not considered human subjects research by the Agency for Healthcare Research and Quality institutional review board.
Data categorization
We categorized each discharge as managed care or fee-for-service on the basis of the expected primary payer coding. Six of the 11 states reported categories coded as health maintenance organization (HMO); the other states reported either a managed care category or an HMO and managed care category. For the purpose of this study, we categorized discharges coded as HMO, managed care, or HMO and managed care by states as managed care. This broad term reflects the heterogeneity in reporting among states. We categorized as fee-for-service all discharges not explicitly identified in the state data as managed care as defined above. We further stratified managed care categories by Medicare and private insurance to discern any modifying effects of these distinctive groups.
Outcome measures
Inpatient mortality
The primary outcome for this analysis was in-hospital mortality for four high-volume conditions: AMI, stroke, pneumonia, and CHF. We selected these conditions because of their prevalence among hospital discharges, which boosts statistical power to detect small differences. The mortality outcome for the regressions was defined dichotomously—whether a patient died in the hospital (Yes or No) based on the discharge disposition.
Patient and hospital characteristics
We linked patient data elements from the SID to hospital elements from the AHA database to describe the study population and to evaluate the characteristics as covariates or modifiers in the regression model. Patient characteristics included age, sex, All Patient Refined Diagnosis-Related Group (APR-DRG) and the associated risk of mortality subclass, and median household income of the patient’s residential ZIP Code (in quartiles). Consistent with other studies of inpatient mortality [9], we included this variable as the best available proxy of the patient’s income and purchasing choices. Hospital characteristics included the number of hospital beds, teaching status, ownership, and urban/rural location. We classified urban/rural locations of hospitals on the basis of the scheme for U.S. counties developed for the National Center for Health Statistics (NCHS) [10]. We excluded managed care penetration as a covariate in the analysis on the basis of findings of previous studies that ruled out its role as a predictor of the outcome of interest [7].
Hospital fixed effects
To better understand the impact of unobservable hospital-level factors related to quality of care, we examined hospital fixed effects as covariates in a separate model including patient characteristics and county fixed effects. We included dummy variables for individual hospitals visited by patients.
Geographic fixed effects
We also examined county fixed effects as covariates. Dowd and colleagues [11] found that estimated overall mortality differences between managed care and fee-for-service patients were sensitive to geographic fixed effects. Although we did not expect inpatient mortality to be strongly affected by county characteristics (as would be expected with rates of population mortality that may be driven by underlying county-level characteristics, such as availability of resources), we included dummy variables for the county locations of the patients’ residences. These inclusions controlled for other “unobservable” factors that could not be measured directly.
Data analyses
We used SAS (SAS Institute, Inc; Cary, NC) statistical software Version 9.2 to perform statistical analyses. We identified patients treated for AMI, stroke, pneumonia, and CHF on the basis of specifications of the denominator in corresponding Inpatient Quality Indicators (IQIs) [12]. The IQIs are measures of inpatient quality endorsed by the National Quality Forum that use readily available administrative data. We then used multivariate logistic modeling to examine the likelihood of dying in the hospital, adjusting for patient, hospital, and county factors. For each condition, we performed separate logistic regressions for Medicare and private insurance.
We used a phased approach to examine the contributions of patient and hospital characteristics to the relationship between managed care status and inpatient mortality. We began with an unadjusted model of the association between managed care status and mortality. In subsequent models, we added patient characteristics followed by patient characteristics plus hospital characteristics. We then ran separate models that included individual patient characteristics plus hospital fixed effects to adjust for unobservable hospital characteristics. Lastly, we ran models that included patient characteristics, hospital characteristics, and county fixed effects. Several of the models with either hospital fixed effects or county fixed effects did not converge. Detailed tables with the results of full multivariate models are included in the Appendix.
Sensitivity analysis
Our categorization of managed care is based on codes used by statewide data organizations, and these codes are not consistently defined. This variation in coding could create some bias. In our groupings of managed care versus fee-for-service, we assumed that a limited number of categories encompassed managed care on the basis of the labeling provided by states. It is possible that some managed care groups were included as fee-for-service and vice versa. Although we used the most stringent classification approach available, some of this bias is unavoidable because of the nature of the data and collection methods. Consequently, a lack of distinction between these groups could dilute any potential differences between individuals in managed care versus fee-for-service. We address this limitation in a sensitivity analysis of fewer states with more stringently defined HMO categories.
Results
Demographic characteristics
Table 1 contains the demographic characteristics of patients with AMI, stroke, pneumonia, and CHF in all plan types and the facilities from which they were discharged. Compared with Medicare patients in non-managed care, patients in Medicare managed care were slightly older, resided in higher median income ZIP Code areas, and were more likely to have been discharged from hospitals in large central metropolitan areas, teaching hospitals, and hospitals with 300 or more beds. The Medicare managed care population also was less likely than their non-managed care counterparts to have congestive heart failure, chronic pulmonary disease, diabetes with complications, and depression.
Table 1.
Demographic and hospital characteristics of populations in Medicare and private insurance, 2009
| Characteristica,b | Medicare managed care (n = 168,700) | Medicare fee for service (n = 562,610) | Private managed care (n = 84,170) | Private fee for service (n = 115,244) | ||||||
|---|---|---|---|---|---|---|---|---|---|---|
| Mean, % | SE | Mean, % | SE | p | Mean, % | SE | Mean, % | SE | p | |
| Age in years, mean | 78.04 | 0.02 | 77.43 | 0.02 | * | 57.98 | 0.05 | 57.96 | 0.04 | |
| Sex, % | ||||||||||
| Female | 52.33 | 0.12 | 53.51 | 0.07 | * | 41.39 | 0.17 | 39.78 | 0.15 | * |
| Median household income by ZIP Code, % | ||||||||||
| Lowest (<$39,999) | 22.61 | 0.10 | 22.70 | 0.06 | 18.30 | 0.13 | 19.06 | 0.12 | * | |
| Low ($40,000-$49,999) | 24.10 | 0.10 | 26.42 | 0.06 | * | 21.93 | 0.14 | 26.58 | 0.13 | * |
| Moderate ($50,000-$65,999) | 26.41 | 0.11 | 26.03 | 0.06 | * | 28.20 | 0.16 | 27.08 | 0.13 | * |
| High (>$66,000) | 26.88 | 0.11 | 24.85 | 0.06 | * | 31.56 | 0.16 | 27.28 | 0.13 | * |
| Comorbidities | ||||||||||
| Congestive heart failure | 10.82 | 0.08 | 11.89 | 0.04 | * | 5.19 | 0.08 | 4.90 | 0.06 | * |
| Chronic pulmonary disease | 32.14 | 0.11 | 34.52 | 0.06 | * | 24.07 | 0.15 | 24.89 | 0.13 | * |
| Hypertension | 70.49 | 0.11 | 67.61 | 0.06 | * | 59.03 | 0.17 | 56.11 | 0.15 | * |
| Peripheral vascular disease | 11.44 | 0.08 | 10.18 | 0.04 | * | 6.00 | 0.08 | 5.64 | 0.07 | * |
| Diabetes with chronic complications | 25.99 | 0.11 | 28.17 | 0.06 | * | 23.20 | 0.15 | 23.67 | 0.13 | * |
| Diabetes without chronic complications | 10.21 | 0.07 | 7.17 | 0.03 | * | 7.89 | 0.09 | 5.15 | 0.07 | * |
| Hypothyroidism | 15.40 | 0.09 | 15.80 | 0.05 | * | 8.52 | 0.10 | 8.82 | 0.08 | * |
| Renal failure | 27.76 | 0.11 | 27.78 | 0.06 | 14.44 | 0.12 | 12.28 | 0.10 | * | |
| Fluid and electrolyte disorders | 24.49 | 0.11 | 27.87 | 0.06 | * | 21.71 | 0.14 | 22.30 | 0.12 | * |
| Obesity | 8.07 | 0.07 | 8.10 | 0.04 | 15.61 | 0.13 | 14.20 | 0.10 | * | |
| Deficiency anemias | 23.24 | 0.10 | 24.99 | 0.06 | * | 16.52 | 0.13 | 14.09 | 0.10 | * |
| Depression | 8.01 | 0.07 | 9.49 | 0.04 | * | 8.40 | 0.10 | 8.51 | 0.08 | |
| Hospital location, % | ||||||||||
| Large central metropolitan | 53.77 | 0.12 | 37.87 | 0.07 | * | 57.58 | 0.17 | 36.78 | 0.14 | * |
| Large fringe metropolitan | 19.88 | 0.10 | 19.34 | 0.05 | * | 17.90 | 0.13 | 20.44 | 0.12 | * |
| Medium metropolitan | 18.47 | 0.10 | 23.81 | 0.06 | * | 18.34 | 0.13 | 25.83 | 0.13 | * |
| Small metropolitan | 3.15 | 0.04 | 6.96 | 0.03 | * | 1.97 | 0.05 | 6.46 | 0.07 | * |
| Micropolitan | 3.78 | 0.05 | 9.42 | 0.04 | * | 3.14 | 0.06 | 8.67 | 0.08 | * |
| Not metropolitan or micropolitan | 0.95 | 0.02 | 2.60 | 0.02 | * | 1.08 | 0.04 | 1.82 | 0.04 | * |
| Hospital ownership, % | ||||||||||
| Government | 6.13 | 0.06 | 7.25 | 0.03 | * | 5.85 | 0.08 | 7.05 | 0.08 | * |
| Private, not-for-profit | 87.55 | 0.08 | 86.07 | 0.05 | * | 86.26 | 0.12 | 87.93 | 0.10 | * |
| Private, for-profit | 6.32 | 0.06 | 6.68 | 0.03 | * | 7.89 | 0.09 | 5.01 | 0.06 | * |
| Hospital teaching, % | ||||||||||
| Teaching | 46.25 | 0.12 | 37.35 | 0.07 | * | 46.47 | 0.17 | 43.48 | 0.15 | * |
| Number of hospital beds, % | ||||||||||
| < 100 | 6.58 | 0.06 | 11.76 | 0.04 | * | 6.33 | 0.08 | 8.79 | 0.08 | * |
| 100-299 | 37.97 | 0.12 | 38.75 | 0.07 | * | 35.44 | 0.17 | 36.18 | 0.14 | * |
| 300-499 | 32.91 | 0.12 | 28.28 | 0.06 | * | 33.13 | 0.16 | 28.69 | 0.13 | * |
| 500+ | 22.54 | 0.10 | 21.21 | 0.05 | * | 25.10 | 0.15 | 26.34 | 0.13 | * |
Abbreviation: SE, standard error
aPatient characteristics were age, sex, community income, and All Patient Refined-Diagnosis Related Group (APR-DRG)
bHospital characteristics were urban/rural location, ownership, teaching status, and bed size
*p < 0.05
Source: Agency for Healthcare Research and Quality, Center for Delivery, Organization, and Markets, Healthcare Cost and Utilization Project, State Inpatient Databases, 2009, from the following 11 states: Arizona, California, Connecticut, Massachusetts, Michigan, Minnesota, New Hampshire, Nevada, New York, Ohio, and Pennsylvania
Patients in private managed care were similar in age to their counterparts in non-managed care, but the private managed care group had a greater percentage of women and individuals residing in ZIP Codes with median household incomes greater than $50,000. In addition, compared with their non-managed care counterparts, a greater percentage of patients in private managed care were discharged from hospitals in large central metropolitan areas, private for-profit hospitals, teaching hospitals, and hospitals with 300 to 499 beds.
Observed rates of inpatient mortality by insurance type
Figure 1 displays observed rates of inpatient mortality for each of the four conditions of interest by insurance type. Compared with private insurance, patients with Medicare had higher rates of inpatient mortality for all four conditions. For AMI, the Medicare inpatient mortality rate was nearly three times that of the privately insured—the largest difference in rates across conditions.
Fig. 1.
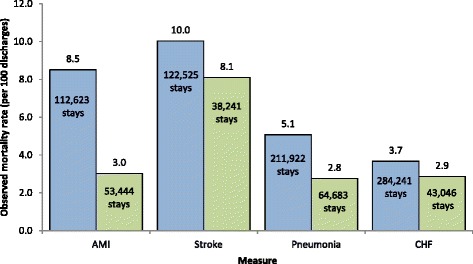
Observed inpatient mortality rates for AMI, stroke, pneumonia, and CHF for patients in Medicare and private insurance, 2009. Legend: Blue bars indicate Medicare patients; green bars indicate private insured patients. Abbreviations: AMI, acute myocardial infarction; CHF, congestive heart failure. Source: Agency for Healthcare Research and Quality, Center for Delivery, Organization, and Markets, Healthcare Cost and Utilization Project, State Inpatient Databases, 2009, from the following 11 states: Arizona, California, Connecticut, Massachusetts, Michigan, Minnesota, New Hampshire, Nevada, New York, Ohio, and Pennsylvania
Controlling for patient, hospital, and county characteristics
Table 2 shows results from models of inpatient mortality for patients with Medicare and private insurance, comparing managed care with fee-for-service plans. Although patients in Medicare managed care plans had lower odds of inpatient death for stroke and CHF in models controlling for patient characteristics, these differences disappeared when hospital characteristics or hospital fixed effects were added to the model, and they remained insignificant when county fixed effects were added (Table 2).
Table 2.
Inpatient mortality for patients with Medicare and private insurance, comparing managed care to fee-for-service plans, 2009
| Measure | Sample size for managed care and FFS | Patient characteristicsa | Patient + hospital characteristicsb | Patient characteristics + hospital fixed effects | Patient + hospital characteristics + county fixed effects | ||||||||
|---|---|---|---|---|---|---|---|---|---|---|---|---|---|
| OR | 95% CI | Differencec | OR | 95% CI | Differencec | OR | 95% CI | Differencec | OR | 95% CI | Differencec | ||
| Medicare managed care vs. Medicare FFS | |||||||||||||
| AMI | 112,623 | 0.97 | 0.92, 1.02 | 0.98 | 0.93, 1.04 | 0.98 | 0.92, 1.04 | 0.98 | 0.93, 1.04 | ||||
| Stroke | 122,525 | 0.93 | 0.89, 0.98 | ↓ | 0.98 | 0.93, 1.03 | 0.97 | 0.91, 1.03 | 0.98 | 0.93, 1.03 | |||
| Pneumonia | 211,921 | 1.03 | 0.98, 1.09 | 1.07 | 1.02, 1.13 | ↑ | 0.99 | 0.93, 1.05 | 1.05 | 0.99, 1.11 | |||
| CHF | 284,241 | 0.95 | 0.90, 0.99 | ↓ | 0.98 | 0.93, 1.03 | <did not converge> | 0.95 | 0.90, 1.00 | ||||
| Private managed care vs. private FFS | |||||||||||||
| AMI | 53,444 | 0.87 | 0.77, 0.97 | ↓ | 0.88 | 0.78, 0.98 | ↓ | <did not converge> | 0.86 | 0.76, 0.98 | ↓ | ||
| Stroke | 38,241 | 0.76 | 0.69, 0.83 | ↓ | 0.80 | 0.73, 0.87 | ↓ | 0.84 | 0.75, 0.94 | ↓ | 0.79 | 0.71, 0.87 | ↓ |
| Pneumonia | 64,683 | 0.90 | 0.82, 1.00 | 0.89 | 0.80, 0.99 | ↓ | 0.83 | 0.72, 0.95 | ↓ | 0.88 | 0.78, 0.98 | ↓ | |
| CHF | 43,046 | 0.62 | 0.55, 0.70 | ↓ | 0.64 | 0.57, 0.73 | ↓ | <did not converge> | <did not converge> | ||||
Abbreviations: AMI, acute myocardial infarction; CHF, congestive heart failure; CI, confidence interval; FFS, fee for service; OR, odds ratio
aPatient characteristics were age, sex, All Patient Refined-Diagnosis Related Group (APR-DRG), and community income
bHospital characteristics were bed size, ownership, teaching status, and urban/rural location
cA down arrow indicates the mortality rate for managed care is significantly lower than FFS at p < 0.05. An up arrow indicates the mortality rate for managed care is significantly higher than FFS at p < 0.05
Source: Agency for Healthcare Research and Quality, Center for Delivery, Organization, and Markets, Healthcare Cost and Utilization Project, State Inpatient Databases, 2009, from the following 11 states: Arizona, California, Connecticut, Massachusetts, Michigan, Minnesota, New Hampshire, Nevada, New York, Ohio, and Pennsylvania
Among privately insured patients, the association between managed care and inpatient mortality was consistently negative and typically statistically significant across conditions. Patients in private managed care plans had lower odds of inpatient mortality for all four conditions when controlling for patient and hospital characteristics. Managed care was particularly protective among patients with private insurance and CHF (36% lower odds of mortality) or stroke (20% lower odds of mortality). The addition of county fixed effects to the models strengthened the managed care effects for AMI, stroke, and pneumonia.
To assess potential modifying effects of age among the privately insured, we ran additional logistic models for individuals younger than 65 years and for those 65 years and older (Table 3).
Table 3.
Inpatient mortality for patients with private insurance, comparing managed care to fee-for-service plans, by patient age, 2009
| Measure | Sample size for managed care and FFS | Patient characteristicsa | Patient + hospital characteristicsb | Patient characteristics + hospital fixed effects | Patient + hospital characteristics + county fixed effects | ||||||||
|---|---|---|---|---|---|---|---|---|---|---|---|---|---|
| OR | 95% CI | Differencec | OR | 95% CI | Differencec | OR | 95% CI | Differencec | OR | 95% CI | Differencec | ||
| Private managed care vs. private FFS, age <65 years | |||||||||||||
| AMI | 44,580 | 0.91 | 0.78, 1.05 | 0.91 | 0.79, 1.06 | 0.89 | 0.75, 1.06 | 0.89 | 0.75, 1.05 | ||||
| Stroke | 28,713 | 0.87 | 0.77, 0.97 | ↓ | 0.90 | 0.80, 1.01 | 0.89 | 0.78, 1.01 | 0.87 | 0.77, 0.99 | ↓ | ||
| Pneumonia | 51,636 | 1.05 | 0.92, 1.20 | 1.02 | 0.90, 1.17 | 1.00 | 0.85, 1.17 | 1.01 | 0.88, 1.17 | ||||
| CHF | 26,980 | 0.84 | 0.69, 1.03 | 0.81 | 0.66, 0.99 | ↓ | 0.83 | 0.66, 1.04 | 0.75 | 0.60, 0.94 | ↓ | ||
| Private managed care vs. private FFS, age ≥65 years | |||||||||||||
| AMI | 8,864 | 0.80 | 0.67, 0.95 | ↓ | 0.82 | 0.69, 0.98 | ↓ | <did not converge> | <did not converge> | ||||
| Stroke | 9,528 | 0.64 | 0.55, 0.73 | ↓ | 0.70 | 0.60, 0.81 | ↓ | <did not converge> | <did not converge> | ||||
| Pneumonia | 13,047 | 0.73 | 0.62, 0.86 | ↓ | 0.73 | 0.62, 0.86 | ↓ | <did not converge> | <did not converge> | ||||
| CHF | 16,066 | 0.52 | 0.45, 0.61 | ↓ | 0.56 | 0.47, 0.66 | ↓ | <did not converge> | <did not converge> | ||||
Abbreviations: AMI, acute myocardial infarction; CHF, congestive heart failure; CI, confidence interval; FFS, fee for service; OR, odds ratio
aPatient characteristics were age, sex, All Patient Refined-Diagnosis Related Group (APR-DRG), and community income
bHospital characteristics were bed size, ownership, teaching status, and urban/rural location
cA down arrow indicates the mortality rate for managed care is significantly lower than FFS at p < 0.05. An up arrow indicates the mortality rate for managed care is significantly higher than FFS at p < 0.05
Source: Agency for Healthcare Research and Quality, Center for Delivery, Organization, and Markets, Healthcare Cost and Utilization Project, State Inpatient Databases, 2009, from the following 11 states: Arizona, California, Connecticut, Massachusetts, Michigan, Minnesota, New Hampshire, Nevada, New York, Ohio, and Pennsylvania
In the privately insured population aged 65 years and older, managed care was negatively associated with inpatient mortality for all four conditions when controlling for patient and hospital characteristics. The models including either hospital fixed effects or county fixed effects failed to converge, likely because of the small sample size of the group aged 65 years and older relative to the large number of possible hospitals and counties represented. Patients who were privately insured and younger than 65 years demonstrated inconsistent results across conditions. There were no differences in inpatient mortality for younger patients with AMI or pneumonia in private managed care and fee-for-service plans, but outcomes favored managed care for stroke and CHF when controlling for patient characteristics, hospital characteristics, and county fixed effects.
To assess how a stricter definition would affect our findings, we performed a sensitivity analysis using three states (California, New York, and Pennsylvania) with managed care defined by primary payer categories that were explicitly named HMO (Table 4). Compared with the main analysis, this sensitivity analysis has much smaller sample sizes and less geographic diversity.
Table 4.
Inpatient mortality for patients with Medicare and private insurance, comparing managed care to fee-for-service plans using a stringent definition of health maintenance organization, 2009
| Measure | Sample size for managed care and FFS | Patient characteristicsa | Patient + hospital characteristicsb | Patient characteristics + hospital fixed effects | Patient + hospital characteristics + county fixed effects | ||||||||
|---|---|---|---|---|---|---|---|---|---|---|---|---|---|
| OR | 95% CI | Differencec | OR | 95% CI | Differencec | OR | 95% CI | Differencec | OR | 95% CI | Differencec | ||
| Medicare managed care vs. Medicare FFS | |||||||||||||
| AMI | 61,159 | 0.97 | 0.91, 1.04 | 0.98 | 0.91, 1.04 | 1.01 | 0.94, 1.09 | 1.00 | 0.94, 1.08 | ||||
| Stroke | 69,803 | 0.91 | 0.86, 0.97 | ↓ | 0.96 | 0.90, 1.03 | 0.99 | 0.92, 1.06 | 0.98 | 0.92, 1.05 | |||
| Pneumonia | 114,515 | 0.99 | 0.94, 1.06 | 1.03 | 0.97, 1.09 | 0.99 | 0.92, 1.06 | 1.05 | 0.98, 1.12 | ||||
| CHF | 157,794 | 0.90 | 0.84, 0.95 | ↓ | 0.91 | 0.86, 0.97 | ↓ | <did not converge> | 0.93 | 0.87, 0.99 | ↓ | ||
| Private managed care vs. private FFS | |||||||||||||
| AMI | 27,577 | 0.86 | 0.74, 1.00 | 0.88 | 0.75, 1.02 | <did not converge> | 0.88 | 0.74, 1.05 | |||||
| Stroke | 21,510 | 0.87 | 0.78, 0.98 | ↓ | 0.88 | 0.78, 0.98 | ↓ | 1.02 | 0.88, 1.18 | 0.93 | 0.82, 1.07 | ||
| Pneumonia | 33,573 | 0.95 | 0.83, 1.08 | 0.92 | 0.80, 1.05 | 0.96 | 0.80, 1.14 | 0.93 | 0.80, 1.08 | ||||
| CHF | 22,926 | 0.66 | 0.56, 0.78 | ↓ | 0.67 | 0.56, 0.79 | ↓ | <did not converge> | <did not converge> | ||||
Abbreviations: AMI, acute myocardial infarction; CHF, congestive heart failure; CI, confidence interval; FFS, fee for service; OR, odds ratio
aPatient characteristics were age, sex, All Patient Refined-Diagnosis Related Group (APR-DRG), and community income
bHospital characteristics were bed size, ownership, teaching status, and urban/rural location
cA down arrow indicates the mortality rate for managed care is significantly lower than FFS at p < 0.05. An up arrow indicates the mortality rate for managed care is significantly higher than FFS at p < 0.05
Source: Agency for Healthcare Research and Quality, Center for Delivery, Organization, and Markets, Healthcare Cost and Utilization Project, State Inpatient Databases, 2009, from the following 3 states: California, New York, and Pennsylvania
We found similar results favoring managed care among privately insured patients with stroke and CHF when controlling for patient and hospital characteristics, but there were no differences in outcomes between patients with AMI and pneumonia in managed care versus fee-for-service plans. Patients with Medicare managed care had lower odds of inpatient mortality for CHF than did patients with Medicare fee-for-service plans.
Discussion
For Medicare beneficiaries, outcomes differed by condition, particularly when hospital characteristics were taken into account. These results confirm those of Carlisle and colleagues [4] and Smith and colleagues [5], who also found that Medicare managed care was not related to AMI and stroke mortality outcomes. Moreover, the phased approach of this analysis revealed the unique contributions of hospital characteristics to mortality outcomes among patients in Medicare managed care. For example, although there were no differences in the outcomes of patients with pneumonia in managed care and fee-for-service Medicare when controlling for patient characteristics, a closer look at the detailed hospital model (Appendix Table 9) revealed that Medicare patients with pneumonia who were admitted to specific types of hospitals—those that were government-owned, had smaller bed sizes, and were in nonmetropolitan areas—demonstrated higher odds of mortality than similar patients admitted to larger, urban, privately owned hospitals. A previous study revealed that the Medicare Advantage population was treated more often in facilities with lower resource cost and higher risk-adjusted mortality relative to patients in fee-for-service plans [13]. Limited resources associated with hospitals in smaller geographic areas [14] may affect health care quality and outcomes for patients with pneumonia in Medicare who are treated in these types of facilities.
Among privately insured patients, those in managed care demonstrated lower rates of inpatient mortality for all four conditions after adjusting for other patient and hospital characteristics. Older age and the severity of the patient’s condition are powerful predictors of inpatient mortality, but they do not explain why managed care is associated with lower odds of inpatient mortality in this population. Despite the adjustments for patient characteristics and clinical factors (including APR-DRG severity of disease and associated risk of mortality subclass), the privately insured managed care population had lower odds of inpatient mortality. Interestingly, patients in privately insured managed care plans also demonstrated higher rates of certain common comorbidities (i.e., CHF, diabetes without chronic complications, renal failure, and obesity) than their fee-for-service counterparts. Similar to the experience of Medicare patients, hospital characteristics were strong predictors of inpatient mortality among privately insured patients. Whether patients in privately insured managed care plans systematically visit better quality hospitals than their fee-for-service counterparts is a topic worthy of future study. Furthermore, the study of the interactions between managed care and hospital characteristics as predictors could illuminate the mechanism through which managed care influences inpatient mortality.
An additional contribution of this work is the detailed examination of mortality outcomes among patients with private managed care; previous studies have focused on Medicare [4, 5]. We found that the privately insured population aged 65 years and older drove favorable managed care outcomes across the conditions studied. Although the sample sizes precluded our analysis of county fixed effects for this group, patients aged 65 years and older in managed care demonstrated lower rates of inpatient mortality compared with their fee-for-service counterparts for all four conditions. The protective effect of managed care was stronger for patients aged 65 years and older with private insurance than for their younger counterparts. There was no such age effect for Medicare outcomes when comparing beneficiaries aged 65 years and older to those younger than 65 years (data not shown). One explanation could be that privately insured individuals aged 65 years and older often are still employed or may have more wealth than those for whom Medicare is the primary payer. Either of these factors could be associated with better baseline health status, which could confound the likelihood of death from any of these conditions. Our data indicate that a higher share of patients in private managed care than in Medicare managed care were in the higher income quartiles. However, counter to this possible explanation, Appendix Tables 5–12 show that income was not a statistically significant contributor among models in this study. Therefore, additional investigation is needed to understand the potentially protective effect of managed care in the private sector for those aged 65 years and older, and the interpretation of these findings should be treated cautiously.
Variations in outcomes between patients in Medicare and private managed care relative to their fee-for-service counterparts bring into question differences in managed care experiences by payer. Are patients who are in private managed care treated in better hospitals than patients in Medicare managed care? Our limited descriptive information regarding hospitals from which these two groups were discharged showed similar distributions with regard to ownership, teaching status, and bed size. However, these characteristics do not fully capture the quality of care delivered. Selective contracting with hospitals, or the practice of contracting with certain providers to ensure quality or to contain costs, has previously been studied as influencing managed care and patient outcomes. This practice is not likely to be the primary driver of differences between the outcomes of privately insured managed care and fee-for-service populations [15]. However, the ways in which selective contracting or other managed care mechanisms might favor private insurance over Medicare are not known. Analysis of hospital fixed effects using an indicator for each hospital demonstrated results similar to the models that controlled for individual hospital factors. Future research should continue to explore the quality of care delivered at hospitals chosen by patients in private managed care and those to which they are referred, especially for individuals aged 65 years and older. In addition, future studies should explore the association of managed care status with outcomes by severity class of condition to discern whether there is an insurance effect.
The findings of this study should be interpreted within the context of a few limitations. First, the cross-sectional approach of this study prohibited investigators from capturing the full episode of care preceding the inpatient admission. The lack of data on past medical history limits the risk adjustment for clinical factors included in the models to conditions reported on the current discharge record only. Therefore, we cannot discern whether inpatient death was more related to the current discharge or some previous care. Second, the HCUP SID only include information on in-hospital mortality. Therefore, post-discharge deaths are not included, leading to an underestimation of overall mortality for these conditions.
Conclusions
We used hospital administrative data to examine the association between managed care and inpatient mortality, controlling for patient and hospital characteristics and county fixed effects. Although patients in private managed care had lower rates of inpatient mortality for AMI, stroke, pneumonia, and CHF compared with fee-for-service beneficiaries with hospitalizations for these conditions, patients in Medicare managed care did not experience decreased odds of mortality relative to their fee-for-service counterparts once hospital factors were controlled. Furthermore, although the advantage among patients in private managed care remained after controlling for patient and hospital characteristics as well as county fixed effects of the patient’s residence, the private managed care population aged 65 years and older drove the findings of protective effects of managed care with respect to inpatient mortality. Results of the hospital fixed effects models suggest that other unmeasured hospital factors may play a role in predicting inpatient mortality. Could the location of hospitals and availability of community resources drive these results across privately insured and Medicare patients under managed care? More research is needed to understand the relative roles of patient selection, hospital quality, and differences among county populations in decreased odds of inpatient mortality among patients in private managed care and the absence of that result among patients covered by Medicare.
Acknowledgements
The authors would like to acknowledge Rosanna Coffey, PhD, and Linda Lee, PhD, for editorial review. The authors also acknowledge the data contributions of the following organizations: Arizona Department of Health Services, California Office of Statewide Health Planning and Development, Connecticut Hospital Association, Massachusetts Center for Health Information and Analysis, Michigan Health & Hospital Association, Minnesota Hospital Association, New Hampshire Department of Health & Human Services, Nevada Department of Health and Human Services, New York State Department of Health, Ohio Hospital Association, and Pennsylvania Health Care Cost Containment Council.
Funding
This study was funded by the Agency for Healthcare Research and Quality (AHRQ) under a contract with Truven Health Analytics to develop and support the Healthcare Cost and Utilization Project (HCUP) (Contract No. HHSA-290-2013-00002-C). The views expressed in this article are those of the authors and do not necessarily reflect those of the Agency for Healthcare Research and Quality, the National Center for Health Statistics, or the U.S. Department of Health and Human Services.
Availability of data and materials
HCUP State Inpatient Databases (SID) are publicly available for purchase. See the HCUP User Support Web site (http://www.hcup-us.ahrq.gov/sidoverview.jsp) for an overview of the SID. Information on purchasing data is available at http://www.hcup-us.ahrq.gov/tech_assist/centdist.jsp.
Authors’ contributions
Conception and design of the study: AH, SR, MB, EM, RA. Data analysis and interpretation of findings: AH, SR, MB, EM, RA. Draft manuscript: AH. Critical review and revision of manuscript: SR, MB, EM, RA. All authors read and approved the final manuscript.
Competing interests
The authors declare that they have no competing interests.
Consent for publication
Not applicable.
Ethics approval and consent to participate
The HCUP databases are consistent with the definition of limited data sets under the Health Insurance Portability and Accountability Act Privacy Rule and contain no direct patient identifiers. The Agency for Healthcare Research and Quality Institutional Review Board considers research using HCUP data to have exempt status.
Abbreviations
- AHA
American Hospital Association
- AMI
Acute myocardial infarction
- APR-DRG
All Patient Refined Diagnosis-Related Group
- CHF
Congestive heart failure
- HCUP
Healthcare Cost and Utilization Project
- HMO
Health maintenance organization
- IQI
Inpatient Quality Indicator
- SID
State Inpatient Databases
Appendix
Table 5.
Association between Medicare managed care and inpatient mortality for acute myocardial infarction
| Characteristic | Patient characteristicsa | Patient + hospital characteristicsb | Patient characteristic + hospital fixed effects | Patient + hospital characteristics + county fixed effects | ||||||||
|---|---|---|---|---|---|---|---|---|---|---|---|---|
| Point estimate | 95% Wald confidence limits | Point estimate | 95% Wald confidence limits | Point estimate | 95% Wald confidence limits | Point estimate | 95% Wald confidence limits | |||||
| Managed care | 0.969 | 0.919 | 1.021 | 0.982 | 0.931 | 1.036 | 0.979 | 0.922 | 1.039 | 0.983 | 0.929 | 1.040 |
| Age 18–64 years | 1.012 | 0.908 | 1.129 | 1.018 | 0.913 | 1.135 | 1.030 | 0.922 | 1.151 | 1.025 | 0.918 | 1.145 |
| Age 65–74 years (REF) | REF | REF | REF | REF | REF | REF | REF | REF | REF | REF | REF | REF |
| Age 75–84 years | 1.198 | 1.125 | 1.276 | 1.196 | 1.123 | 1.273 | 1.194 | 1.120 | 1.272 | 1.190 | 1.117 | 1.268 |
| Age 85+ years | 1.362 | 1.276 | 1.453 | 1.352 | 1.267 | 1.444 | 1.354 | 1.266 | 1.447 | 1.339 | 1.253 | 1.431 |
| Male | REF | REF | REF | REF | REF | REF | REF | REF | REF | REF | REF | REF |
| Female | 0.959 | 0.916 | 1.003 | 0.958 | 0.916 | 1.003 | 0.957 | 0.914 | 1.002 | 0.963 | 0.920 | 1.008 |
| APRMORT_165002 | 0.332 | 0.144 | 0.768 | 0.339 | 0.147 | 0.783 | 0.343 | 0.148 | 0.793 | 0.334 | 0.144 | 0.771 |
| APRMORT_165003 | 1.673 | 1.004 | 2.787 | 1.706 | 1.024 | 2.843 | 1.795 | 1.076 | 2.994 | 1.721 | 1.032 | 2.869 |
| APRMORT_165004 | 16.335 | 10.790 | 24.728 | 16.742 | 11.058 | 25.347 | 18.402 | 12.135 | 27.905 | 17.412 | 11.487 | 26.392 |
| APRMORT_174001 | 0.251 | 0.145 | 0.433 | 0.255 | 0.147 | 0.440 | 0.258 | 0.149 | 0.445 | 0.254 | 0.147 | 0.438 |
| APRMORT_174002 | 0.823 | 0.532 | 1.274 | 0.837 | 0.541 | 1.295 | 0.862 | 0.557 | 1.335 | 0.838 | 0.541 | 1.297 |
| APRMORT_174003 | 3.123 | 2.060 | 4.733 | 3.179 | 2.097 | 4.818 | 3.347 | 2.206 | 5.077 | 3.278 | 2.161 | 4.971 |
| APRMORT_174004 | 33.770 | 22.759 | 50.108 | 34.426 | 23.199 | 51.087 | 38.038 | 25.605 | 56.509 | 36.594 | 24.639 | 54.349 |
| APRMORT_190002 | 3.350 | 2.231 | 5.031 | 3.333 | 2.219 | 5.005 | 3.328 | 2.215 | 5.000 | 3.355 | 2.233 | 5.040 |
| APRMORT_190003 | 8.975 | 6.061 | 13.290 | 8.898 | 6.009 | 13.177 | 9.044 | 6.103 | 13.401 | 9.090 | 6.135 | 13.468 |
| APRMORT_190004 | 41.875 | 28.301 | 61.960 | 42.068 | 28.430 | 62.247 | 45.052 | 30.424 | 66.714 | 44.977 | 30.376 | 66.596 |
| APRMORT_OTHER | 12.857 | 8.627 | 19.162 | 13.113 | 8.797 | 19.545 | 13.865 | 9.292 | 20.689 | 13.436 | 9.008 | 20.041 |
| Lowest income | 1.021 | 0.956 | 1.089 | 1.003 | 0.937 | 1.073 | 0.991 | 0.913 | 1.075 | 1.010 | 0.928 | 1.099 |
| Low income | 1.049 | 0.986 | 1.115 | 1.031 | 0.967 | 1.100 | 1.037 | 0.961 | 1.119 | 1.060 | 0.980 | 1.146 |
| Moderate income | 0.997 | 0.938 | 1.061 | 0.998 | 0.938 | 1.062 | 0.982 | 0.915 | 1.054 | 0.997 | 0.929 | 1.069 |
| High income | REF | REF | REF | REF | REF | REF | REF | REF | REF | REF | REF | REF |
| 0-99 beds | 1.168 | 1.062 | 1.284 | 1.185 | 1.067 | 1.315 | ||||||
| 100-299 beds | REF | REF | REF | REF | REF | REF | ||||||
| 300-499 beds | 1.009 | 0.952 | 1.070 | 1.019 | 0.953 | 1.090 | ||||||
| 500+ beds | 1.029 | 0.954 | 1.109 | 1.066 | 0.979 | 1.160 | ||||||
| Nonteaching | REF | REF | REF | REF | REF | REF | ||||||
| Teaching | 0.931 | 0.878 | 0.988 | 0.908 | 0.846 | 0.975 | ||||||
| Governmental | 1.279 | 1.173 | 1.396 | 1.207 | 1.094 | 1.332 | ||||||
| Not-for-profit | REF | REF | REF | REF | REF | REF | ||||||
| For-profit | 0.995 | 0.908 | 1.092 | 0.971 | 0.873 | 1.081 | ||||||
| Large metropolitan | REF | REF | REF | |||||||||
| Medium and small metropolitan | 0.993 | 0.944 | 1.046 | |||||||||
| Nonmetropolitan | 1.104 | 1.008 | 1.209 | |||||||||
Abbreviation: REF, reference group
Notes: aPatient characteristics were age, sex, All Patient Refined-Diagnosis Related Group (APR-DRG), and community income. bHospital characteristics were bed size, ownership, teaching status, and urban/rural location
Source: Agency for Healthcare Research and Quality, Center for Delivery, Organization, and Markets, Healthcare Cost and Utilization Project, State Inpatient Databases, 2009, from the following 11 states: Arizona, California, Connecticut, Massachusetts, Michigan, Minnesota, New Hampshire, Nevada, New York, Ohio, and Pennsylvania
Table 6.
Association between private managed care and inpatient mortality for acute myocardial infarction
| Characteristic | Patient characteristicsa | Patient + hospital characteristicsb | Patient characteristic + hospital fixed effects | Patient + hospital characteristics + county fixed effects | |||||||
|---|---|---|---|---|---|---|---|---|---|---|---|
| Point estimate | 95% Wald confidence limits | Point estimate | 95% Wald confidence limits | Point estimate | 95% Wald confidence limits | Point estimate | 95% Wald confidence limits | ||||
| Managed care | 0.865 | 0.774 | 0.967 | 0.875 | 0.781 | 0.980 | Failed to converge | 0.861 | 0.758 | 0.979 | |
| Age 18–44 years | 0.759 | 0.577 | 0.999 | 0.749 | 0.569 | 0.987 | 0.778 | 0.584 | 1.036 | ||
| Age 45–64 years | REF | REF | REF | REF | REF | REF | REF | REF | REF | ||
| Age 65+ years | 1.199 | 1.064 | 1.352 | 1.177 | 1.043 | 1.33 | 1.151 | 1.01 | 1.31 | ||
| Male | REF | REF | REF | REF | REF | REF | REF | REF | REF | ||
| Female | 1.087 | 0.969 | 1.221 | 1.081 | 0.963 | 1.214 | 1.122 | 0.994 | 1.266 | ||
| APRMORT_165002 | 0.352 | 0.113 | 1.1 | 0.352 | 0.113 | 1.099 | 0.362 | 0.115 | 1.137 | ||
| APRMORT_165003 | 3.616 | 1.958 | 6.677 | 3.62 | 1.96 | 6.686 | 3.554 | 1.9 | 6.648 | ||
| APRMORT_165004 | 18.445 | 10.623 | 32.03 | 18.668 | 10.748 | 32.426 | 20.617 | 11.762 | 36.138 | ||
| APRMORT_174001 | 0.095 | 0.04 | 0.221 | 0.094 | 0.04 | 0.221 | 0.091 | 0.039 | 0.214 | ||
| APRMORT_174002 | 0.675 | 0.372 | 1.226 | 0.674 | 0.371 | 1.225 | 0.68 | 0.373 | 1.237 | ||
| APRMORT_174003 | 5.988 | 3.495 | 10.256 | 5.994 | 3.499 | 10.27 | 6.221 | 3.612 | 10.712 | ||
| APRMORT_174004 | 55.13 | 34.324 | 88.547 | 55.374 | 34.469 | 88.957 | 61.919 | 38.356 | 99.959 | ||
| APRMORT_190002 | 4.869 | 2.899 | 8.178 | 4.847 | 2.886 | 8.141 | 5.085 | 3.016 | 8.572 | ||
| APRMORT_190003 | 21.942 | 13.585 | 35.439 | 21.726 | 13.448 | 35.099 | 23.972 | 14.77 | 38.905 | ||
| APRMORT_190004 | 122.158 | 76.067 | 196.178 | 122.164 | 76.063 | 196.208 | 144.677 | 89.571 | 233.684 | ||
| APRMORT_OTHER | 17.874 | 10.931 | 29.228 | 17.913 | 10.949 | 29.308 | 19.103 | 11.619 | 31.407 | ||
| Lowest income | 0.996 | 0.847 | 1.17 | 1.003 | 0.848 | 1.185 | 1.106 | 0.897 | 1.363 | ||
| Low income | 0.989 | 0.853 | 1.147 | 0.997 | 0.855 | 1.161 | 1.054 | 0.873 | 1.273 | ||
| Moderate income | 0.927 | 0.801 | 1.072 | 0.933 | 0.805 | 1.081 | 0.976 | 0.823 | 1.156 | ||
| High income | REF | REF | REF | REF | REF | REF | REF | REF | REF | ||
| 0-99 beds | 1.061 | 0.796 | 1.414 | 1.11 | 0.792 | 1.555 | |||||
| 100-299 beds | REF | REF | REF | REF | REF | REF | |||||
| 300-499 beds | 1.079 | 0.934 | 1.245 | 1.063 | 0.899 | 1.256 | |||||
| 500+ beds | 1.224 | 1.017 | 1.474 | 1.243 | 1.001 | 1.544 | |||||
| Nonteaching | REF | REF | REF | REF | REF | REF | |||||
| Teaching | 0.802 | 0.693 | 0.929 | 0.776 | 0.648 | 0.928 | |||||
| Governmental | 1.165 | 0.935 | 1.453 | 1.242 | 0.967 | 1.594 | |||||
| Not-for-profit | REF | REF | REF | REF | REF | REF | |||||
| For-profit | 0.801 | 0.637 | 1.007 | 0.705 | 0.541 | 0.92 | |||||
| Large metropolitan | REF | REF | REF | ||||||||
| Medium and small metropolitan | 0.94 | 0.827 | 1.068 | ||||||||
| Nonmetropolitan | 1.072 | 0.837 | 1.372 | ||||||||
Abbreviation: REF indicates reference group
Notes: aPatient characteristics were age, sex, All Patient Refined-Diagnosis Related Group (APR-DRG), and community income. bHospital characteristics were bed size, ownership, teaching status, and urban/rural location
Source: Agency for Healthcare Research and Quality, Center for Delivery, Organization, and Markets, Healthcare Cost and Utilization Project, State Inpatient Databases, 2009, from the following 11 states: Arizona, California, Connecticut, Massachusetts, Michigan, Minnesota, New Hampshire, Nevada, New York, Ohio, and Pennsylvania
Table 7.
Association between Medicare managed care and inpatient mortality for stroke
| Characteristic | Patient characteristicsa | Patient + hospital characteristicsb | Patient characteristic + hospital fixed effects | Patient + hospital characteristics + county fixed effects | ||||||||
|---|---|---|---|---|---|---|---|---|---|---|---|---|
| Point estimate | 95% Wald confidence limits | Point estimate | 95% Wald confidence limits | Point estimate | 95% Wald confidence limits | Point estimate | 95% Wald confidence limits | |||||
| Managed care | 0.931 | 0.885 | 0.98 | 0.978 | 0.929 | 1.029 | 0.969 | 0.914 | 1.028 | 0.979 | 0.927 | 1.034 |
| Age 18–64 years | 1.126 | 1.019 | 1.244 | 1.144 | 1.035 | 1.264 | 1.134 | 1.023 | 1.257 | 1.144 | 1.033 | 1.267 |
| Age 65–74 years | REF | REF | REF | REF | REF | REF | REF | REF | REF | REF | REF | REF |
| Age 75–84 years | 1.182 | 1.114 | 1.254 | 1.167 | 1.1 | 1.239 | 1.180 | 1.111 | 1.255 | 1.171 | 1.102 | 1.243 |
| Age 85+ years | 1.614 | 1.518 | 1.717 | 1.574 | 1.48 | 1.675 | 1.589 | 1.490 | 1.693 | 1.561 | 1.466 | 1.663 |
| Male | REF | REF | REF | REF | REF | REF | REF | REF | REF | REF | REF | REF |
| Female | 1.119 | 1.07 | 1.169 | 1.122 | 1.074 | 1.173 | 1.119 | 1.069 | 1.171 | 1.113 | 1.064 | 1.165 |
| APRMORT_45002 | 4.166 | 3.283 | 5.286 | 4.184 | 3.297 | 5.31 | 4.207 | 3.313 | 5.341 | 4.219 | 3.324 | 5.356 |
| APRMORT_45003 | 14.724 | 11.615 | 18.665 | 15.111 | 11.919 | 19.157 | 15.899 | 12.532 | 20.172 | 15.686 | 12.368 | 19.895 |
| APRMORT_45004 | 98.22 | 77.642 | 124.25 | 103.991 | 82.182 | 131.59 | 117.459 | 92.720 | 148.798 | 112.299 | 88.691 | 142.192 |
| APRMORT_44001 | 17.46 | 13.369 | 22.805 | 18.18 | 13.915 | 23.751 | 18.735 | 14.315 | 24.520 | 18.412 | 14.078 | 24.081 |
| APRMORT_44002 | 25.718 | 20.201 | 32.743 | 26.697 | 20.964 | 33.998 | 26.618 | 20.881 | 33.932 | 26.749 | 20.992 | 34.085 |
| APRMORT_44003 | 39.076 | 30.638 | 49.837 | 41.516 | 32.54 | 52.969 | 43.630 | 34.150 | 55.743 | 43.058 | 33.722 | 54.979 |
| APRMORT_44004 | 378.362 | 298.54 | 479.52 | 409.913 | 323.26 | 519.8 | 485.194 | 381.913 | 616.405 | 453.1 | 356.958 | 575.137 |
| APRMORT_21XXX | 50.851 | 39.994 | 64.654 | 55.519 | 43.633 | 70.641 | 58.799 | 46.128 | 74.952 | 57.445 | 45.108 | 73.155 |
| APRMORT_OTHER | 22.104 | 17.3 | 28.241 | 23.958 | 18.742 | 30.626 | 25.232 | 19.713 | 32.297 | 24.529 | 19.177 | 31.374 |
| Lowest income | 0.854 | 0.802 | 0.91 | 0.803 | 0.753 | 0.857 | 0.883 | 0.816 | 0.957 | 0.94 | 0.868 | 1.019 |
| Low income | 0.883 | 0.833 | 0.937 | 0.815 | 0.766 | 0.867 | 0.922 | 0.857 | 0.993 | 0.953 | 0.884 | 1.026 |
| Moderate income | 0.944 | 0.891 | 1.000 | 0.916 | 0.864 | 0.971 | 1.000 | 0.935 | 1.069 | 1.025 | 0.959 | 1.094 |
| High income | REF | REF | REF | REF | REF | REF | REF | REF | REF | REF | REF | REF |
| 0-99 beds | 1.251 | 1.134 | 1.38 | 1.348 | 1.212 | 1.499 | ||||||
| 100-299 beds | REF | REF | REF | REF | REF | REF | ||||||
| 300-499 beds | 0.961 | 0.907 | 1.019 | 1.022 | 0.957 | 1.091 | ||||||
| 500+ beds | 1.054 | 0.982 | 1.131 | 1.026 | 0.948 | 1.11 | ||||||
| Nonteaching | REF | REF | REF | REF | REF | REF | ||||||
| Teaching | 0.862 | 0.814 | 0.912 | 0.86 | 0.804 | 0.92 | ||||||
| Governmental | 1.242 | 1.149 | 1.343 | 1.143 | 1.048 | 1.248 | ||||||
| Not-for-profit | REF | REF | REF | REF | REF | REF | ||||||
| For-profit | 0.799 | 0.725 | 0.88 | 0.776 | 0.693 | 0.868 | ||||||
| Large metropolitan | REF | REF | REF | |||||||||
| Medium and small metropolitan | 1.115 | 1.06 | 1.172 | |||||||||
| Nonmetropolitan | 1.504 | 1.366 | 1.656 | |||||||||
Abbreviation: REF, reference group
Notes: aPatient characteristics were age, sex, All Patient Refined-Diagnosis Related Group (APR-DRG), and community income. bHospital characteristics were bed size, ownership, teaching status, and urban/rural location
Source: Agency for Healthcare Research and Quality, Center for Delivery, Organization, and Markets, Healthcare Cost and Utilization Project, State Inpatient Databases, 2009, from the following 11 states: Arizona, California, Connecticut, Massachusetts, Michigan, Minnesota, New Hampshire, Nevada, New York, Ohio, and Pennsylvania
Table 8.
Association between private managed care and inpatient mortality for stroke
| Characteristic | Patient characteristicsa | Patient + hospital characteristicsb | Patient characteristic + hospital fixed effects | Patient + hospital characteristics + county fixed effects | ||||||||
|---|---|---|---|---|---|---|---|---|---|---|---|---|
| Point estimate | 95% Wald confidence limits | Point estimate | 95% Wald confidence limits | Point estimate | 95% Wald confidence limits | Point estimate | 95% Wald confidence limits | |||||
| Managed care | 0.758 | 0.694 | 0.829 | 0.797 | 0.728 | 0.874 | 0.843 | 0.754 | 0.942 | 0.79 | 0.714 | 0.874 |
| Age 18–44 years | 0.801 | 0.688 | 0.933 | 0.802 | 0.689 | 0.934 | 0.776 | 0.661 | 0.911 | 0.806 | 0.688 | 0.943 |
| Age 45–64 years | REF | REF | REF | REF | REF | REF | REF | REF | REF | REF | REF | REF |
| Age 65+ years | 1.884 | 1.708 | 2.078 | 1.828 | 1.655 | 2.019 | 1.857 | 1.662 | 2.075 | 1.871 | 1.684 | 2.08 |
| Male | REF | REF | REF | REF | REF | REF | REF | REF | REF | REF | REF | REF |
| Female | 1.192 | 1.093 | 1.301 | 1.188 | 1.089 | 1.296 | 1.213 | 1.106 | 1.331 | 1.204 | 1.1 | 1.319 |
| APRMORT_45002 | 17.472 | 11.606 | 26.303 | 17.306 | 11.494 | 26.059 | 18.513 | 12.194 | 28.107 | 17.421 | 11.539 | 26.301 |
| APRMORT_45003 | 37.647 | 24.751 | 57.261 | 37.876 | 24.895 | 57.626 | 43.941 | 28.546 | 67.640 | 38.88 | 25.466 | 59.36 |
| APRMORT_45004 | 286.246 | 190.76 | 429.527 | 297.971 | 198.442 | 447.421 | 429.277 | 281.752 | 654.044 | 327.875 | 217.389 | 494.516 |
| APRMORT_44001 | 48.124 | 30.516 | 75.892 | 50.302 | 31.866 | 79.403 | 58.461 | 36.453 | 93.756 | 52.76 | 33.217 | 83.801 |
| APRMORT_44002 | 31.378 | 20.633 | 47.719 | 32.77 | 21.531 | 49.876 | 38.932 | 25.279 | 59.958 | 33.019 | 21.609 | 50.454 |
| APRMORT_44003 | 125.356 | 82.532 | 190.4 | 130.734 | 85.984 | 198.776 | 172.875 | 112.064 | 266.685 | 141.576 | 92.638 | 216.366 |
| APRMORT_44004 | >999.999 | 832.177 | >999.999 | >999.999 | 873.693 | >999.999 | >999.999 | >999.999 | >999.999 | >999.999 | >999.999 | >999.999 |
| APRMORT_21XXX | 134.17 | 90.207 | 199.559 | 142.957 | 95.953 | 212.986 | 195.398 | 129.375 | 295.113 | 154.649 | 103.417 | 231.263 |
| APRMORT_OTHER | 49.024 | 32.526 | 73.89 | 51.902 | 34.385 | 78.342 | 68.715 | 44.962 | 105.018 | 53.797 | 35.508 | 81.505 |
| Lowest income | 0.973 | 0.855 | 1.107 | 0.925 | 0.811 | 1.055 | 0.929 | 0.791 | 1.092 | 0.996 | 0.846 | 1.174 |
| Low income | 1.028 | 0.912 | 1.158 | 0.959 | 0.848 | 1.084 | 0.993 | 0.859 | 1.148 | 1.044 | 0.9 | 1.212 |
| Moderate income | 1.041 | 0.93 | 1.166 | 1.01 | 0.901 | 1.132 | 1.063 | 0.932 | 1.212 | 1.065 | 0.934 | 1.214 |
| High income | REF | REF | REF | REF | REF | REF | REF | REF | REF | REF | REF | REF |
| 0-99 beds | 1.417 | 1.118 | 1.796 | 1.35 | 1.032 | 1.766 | ||||||
| 100-299 beds | REF | REF | REF | REF | REF | REF | ||||||
| 300-499 beds | 0.899 | 0.792 | 1.021 | 0.885 | 0.767 | 1.021 | ||||||
| 500+ beds | 0.96 | 0.829 | 1.111 | 0.885 | 0.749 | 1.045 | ||||||
| Nonteaching | REF | REF | REF | REF | REF | REF | ||||||
| Teaching | 0.983 | 0.872 | 1.108 | 1.003 | 0.87 | 1.156 | ||||||
| Governmental | 1.506 | 1.299 | 1.746 | 1.352 | 1.139 | 1.603 | ||||||
| Not-for-profit | REF | REF | REF | REF | REF | REF | ||||||
| For-profit | 0.832 | 0.678 | 1.022 | 0.976 | 0.764 | 1.247 | ||||||
| Large metropolitan | REF | REF | REF | |||||||||
| Medium and small metropolitan | 1.221 | 1.101 | 1.354 | |||||||||
| Nonmetropolitan | 1.423 | 1.141 | 1.774 | |||||||||
Abbreviation: REF, reference group
Notes: aPatient characteristics were age, sex, All Patient Refined-Diagnosis Related Group (APR-DRG), and community income. bHospital characteristics were bed size, ownership, teaching status, and urban/rural location
Source: Agency for Healthcare Research and Quality, Center for Delivery, Organization, and Markets, Healthcare Cost and Utilization Project, State Inpatient Databases, 2009, from the following 11 states: Arizona, California, Connecticut, Massachusetts, Michigan, Minnesota, New Hampshire, Nevada, New York, Ohio, and Pennsylvania
Table 9.
Association between Medicare managed care and inpatient mortality for pneumonia
| Characteristic | Patient characteristicsa | Patient + hospital characteristicsb | Patient characteristic + hospital fixed effects | Patient + hospital characteristics + county fixed effects | ||||||||
|---|---|---|---|---|---|---|---|---|---|---|---|---|
| Point estimate | 95% Wald confidence limits | Point estimate | 95% Wald confidence limits | Point estimate | 95% Wald confidence limits | Point estimate | 95% Wald confidence limits | |||||
| Managed care | 1.032 | 0.982 | 1.085 | 1.072 | 1.019 | 1.128 | 0.989 | 0.932 | 1.050 | 1.047 | 0.992 | 1.105 |
| Age 18–64 years | 0.64 | 0.585 | 0.701 | 0.648 | 0.592 | 0.71 | 0.654 | 0.596 | 0.717 | 0.667 | 0.609 | 0.731 |
| Age 65–74 years | REF | REF | REF | REF | REF | REF | REF | REF | REF | REF | REF | REF |
| Age 75–84 years | 1.245 | 1.175 | 1.319 | 1.239 | 1.169 | 1.314 | 1.238 | 1.167 | 1.314 | 1.228 | 1.158 | 1.303 |
| Age 85+ years | 1.859 | 1.754 | 1.969 | 1.845 | 1.742 | 1.956 | 1.816 | 1.711 | 1.928 | 1.802 | 1.699 | 1.912 |
| Male | REF | REF | REF | REF | REF | REF | REF | REF | REF | REF | REF | REF |
| Female | 0.964 | 0.925 | 1.004 | 0.967 | 0.928 | 1.007 | 0.974 | 0.934 | 1.015 | 0.968 | 0.929 | 1.009 |
| APRMORT_137xxx | 24.16 | 18.166 | 32.131 | 24.55 | 18.459 | 32.652 | 28.237 | 21.203 | 37.605 | 27.485 | 20.65 | 36.58 |
| APRMORT_139002 | 4.943 | 3.72 | 6.569 | 4.984 | 3.75 | 6.624 | 5.066 | 3.810 | 6.737 | 5.1 | 3.836 | 6.781 |
| APRMORT_139003 | 19.988 | 15.087 | 26.481 | 20.675 | 15.605 | 27.394 | 22.743 | 17.150 | 30.161 | 22.143 | 16.703 | 29.35 |
| APRMORT_139004 | 89.745 | 67.731 | 118.92 | 94.095 | 71.003 | 124.7 | 113.230 | 85.336 | 150.241 | 105.916 | 79.868 | 140.5 |
| APRMORT_OTHER | 118.202 | 89.115 | 156.78 | 126.055 | 95.007 | 167.25 | 139.748 | 105.195 | 185.649 | 135.944 | 102.388 | 180.5 |
| Lowest income | 0.963 | 0.907 | 1.022 | 0.913 | 0.858 | 0.972 | 0.920 | 0.847 | 0.999 | 0.956 | 0.884 | 1.034 |
| Low income | 0.97 | 0.917 | 1.026 | 0.908 | 0.857 | 0.963 | 0.978 | 0.908 | 1.054 | 0.984 | 0.916 | 1.058 |
| Moderate income | 0.942 | 0.891 | 0.996 | 0.923 | 0.872 | 0.976 | 0.999 | 0.934 | 1.068 | 0.989 | 0.928 | 1.054 |
| High income | REF | REF | REF | REF | REF | REF | REF | REF | REF | REF | REF | REF |
| 0-99 beds | 1.15 | 1.075 | 1.23 | 1.269 | 1.174 | 1.372 | ||||||
| 100-299 beds | REF | REF | REF | REF | REF | REF | ||||||
| 300-499 beds | 0.942 | 0.892 | 0.995 | 0.968 | 0.909 | 1.03 | ||||||
| 500+ beds | 0.987 | 0.917 | 1.062 | 0.948 | 0.873 | 1.03 | ||||||
| Nonteaching | REF | REF | REF | REF | REF | REF | ||||||
| Teaching | 0.882 | 0.834 | 0.933 | 0.903 | 0.844 | 0.967 | ||||||
| Governmental | 1.215 | 1.125 | 1.311 | 1.067 | 0.974 | 1.169 | ||||||
| Not-for-profit | REF | REF | REF | REF | REF | REF | ||||||
| For-profit | 1.051 | 0.973 | 1.135 | 1.048 | 0.956 | 1.148 | ||||||
| Large metropolitan | REF | REF | REF | |||||||||
| Medium and small metropolitan | 1.042 | 0.993 | 1.093 | |||||||||
| Nonmetropolitan | 1.17 | 1.085 | 1.263 | |||||||||
Abbreviation: REF, reference group
Notes: aPatient characteristics were age, sex, All Patient Refined-Diagnosis Related Group (APR-DRG), and community income. bHospital characteristics were bed size, ownership, teaching status, and urban/rural location
Source: Agency for Healthcare Research and Quality, Center for Delivery, Organization, and Markets, Healthcare Cost and Utilization Project, State Inpatient Databases, 2009, from the following 11 states: Arizona, California, Connecticut, Massachusetts, Michigan, Minnesota, New Hampshire, Nevada, New York, Ohio, and Pennsylvania
Table 10.
Association between private managed care and inpatient mortality for pneumonia
| Characteristic | Patient characteristicsa | Patient + hospital characteristicsb | Patient characteristic + hospital fixed effects | Patient + hospital characteristics + county fixed effects | ||||||||
|---|---|---|---|---|---|---|---|---|---|---|---|---|
| Point estimate | 95% Wald confidence limits | Point estimate | 95% Wald confidence limits | Point estimate | 95% Wald confidence limits | Point estimate | 95% Wald confidence limits | |||||
| Managed care | 0.904 | 0.817 | 1.00 | 0.889 | 0.802 | 0.985 | 0.828 | 0.724 | 0.947 | 0.875 | 0.78 | 0.98 |
| Age 18–44 years | 0.396 | 0.33 | 0.476 | 0.393 | 0.328 | 0.472 | 0.374 | 0.308 | 0.454 | 0.393 | 0.326 | 0.474 |
| Age 45–64 years | REF | REF | REF | REF | REF | REF | REF | REF | REF | REF | REF | REF |
| Age 65+ years | 1.57 | 1.408 | 1.751 | 1.573 | 1.409 | 1.757 | 1.654 | 1.457 | 1.878 | 1.54 | 1.371 | 1.731 |
| Male | REF | REF | REF | REF | REF | REF | REF | REF | REF | REF | REF | REF |
| Female | 0.988 | 0.894 | 1.093 | 0.992 | 0.897 | 1.097 | 1.040 | 0.933 | 1.158 | 1.012 | 0.912 | 1.123 |
| APRMORT_137xxx | 88.389 | 46.656 | 167.452 | 88.596 | 46.759 | 167.866 | 109.154 | 57.155 | 208.459 | 101.242 | 53.279 | 192.383 |
| APRMORT_139002 | 31.018 | 16.5 | 58.31 | 30.906 | 16.44 | 58.103 | 32.666 | 17.294 | 61.701 | 31.239 | 16.585 | 58.841 |
| APRMORT_139003 | 140.387 | 75.185 | 262.133 | 140.697 | 75.342 | 262.744 | 172.269 | 91.576 | 324.066 | 155.064 | 82.832 | 290.284 |
| APRMORT_139004 | 570.545 | 304.621 | >999.999 | 576.589 | 307.753 | >999.999 | 851.446 | 450.071 | >999.999 | 687.987 | 365.93 | >999.999 |
| APRMORT_OTHER | 517.875 | 277.751 | 965.593 | 518.855 | 278.119 | 967.97 | 669.828 | 355.990 | >999.999 | 606.831 | 324.27 | >999.999 |
| Lowest income | 0.811 | 0.697 | 0.943 | 0.832 | 0.712 | 0.972 | 0.870 | 0.714 | 1.060 | 0.937 | 0.775 | 1.134 |
| Low income | 0.798 | 0.696 | 0.914 | 0.822 | 0.713 | 0.947 | 0.917 | 0.769 | 1.093 | 0.89 | 0.751 | 1.055 |
| Moderate income | 0.911 | 0.801 | 1.035 | 0.931 | 0.818 | 1.06 | 1.014 | 0.870 | 1.181 | 1.009 | 0.872 | 1.168 |
| High income | REF | REF | REF | REF | REF | REF | REF | REF | REF | REF | REF | REF |
| 0-99 beds | 1.214 | 1.018 | 1.447 | 1.2 | 0.971 | 1.483 | ||||||
| 100-299 beds | REF | REF | REF | REF | REF | REF | ||||||
| 300-499 beds | 1.012 | 0.883 | 1.159 | 1.026 | 0.879 | 1.198 | ||||||
| 500+ beds | 0.892 | 0.749 | 1.062 | 0.851 | 0.699 | 1.035 | ||||||
| Nonteaching | REF | REF | REF | REF | REF | REF | ||||||
| Teaching | 1.221 | 1.063 | 1.402 | 1.204 | 1.021 | 1.419 | ||||||
| Governmental | 1.323 | 1.103 | 1.587 | 1.305 | 1.052 | 1.62 | ||||||
| Not-for-profit | REF | REF | REF | REF | REF | REF | ||||||
| For-profit | 0.868 | 0.699 | 1.079 | 0.87 | 0.68 | 1.113 | ||||||
| Large metropolitan | REF | REF | REF | |||||||||
| Medium and small metropolitan | 0.844 | 0.747 | 0.953 | |||||||||
| Nonmetropolitan | 0.879 | 0.718 | 1.077 | |||||||||
Abbreviation: REF, reference group
Notes: aPatient characteristics were age, sex, All Patient Refined-Diagnosis Related Group (APR-DRG), and community income. bHospital characteristics were bed size, ownership, teaching status, and urban/rural location
Source: Agency for Healthcare Research and Quality, Center for Delivery, Organization, and Markets, Healthcare Cost and Utilization Project, State Inpatient Databases, 2009, from the following 11 states: Arizona, California, Connecticut, Massachusetts, Michigan, Minnesota, New Hampshire, Nevada, New York, Ohio, and Pennsylvania
Table 11.
Association between Medicare managed care and inpatient mortality for congestive heart failure
| Characteristic | Patient characteristicsa | Patient + hospital characteristicsb | Patient characteristic + hospital fixed effects | Patient + hospital characteristics + county fixed effects | |||||||
|---|---|---|---|---|---|---|---|---|---|---|---|
| Point estimate | 95% Wald confidence limits | Point estimate | 95% Wald confidence limits | Point estimate | 95% Wald confidence limits | Point estimate | 95% Wald confidence limits | ||||
| Managed care | 0.950 | 0.904 | 0.998 | 0.981 | 0.933 | 1.031 | Failed to converge | 0.946 | 0.898 | 0.998 | |
| Age 18–64 years | 1.009 | 0.908 | 1.122 | 1.028 | 0.925 | 1.143 | 1.058 | 0.951 | 1.177 | ||
| Age 65–74 years | REF | REF | REF | REF | REF | REF | REF | REF | REF | ||
| Age 75–84 years | 1.327 | 1.247 | 1.413 | 1.317 | 1.237 | 1.402 | 1.303 | 1.223 | 1.387 | ||
| Age 85+ years | 2.022 | 1.902 | 2.15 | 1.996 | 1.877 | 2.122 | 1.935 | 1.819 | 2.059 | ||
| Male | REF | REF | REF | REF | REF | REF | REF | REF | REF | ||
| Female | 0.896 | 0.86 | 0.933 | 0.898 | 0.861 | 0.935 | 0.89 | 0.854 | 0.928 | ||
| APRMORT_161xxx | 2.388 | 1.702 | 3.351 | 2.56 | 1.824 | 3.593 | 2.694 | 1.918 | 3.785 | ||
| APRMORT_191xxx | 7.093 | 5.329 | 9.442 | 7.573 | 5.687 | 10.084 | 8.173 | 6.133 | 10.892 | ||
| APRMORT_194002 | 2.071 | 1.583 | 2.709 | 2.083 | 1.592 | 2.725 | 2.182 | 1.667 | 2.855 | ||
| APRMORT_194003 | 7.415 | 5.69 | 9.663 | 7.613 | 5.842 | 9.922 | 8.285 | 6.354 | 10.803 | ||
| APRMORT_194004 | 37.648 | 28.903 | 49.037 | 39.386 | 30.232 | 51.31 | 45.335 | 34.775 | 59.101 | ||
| APRMORT_OTHER | 15.041 | 11.432 | 19.789 | 16.007 | 12.162 | 21.066 | 17.347 | 13.171 | 22.846 | ||
| Lowest income | 0.881 | 0.83 | 0.935 | 0.832 | 0.782 | 0.885 | 0.828 | 0.766 | 0.894 | ||
| Low income | 0.971 | 0.919 | 1.027 | 0.91 | 0.859 | 0.965 | 0.942 | 0.878 | 1.012 | ||
| Moderate income | 0.96 | 0.908 | 1.014 | 0.943 | 0.891 | 0.997 | 1.008 | 0.946 | 1.074 | ||
| High income | REF | REF | REF | REF | REF | REF | REF | REF | REF | ||
| 0-99 beds | 1.22 | 1.133 | 1.314 | 1.343 | 1.232 | 1.464 | |||||
| 100-299 beds | REF | REF | REF | REF | REF | REF | |||||
| 300-499 beds | 0.955 | 0.904 | 1.008 | 0.941 | 0.885 | 1.001 | |||||
| 500+ beds | 1.058 | 0.987 | 1.134 | 1.061 | 0.981 | 1.148 | |||||
| Nonteaching | REF | REF | REF | REF | REF | REF | |||||
| Teaching | 0.931 | 0.881 | 0.983 | 0.918 | 0.859 | 0.98 | |||||
| Governmental | 1.137 | 1.046 | 1.237 | 1.012 | 0.919 | 1.115 | |||||
| Not-for-profit | REF | REF | REF | REF | REF | REF | |||||
| For-profit | 0.921 | 0.844 | 1.004 | 0.929 | 0.842 | 1.026 | |||||
| Large metropolitan | REF | REF | REF | ||||||||
| Medium and small metropolitan | 1.005 | 0.958 | 1.054 | ||||||||
| Nonmetropolitan | 1.318 | 1.218 | 1.427 | ||||||||
Abbreviation: REF, reference group
Notes: aPatient characteristics were age, sex, All Patient Refined-Diagnosis Related Group (APR-DRG), and community income. bHospital characteristics were bed size, ownership, teaching status, and urban/rural location
Source: Agency for Healthcare Research and Quality, Center for Delivery, Organization, and Markets, Healthcare Cost and Utilization Project, State Inpatient Databases, 2009, from the following 11 states: Arizona, California, Connecticut, Massachusetts, Michigan, Minnesota, New Hampshire, Nevada, New York, Ohio, and Pennsylvania
Table 12.
Association between private managed care and inpatient mortality for congestive heart failure
| Characteristic | Patient characteristicsa | Patient + hospital characteristicsb | Patient characteristic + hospital fixed effects | Patient + hospital characteristics + county fixed effects | ||||||
|---|---|---|---|---|---|---|---|---|---|---|
| Point estimate | 95% Wald confidence limits | Point estimate | 95% Wald confidence limits | Point estimate | 95% Wald confidence limits | Point estimate | 95% Wald confidence limits | |||
| Managed care | 0.621 | 0.549 | 0.704 | 0.643 | 0.567 | 0.729 | Failed to converge | Failed to converge | ||
| Age 18–44 years | 1.012 | 0.74 | 1.386 | 0.989 | 0.722 | 1.354 | ||||
| Age 45–64 years | REF | REF | REF | REF | REF | REF | ||||
| Age 65+ years | 2.036 | 1.785 | 2.322 | 2.131 | 1.865 | 2.435 | ||||
| Male | REF | REF | REF | REF | REF | REF | ||||
| Female | 1.165 | 1.035 | 1.312 | 1.172 | 1.041 | 1.32 | ||||
| APRMORT_161xxx | 2.649 | 1.686 | 4.162 | 2.498 | 1.586 | 3.932 | ||||
| APRMORT_191xxx | 2.739 | 1.803 | 4.162 | 2.612 | 1.716 | 3.975 | ||||
| APRMORT_194002 | 2.32 | 1.613 | 3.337 | 2.32 | 1.613 | 3.337 | ||||
| APRMORT_194003 | 5.392 | 3.775 | 7.703 | 5.366 | 3.756 | 7.666 | ||||
| APRMORT_194004 | 28.071 | 19.641 | 40.12 | 28.013 | 19.592 | 40.053 | ||||
| APRMORT_OTHER | 9.41 | 6.374 | 13.894 | 8.99 | 6.078 | 13.298 | ||||
| Lowest income | 0.736 | 0.619 | 0.876 | 0.713 | 0.596 | 0.853 | ||||
| Low income | 0.82 | 0.699 | 0.961 | 0.829 | 0.703 | 0.977 | ||||
| Moderate income | 0.859 | 0.736 | 1.004 | 0.854 | 0.73 | 1.000 | ||||
| High income | REF | REF | REF | REF | REF | REF | ||||
| 0-99 beds | 1.009 | 0.803 | 1.266 | |||||||
| 100-299 beds | REF | REF | REF | |||||||
| 300-499 beds | 0.983 | 0.834 | 1.158 | |||||||
| 500+ beds | 1.089 | 0.885 | 1.34 | |||||||
| Nonteaching | REF | REF | REF | |||||||
| Teaching | 1.144 | 0.967 | 1.354 | |||||||
| Governmental | 1.601 | 1.289 | 1.988 | |||||||
| Not-for-profit | REF | REF | REF | |||||||
| For-profit | 0.716 | 0.53 | 0.966 | |||||||
| Large metropolitan | REF | REF | REF | |||||||
| Medium and small metropolitan | 1.121 | 0.975 | 1.289 | |||||||
| Nonmetropolitan | 0.804 | 0.618 | 1.045 | |||||||
Abbreviation: REF, reference group
Notes: aPatient characteristics were age, sex, All Patient Refined-Diagnosis Related Group (APR-DRG), and community income. bHospital characteristics were bed size, ownership, teaching status, and urban/rural location
Source: Agency for Healthcare Research and Quality, Center for Delivery, Organization, and Markets, Healthcare Cost and Utilization Project, State Inpatient Databases, 2009, from the following 11 states: Arizona, California, Connecticut, Massachusetts, Michigan, Minnesota, New Hampshire, Nevada, New York, Ohio, and Pennsylvania
Contributor Information
Anika L. Hines, Email: anika.hines@jhmi.edu
Susan O. Raetzman, Phone: 1-301-547-4392, Email: sraetzma@us.ibm.com
Marguerite L. Barrett, Email: barrettm@earthlink.net
Ernest Moy, Email: mou6@cdc.gov.
Roxanne M. Andrews, Email: roxanne.andrews@comcast.net
References
- 1.Andrews R, Russo CA, Pancholi M. Trends in hospital risk-adjusted mortality for select diagnoses and procedures, 1994–2004. HCUP statistical brief #38. Rockville: Agency for Healthcare Research and Quality; 2007. [PubMed] [Google Scholar]
- 2.Hines A, Stranges E, Andrews RM. Trends in hospital risk-adjusted mortality for select diagnoses by patient subgroups, 2000–2007. HCUP statistical brief #98. Rockville: Agency for Healthcare Research and Quality; 2010. [PubMed] [Google Scholar]
- 3.Hines AL, Heslin KC, Jiang HJ, Coffey R. Trends in observed adult inpatient mortality for high-volume conditions, 2002–2012. HCUP statistical brief #194. Rockville: Agency for Healthcare Research and Quality; 2015. [PubMed] [Google Scholar]
- 4.Carlisle DM, Siu AL, Keeler EB, McGlynn EA, Kahn KL, Rubenstein LV, et al. HMO versus fee-for-service care of older persons with acute myocardial infarction. Am J Public Health. 1992;82:1626–30. doi: 10.2105/AJPH.82.12.1626. [DOI] [PMC free article] [PubMed] [Google Scholar]
- 5.Smith MA, Frytak JR, Liou J, Finch MD. Rehospitalization and survival for stroke patients in managed care and traditional medicare plans. Med Care. 2005;43:902–10. doi: 10.1097/01.mlr.0000173597.97232.a0. [DOI] [PMC free article] [PubMed] [Google Scholar]
- 6.Afendulis CC, Chernew ME, Kessler DP. The effect of managed care advantage on hospital admissions and mortality. Cambridge: National Bureau of Economic Research; 2013. [Google Scholar]
- 7.Angus DC, Linde-Zwirble WT, Sirio CA, Rotondi AJ, Chelluri L, Newbold RC, 3rd, et al. The effect of managed care on ICU length of stay: implications for medicare. JAMA. 1996;276:1075–82. doi: 10.1001/jama.1996.03540130073033. [DOI] [PubMed] [Google Scholar]
- 8.Schnitzler MA, Lambert DL, Mundy LM, Woodward RS. Variations in healthcare measures by insurance status for patients receiving ventilator support. Clin Perform Qual Health Care. 1998;6:17–22. [PubMed] [Google Scholar]
- 9.Bennett KM, Scarborough JE, Pappas TN, Kepler TB. Patient socioeconomic status is an independent predictor of operative mortality. Ann Surg. 2010;252:552–7. doi: 10.1097/SLA.0b013e3181f2ac64. [DOI] [PubMed] [Google Scholar]
- 10.Ingram DD, Franco SJ. NCHS urban–rural classification scheme for counties. National Center for Health Statistics. Vital Health Stat. 2012;2(154):1–65. [PubMed]
- 11.Dowd B, Maciejewski ML, O’Connor H, Riley G, Geng Y. Health plan enrollment and mortality in the medicare program. Health Econ. 2011;20:645–59. doi: 10.1002/hec.1623. [DOI] [PubMed] [Google Scholar]
- 12.Agency for Healthcare Research and Quality . Inpatient quality indicators: software documentation. Version 4.1 SAS. Rockville: Agency for Healthcare Research and Quality; 2009. [Google Scholar]
- 13.Friedman B, Jiang HJ. Do medicare advantage enrollees tend to be admitted to hospitals with better or worse outcomes compared with fee-for-service enrollees? Int J Health Care Finance Econ. 2010;10:171–85. doi: 10.1007/s10754-010-9076-0. [DOI] [PubMed] [Google Scholar]
- 14.Ricketts TC. The changing nature of rural health care. Annu Rev Public Health. 2000;21:639–57. doi: 10.1146/annurev.publhealth.21.1.639. [DOI] [PubMed] [Google Scholar]
- 15.Maeng DD, Martsolf GR. Comparing patient outcomes across payer types: implications for using hospital discharge records to assess quality. Health Serv Res. 2011;46:1720–40. doi: 10.1111/j.1475-6773.2011.01285.x. [DOI] [PMC free article] [PubMed] [Google Scholar]
Associated Data
This section collects any data citations, data availability statements, or supplementary materials included in this article.
Data Availability Statement
HCUP State Inpatient Databases (SID) are publicly available for purchase. See the HCUP User Support Web site (http://www.hcup-us.ahrq.gov/sidoverview.jsp) for an overview of the SID. Information on purchasing data is available at http://www.hcup-us.ahrq.gov/tech_assist/centdist.jsp.