Abstract
Purpose
We recently demonstrated that adenosine deaminase-2 (ADA2) contributes to diabetic retinopathy (DR) via up-regulating the production of inflammatory cytokines in macrophages. Also, microRNA (miR)-146b-3p has the ability to inhibit ADA2. The goal of this study was to investigate the potential role of ADA2 and therapeutic benefit of miR-146b-3p in retinal inflammation and endothelial barrier dysfunction during diabetes.
Methods
Adenosine deaminase-2 activity was determined by colorimetric method in diabetic human vitreous. Human monocyte cell line U937 was differentiated into macrophages and then treated with amadori glycated albumin (AGA), and conditioned medium (CM) was used to assess the changes in ADA2 activity and TNF-α and IL-6 levels by ELISA. Also, macrophages were transfected with miR-146b-3p before treatment with AGA. Permeability of human retinal endothelial cells (hRECs) was assessed by electric cell-substrate impedance sensing (ECIS) after treatment with macrophage CM. Zonula occludens (ZO)-1 was examined by immuno-fluorescence in hRECs. Leukocyte adhesion was assessed in hRECs by measuring myeloperoxidase (MPO) activity and intercellular adhesion molecule-1 (ICAM-1) expression.
Results
Adenosine deaminase-2 activity was significantly increased in diabetic human vitreous. ADA2 activity and TNF-α and IL-6 levels were significantly increased in human macrophages by AGA treatment. Amadori glycated albumin–treated macrophage CM significantly increased hREC permeability, disrupted ZO-1 pattern, and increased leukocyte adhesion to hRECs through up-regulating ICAM-1. All these changes were reversed by miR-146b-3p.
Conclusions
Adenosine deaminase-2 is implicated in breakdown of the blood–retinal barrier (BRB) in DR through macrophages-derived cytokines. Therefore, inhibition of ADA2 by miR-146b-3p might be a useful tool to preserve BRB function in DR.
Keywords: adenosine deaminase-2, miR-146b-3p, BRB, TNF-α, IL-6, ZO-1, leukocyte adhesion, diabetic retinopathy
Diabetic retinopathy (DR) is the most frequent neurovascular complication and leading cause of blindness in diabetes.1,2 Blood–retinal barrier (BRB) breakdown with subsequent diabetic macular edema (DME) and retinal neovascularization (RNV) are the main reasons for decreased visual acuity in diabetic patients.3 The exact mechanism by which hyperglycemia leads to vascular disruption is poorly defined. Glycation of proteins and formation of advanced glycation end (AGEs) products have been suggested to link hyperglycemia to retinal microvascular complications of diabetes.4
The nucleoside adenosine is a significant paracrine inhibitor of inflammation and produced by cells under stress through adenosine triphosphate (ATP) breakdown.5,6 It inhibits the proinflammatory consequences of macrophage activation including suppression of cytokines and chemokines production.7,8 However, extracellular adenosine has an extremely short half-life. This is due to rapid uptake by equilibrate nucleoside transporter (ENT) or degradation to inosine by adenosine deaminase enzyme (ADA).9
Adenosine deaminase enzyme plays an important role in inflammatory responses10 and has been reported to increase in macrophage-rich tissues during inflammation.11 Adenosine deaminase 1 and ADA2 are two isoenzymes of ADA that were found in mammals and lower vertebrates. A significant component of overall ADA activity in plasma comes from ADA2,12 the source of which could be T cells13 and B cells.13 Adenosine deaminase 2 activity is elevated in diabetes mellitus, acute lymphoblastic leukemia, and tuberculosis,14,15 which makes ADA2 activity a useful diagnostic marker of specific diseases.16 To clarify ADA2's role in diabetes, the effects of amadori glycated albumin (AGA)17 on human monocytes/macrophages (U937) were determined, and it was found that AGA treatment increased ADA2 expression, ADA2 activity, and TNF-α release,18 suggesting a role for ADA2 in retinal inflammation in DR.
The inflammatory cytokines play an important role in DR progress toward DME and neovascularization (proliferative DR).19 Retinal inflammation and leukocytes adhesion to the microvasculature (leukostasis) promote breakdown of BRB in the development of DR.20 The leukostasis mechanism includes increases in the expression of intercellular adhesion molecule-1 (ICAM-1) adhesion molecule in endothelial cells and its leukocyte counter-receptor CD18.21
Diabetes-induced retinal hyperpermeability may result from alterations of the tight junction proteins including occludin, claudin, junction adhesion molecule (JAM), and zonula occludens (ZO).22 Although numerous studies demonstrated the involvement of proinflammatory cytokines in BRB breakdown and subsequent hyperpermeability in diabetes, the exact underlying mechanism is still not clearly understood.
MicroRNAs (miRs) are small noncoding RNAs that bind to the 3′-untranslated region (UTR) of a messenger RNA (mRNA) target and regulate the oxidative and inflammatory signaling at the posttranscriptional level via degradation of the target mRNA or inhibiting translation.23,24 MicroRNA-146b is conserved among most vertebrates, and it has been involved in innate immunity25 and inflammation.26 It has been reported that NF-κB upregulates the expression of miR-146, however miR-146 showed negative impact on NF-κB activity in retinal endothelial cells subjected to interleukin-1β. This indicates that impaired miR-146 expression contributes to the proinflammatory state in diabetes. Therefore, miR-146 could be a therapeutic target in DR. MicroRNA-146b-5p and miR-146b-3p are two isoforms from the same gene with different sequences and for the regulation of different gene expression.16 Although miR-146b-5p is well studied, miR-146b-3p targets in diabetes are still not distinctly identified. Our study sheds light on the role of miR-146b-3p in regulating ADA2 activity in the inflammatory cells in DR.
The goal of the current study was to investigate the potential role of ADA2 in retinal inflammation and endothelial barrier dysfunction in DR. To achieve this goal, we studied the effect of ADA2 inhibition by miR-146b-3p on cytokines production in AGA-treated human macrophages. Moreover, we evaluated the barrier function of human retinal endothelial cells subjected to treatment with the conditioned medium (CM) of AGA-treated macrophages with or without ADA2 inhibition.
Materials and Methods
Human Monocyte Cells
The human monocyte cell line U937 (ATCC CRL-1593.2, Manassas, VA, USA) was grown in ATCC formulated RPMI-1640 medium (catalog number 30-2001) containing 10% fetal bovine serum (FBS; Atlanta Biologicals, Atlanta, GA, USA) and 1% penicillin-streptomycin (Invitrogen, Carlsbad, CA, USA), subcultured in GIBCO RPMI-1640 (catalog number 11879-020; supplemented with 5 mM D-glucose, Thermo Fisher Scientific, Waltham, MA, USA), and differentiated into macrophages by phorbol 12-myristate13-acetate (PMA, 50 ng/mL) (Sigma-Aldrich Corp., St. Louis, MO, USA). Cells were then cultured in the same media supplemented with 500 μg/mL AGA or albumin (Sigma-Aldrich Corp.) for 12 hours.17 Then, supernatants were collected and used for measurement of ADA2 activity and cytokines levels and used to treat human retinal endothelial cells (hRECs).
Human Monocyte Transfection
U937 cells were differentiated into macrophages and then transfected overnight with hsa-miR-146b-3p mimic or control miR using the Lipofectamine 2000 transfection reagent (Invitrogen) according to the manufacturer's protocol.28 The miR-146b-3p mimic (mirVana miRNA mimic) and the control miR were obtained from Ambion (Austin, TX, USA). After transfection, cells were treated with AGA (500 μg/mL) for 12 hours, and then supernatants were collected.
Human RECs
Human RECs (Cell Systems, Kirkland, WA, USA) were grown on gelatin-coated plates in EBM2 Media (catalog #190860; Lonza, Walkersville, MD, USA), supplemented with 5% FBS, and 1% antibiotic-antimycotic solution 100× (Penicillin Streptomycin, catalog # 30-004-CI; Corning, Inc., New York, NY, USA). The cells were serum starved overnight after reaching 80% to 90% confluency and then treated with AGA, albumin, or 33% macrophage CM of the following groups: control macrophages treated with or without albumin and macrophages treated with AGA in the presence or absence of miR-146b-3p. Endothelial barrier function was monitored over a 30- to 35-hour time interval, whereas leukocyte adhesion was assessed after 24 hours of treatment. Meanwhile, cell lysates were used to measure ICAM-1 expression by Western blot (WB).
Adenosine Deaminase-2 Activity Assay
Adenosine deaminase-2 activity was measured in the CM of macrophages using a kit from Diazyme Laboratories (Poway, CA, USA). The principal of the ADA2 assay is that adenosine is enzymatically deaminated to inosine at pH 6, and then inosine is transformed to hypoxanthine by purine nucleoside phosphorylase. After that, xanthine oxidase converts hypoxanthine to hydrogen peroxide (H2O2) and uric acid. The produced H2O2 reacts with N-ethyl-N-(2-hydroxy-3-sulfopropyl)3-methylaniline and 4aminoantipyrine in the presence of peroxidase to form quinone dye, which is monitored in a kinetic manner. Adenosine deaminase-1 activity is inhibited by erythro-9-(2-hydroxy-3-nonyl) adenine (EHNA; an ADA1-specific inhibitor; Sigma-Aldrich Corp.).
Enzyme-Linked Immunosorbent Assay for TNF-α, IL-6, and IL-10
Tumor necrosis factor-α, IL-6, and IL-10 levels in macrophage CM were estimated with ELISA kits (R&D, Minneapolis, MN, USA).
Transcellular Electrical Resistance Using Electric Cell–Substrate Impedance Sensing
Normalized transcellular electrical resistance (TER) was measured as previously described29 using electric cell–substrate impedance sensing (ECIS) Zθ (theta) instrument (Applied Biophysics, Inc., Troy, NY, USA). Briefly, a 96-well array (catalog # 96W20idf PET; Applied Biophysics, Inc.) was used and coated with cysteine and then gelatin, both for 30 minutes. Thereafter, 7500 hRECs per well were seeded in EBM2 media supplemented with 5% FBS and 1% penicillin-streptomycin. After hRECs reached the confluency as indicated by a capacitance below 10 F, they were cultured in serum-free media overnight and then treated with AGA, albumin, or macrophage CM derived from the aforementioned groups. The electric current, passing through the hREC confluent monolayer, was measured and recorded independently in each well. The TER was measured and recorded for 30 to 35 hours at 4000-Hz current frequency. The resistance value for each well was normalized as the ratio of measured resistance at each time point to baseline resistance and plotted as a function of time.
Immunofluorescence Detection for ZO-1
Zonula occludens-1 expression in hRECs treated with AGA, albumin, or macrophage CM derived from the aforementioned groups for 24 hours was examined with immunofluorescence using ZO-1 antibody (Life Sciences, Thermo Fisher Scientific). Human RECs were grown on incubation chambers and treated with the different treatments, and then hRECs were incubated with paraformaldehyde (4%) for 10 minutes to fix the cells, followed by quenching with 0.1 M glycine in PBS for 15 minutes and then incubation with 1% BSA in PBS for 1 hour. Then, hRECs were incubated with ZO-1 primary antibody (1:100) in 1% BSA at 4°C overnight. Cells were incubated with Oregon green–labeled anti-rabbit antibody (1:500; Molecular Probes, Eugene, OR, USA) for 1 hour. 4′,6-Diamidino-2-phenylindole (DAPI) mounting medium (Vector Laboratories, Burlingame, CA, USA) was used to cover the cells and images were obtained by using confocal microscopy (LSM 510; Carl Zeiss, Thornwood, NY, USA).
Real-Time PCR
Claudin-2, claudin-5, and cadherin-4 (CDH4) mRNA expression levels in hRECs treated with 33% macrophage CM of control macrophages or macrophages treated with AGA in the presence or absence of miR-146b-3p for 24 hours were determined by real-time PCR. Total RNA was isolated by using Ambion TRIzol Reagent (Thermo Fisher Scientific), and the High-Capacity RNA-to-cDNA Kit (Thermo Fisher Scientific) was used for reverse transcription. The mRNA levels were determined by TaqMan Fast Advanced Master Mix and appropriate primers from Thermo Fisher Scientific using Applied Biosystems StepOnePlus machine (Thermo Fisher Scientific). 18S was used as an internal control for normalization.
Western Blotting
Western blotting was used to measure ICAM-1 in hRECs lysates, as previously described.30 Antibody against ICAM-1 at 1:250 dilution (Santa Cruz Biotechnology, Dallas, TX, USA) was used. Also, membranes were probed for β-actin 1:2000 (Sigma-Aldrich Corp.) to confirm equal loading, and the results were quantified by densitometry analysis.
In Vitro Leukocyte Adhesion Using Myeloperoxidase Assay
Human CD14-labeled monocytes were obtained from Lifeline Cell Technology (Frederick, MD, USA). Human RECs were grown in 24-well plates until confluent and then treated with AGA, albumin, or macrophage CM derived from the aforementioned groups for 24 hours. After the treatment, 300,000 to 400,000 human CD14-labeled monocytes per well were added to hRECs and incubated at 37°C for 1.5 hours. The nonadherent cells were removed before adding 250 μL lysis buffer per well, and 50 μL homogenates were transferred to a 96-well black wall plate. Myeloperoxidase (MPO) activity was assessed by the Fluro MPO Myeloperoxidase Detection Kit (catalog# MPO100-3; Cell Technology, Mountain View, CA, USA). Fluorescent MPO fluorescence was assessed at 540-nm excitation wavelength and 595-nm emission wavelength, and blanked results were plotted as fold change.
Statistical Analysis
The results are presented as mean ± SEM. The statistical analysis was performed using Student's t-test or 1-way ANOVA, followed by the Tukey Kramer post hoc test for multiple group comparisons. P < 0.05 was considered statistically significant.
Results
Increased ADA2 Activity in AGA-Treated Human Macrophages
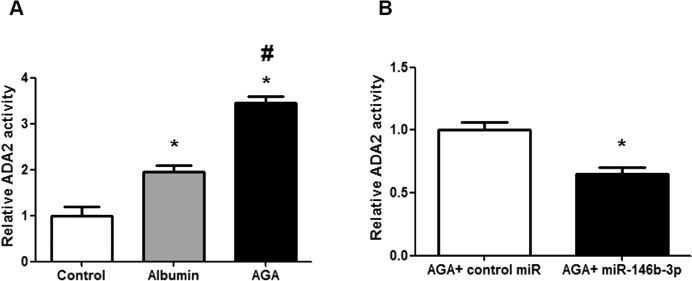
Because macrophages play a key role in the early inflammatory response in DR, we evaluated ADA2 activity in AGA-treated macrophages. Adenosine deaminase-2 activity was significantly increased in AGA-treated macrophage CM compared with albumin-treated or control groups (P < 0.001; Fig. 1A). Consistent with our previous study,16 we found that miR-146b-3p significantly decreased ADA2 activity in AGA-treated macrophage CM compared with the control miR (P = 0.01; Fig. 1B).
Figure 1.
Adenosine deaminase-2 activity in human macrophages. (A) Adenosine deaminase-2 activity in human macrophages treated with AGA, albumin, or control. There is marked increase in ADA2 activity in human macrophages after treatment with AGA compared with albumin or control (*P < 0.05 versus control group, #P < 0.05 versus albumin group; n = 3–4). (B) Adenosine deaminase-2 activity in AGA-treated human macrophages after transfection with miR-146b-3p mimic or control miR (nontargeting miRNA). Human macrophages were transfected with miR-146b-3p or control miR and then treated with AGA, and ADA2 activity was measured in the medium. Adenosine deaminase-2 activity was significantly reduced after transfection with miR-146b-3p compared with control miR (*P < 0.05 versus control miR group; n = 3).
Effect of ADA2 Activity on Cytokine Levels in Macrophages
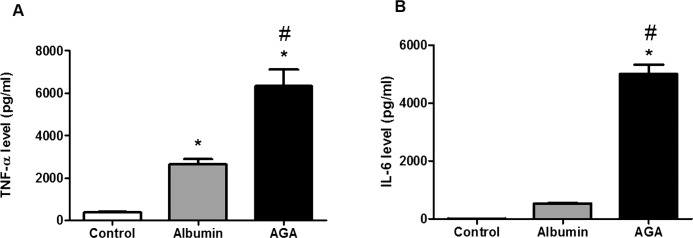
Proinflammatory cytokines including TNF-α and IL-6 have been implicated in the pathogenesis of DR. Therefore, TNF-α and IL-6 levels were measured in macrophage CM. We found that AGA treatment significantly increased both TNF-α and IL-6 levels compared with albumin treatment and controls (P < 0.001; Figs. 2A, 2B, respectively).
Figure 2.
Tumor necrosis factor-α and IL-6 levels in human macrophages treated with AGA, albumin, or control. (A) Tumor necrosis factor-α level in human macrophages treated with AGA, albumin, or control. There is marked increase in TNF-α level in human macrophages after treatment with AGA compared with albumin or control (*P < 0.05 versus control group, #P < 0.05 versus albumin group; n = 4–5). (B) Interleukin-6 level in human macrophages treated with AGA, albumin, or control. There is marked increase in IL-6 level in human macrophages after treatment with AGA compared with albumin or control (*P < 0.05 versus control group, #P < 0.05 versus albumin group; n = 4).
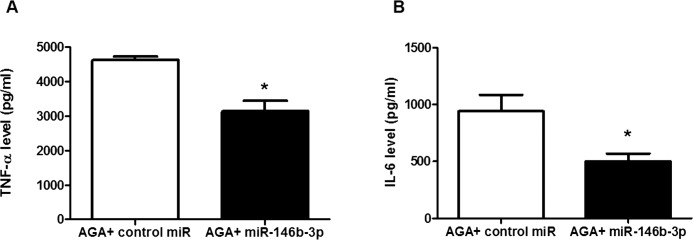
To further determine whether ADA2 activity is involved in up-regulation of proinflammatory cytokines in macrophages during inflammation, we measured TNF-α and IL-6 levels in miR-146b-3p–transfected AGA-treated macrophage CM. We found that miR-146b-3p significantly reduced TNF-α (Fig. 3A) and IL-6 (Fig. 3B) levels in AGA-treated macrophage CM compared with the control miRs (P < 0.001 and P < 0.05, respectively).
Figure 3.
Tumor necrosis factor-α and IL-6 levels in AGA-treated human macrophages after transfection with miR-146b-3p mimic or control miR (nontargeting miRNA). (A) Tumor necrosis factor-α level in human macrophages transfected with miR-146b-3p or control miR then treated with AGA. Tumor necrosis factor-α level was significantly reduced after transfection with miR-146b-3p compared with control miR (*P < 0.05 versus control miR group; n = 5–6). (B) Interleukin-6 level in human macrophages transfected with miR-146b-3p or control miR and then treated with AGA. Interleukin-6 level was significantly reduced after transfection with miR-146b-3p compared with control miR (*P < 0.05 versus control miR group; n = 4).
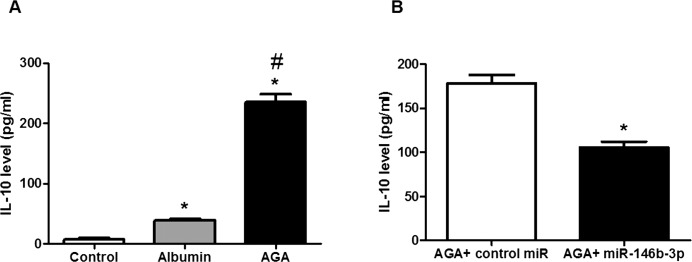
It was reported that IL-10 level was significantly increased in the vitreous of DR patients compared with the control group,31 which suggests that not only inflammation participates in the pathology of DR but also the defense mechanism against inflammation may be activated. Therefore, IL-10 level was measured in the CM of macrophages. We found that AGA treatment significantly increased IL-10 level compared with albumin treatment and control (P < 0.001), and miR-146b-3p significantly reduced IL-10 level in AGA-treated macrophage CM compared with the control miR (P < 0.001; Figs. 4A, 4B, respectively).
Figure 4.
Interleukin-10 levels in human macrophages. (A) Interleukin-10 level in human macrophages treated with AGA, albumin, or control. There is significant increase in IL-10 level in human macrophages after treatment with AGA compared with albumin or control (*P < 0.05 versus control group, #P < 0.05 versus albumin group; n = 5). (B) Interleukin-10 level in AGA-treated human macrophages after transfection with miR-146b-3p mimic or control miR (nontargeting miRNA). Interleukin-10 level was significantly reduced after transfection with miR-146b-3p compared with control miR (*P < 0.05 versus control miR group; n = 5).
Effect of the CM of Macrophages on Retinal Endothelial Cell Permeability
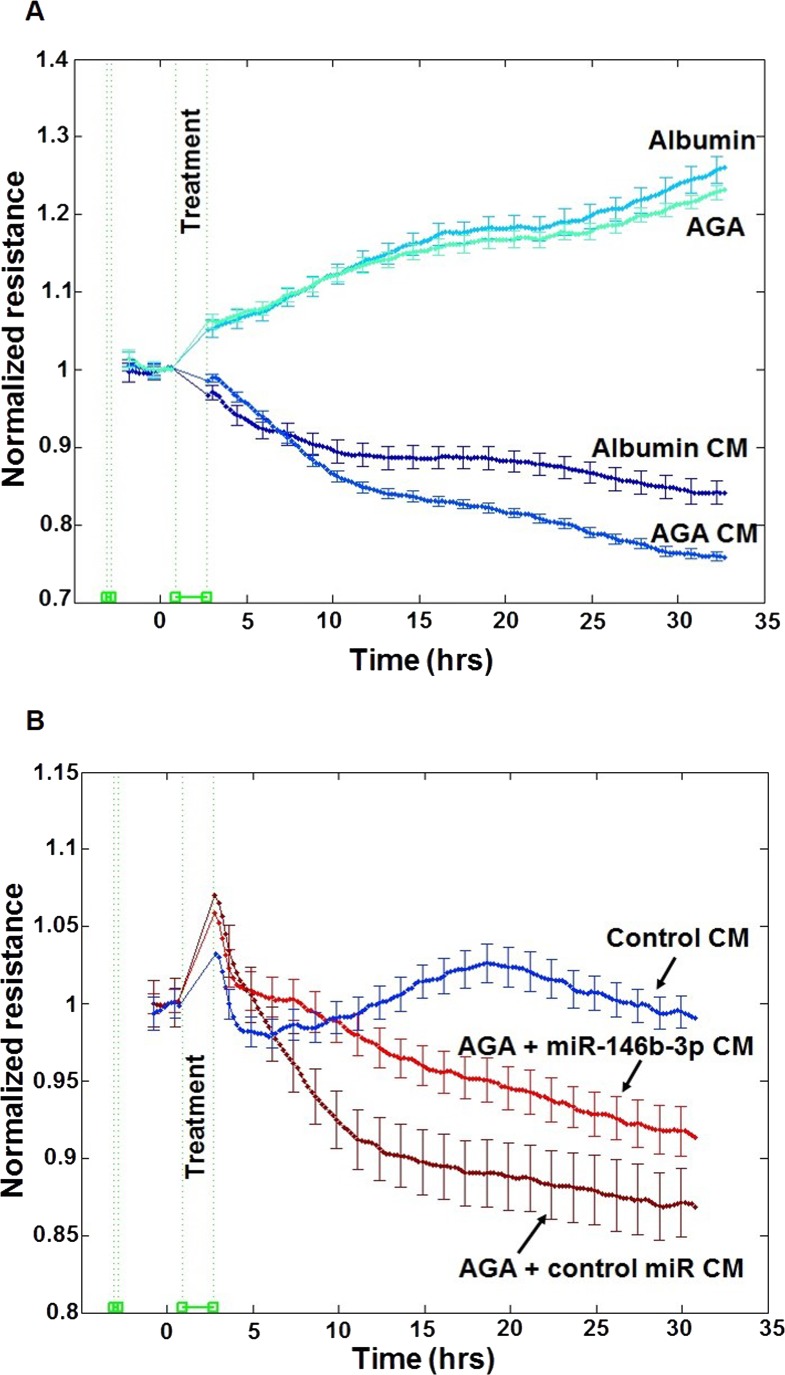
The barrier function of endothelial cells plays an important role in the pathogenesis of DR. Therefore, we evaluated the effect of macrophage CM on retinal endothelial barrier function. Human RECs permeability was evaluated by determining the changes in TER using ECIS over 30 hours. We found that treatment of hRECs with AGA-treated macrophage CM produced a significant decrease in TER compared with albumin-treated macrophage CM starting from the third hour after treatment (P < 0.001). However, direct treatment of hRECs with AGA did not show any significant decrease in TER compared with albumin treatment (P > 0.05; Fig. 5A). Additionally, we found that miR-146b-3p–transfected AGA-treated macrophage CM significantly improved the TER of hRECs compared with control miR-transfected AGA-treated macrophage CM (P < 0.001; Fig. 5B).
Figure 5.
Effect of human macrophages CM on retinal endothelial cell barrier function. (A) Effect of the CM of AGA- or albumin-treated macrophages or direct AGA or albumin treatment on hREC permeability. Human REC permeability was assessed by measuring the changes in TER resistance using ECIS over 30 to 35 hours. Treatment of hRECs with the CM of AGA-treated macrophages induced a significant decrease in TER compared with the treatment with the CM of albumin-treated macrophages (P < 0.05). However, there is no difference in TER of hRECs after direct treatment with AGA compared with albumin treatment (n = 6). (B) Effect of the CM of miR-146b-3p–transfected AGA-treated macrophages on hREC permeability. Human REC permeability was assessed by measuring the changes in TER resistance using ECIS over 30 to 35 hours. Conditioned medium of miR-146b-3p–transfected AGA-treated macrophages significantly improved the TER of hRECs compared with the CM of control miR-transfected AGA-treated macrophages (P < 0.05; n = 4–6). Experiments were carried out after hRECs formed confluent mature monolayers indicated by plateau of electronic resistance where the resistance reached 1000 ohms. Data are presented as normalized TER resistance ±SE over time.
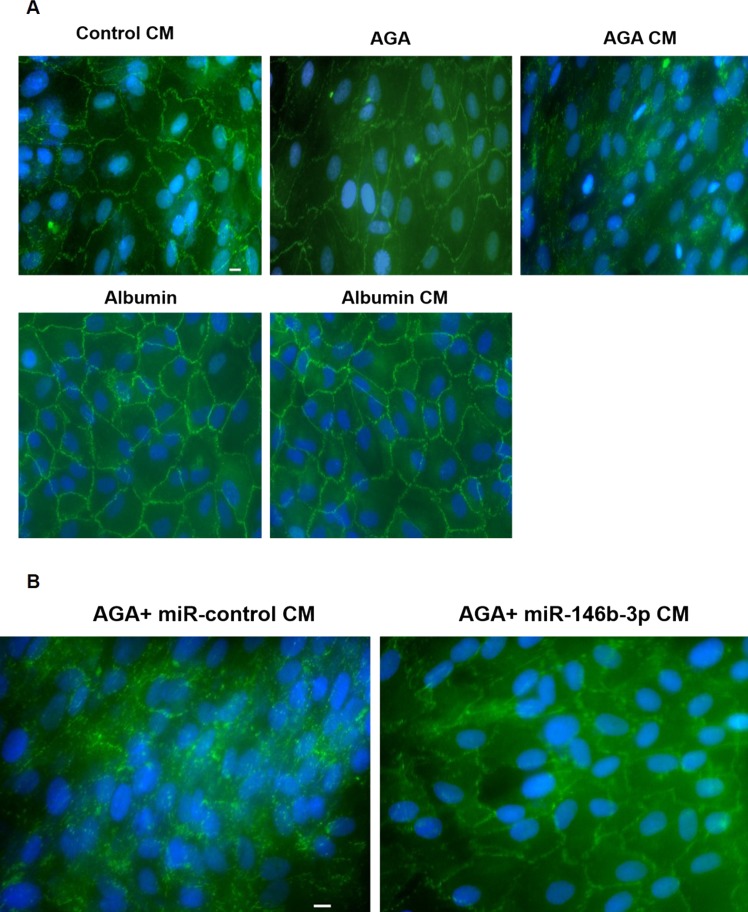
We also examined the expression of ZO-1 in hRECs. We found that the ZO-1 pattern was highly disrupted only after treatment with AGA-treated macrophage CM. However, the ZO-1 pattern remained intact after treatment with the CM of the control macrophages, albumin-treated macrophages, or direct AGA or albumin treatment (Fig. 6A). Also, the ZO-1 pattern remained intact after treatment with miR-146b-3p–transfected AGA-treated macrophage CM, whereas the ZO-1 pattern was highly disrupted after treatment with control miR-transfected AGA-treated macrophage CM (Fig. 6B).
Figure 6.
Effect of human macrophages CM on ZO-1 pattern in hRECs. (A) Immunofluorescence of ZO-1 in hRECs after treatment with the CM of AGA-, albumin-, or control-treated macrophages or direct AGA or albumin treatment. Zonula occludens-1 pattern (green color) of hRECs was highly disrupted after treatment with the CM of AGA-treated macrophages. However, ZO-1 pattern remained intact after treatment with the CM of the control macrophages, albumin-treated macrophages, or the direct AGA or albumin treatment. Nuclei were stained with DAPI (blue color; n = 8). Scale bar denoted as 10 μm. (B) Immunofluorescence of ZO-1 in hRECs after treatment with the CM of miR-146b-3p–transfected AGA-treated macrophages. Zonula occludens-1 pattern (green color) remained intact after treatment with the CM of miR-146b-3p–transfected AGA-treated macrophages, whereas ZO-1 pattern was highly disrupted after treatment with the CM of the control miR-transfected AGA-treated macrophages. Nuclei were stained with DAPI (blue color; n = 8). Scale bar denoted as 10 μm.
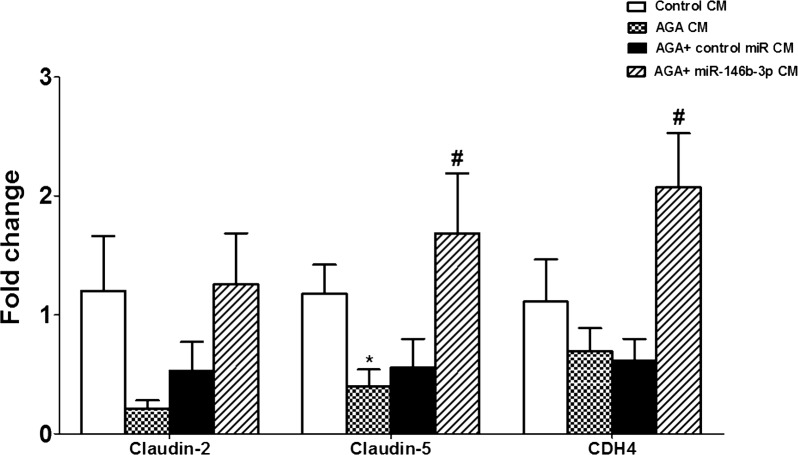
Additionally, mRNA expression levels of claudin-2, claudin-5, and cadherin-4 (CDH4) in hRECs were evaluated. Claudin-5 mRNA level in hRECs was significantly decreased by the CM of AGA-treated macrophages compared with the CM of control macrophages (P < 0.02). Human RECs treated with the CM of AGA-treated macrophages that were transfected with miR-146b-3p showed a normal mRNA level of claudin-5. There was also a marked reduction in the levels of claudin-2 and the adherence junction cadherin-4 (CDH4) in hRECs treated with the CM of AGA-treated macrophages, and this effect of AGA was prevented in hRECs treated with the CM of AGA-treated macrophages that were transfected with miR-146b-3p. However, the numbers did not reach statistical significance (P > 0.05) in claudin-2 and were significant in CDH4 (P < 0.05; Fig. 7). We also evaluated mRNA expression levels of other tight junction proteins such as tight junction protein 2 (TJP2), adherens junctions associated protein 1 (AJAP1), Y-box binding protein 3 (YBX3), and F 11 receptor (F11R). However, there were no differences in their levels among different groups (data not shown).
Figure 7.
Effect of human macrophages CM on mRNA expression levels of claudin-2, claudin-5, and cadherin-4 (CDH4) in hRECs. Claudin-5 mRNA level in hRECs was significantly decreased after treatment with AGA-treated macrophage CM compared with the CM of control macrophages (*P < 0.05 versus control CM group). The AGA-treated macrophage CM did not show significant decreases in claudin-2 and cadherin-4 (CDH4) mRNA levels compared with the CM of control macrophages (P > 0.05). Conditioned medium of miR-146b-3p–transfected AGA-treated macrophages showed significant restoration of the levels of claudin-5 and CDH-4 compared with the cells treated with the CM of AGA-treated macrophages (#P < 0.05).
Effect of the CM of Macrophages on Leukocyte/Endothelial Cell Interaction
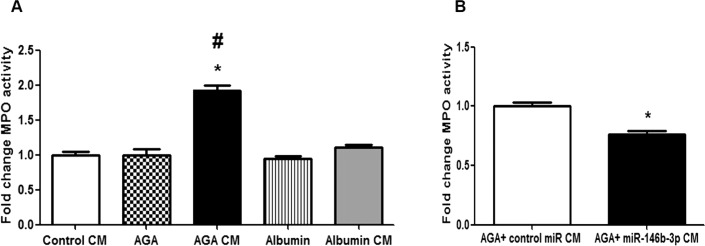
We evaluated the effect of macrophage CM on leukocyte adhesion to the hRECs by measuring the MPO activity in leukocyte/endothelial cell coculture. Our results showed significant increases in MPO activity after treatment with AGA-treated macrophage CM compared with the CM of control macrophages or albumin-treated macrophages (P < 0.001), suggesting increased leukocyte adhesion to hRECs by AGA-treated macrophage CM. However, direct treatment of hRECs with AGA did not show any significant increases in MPO activity compared with albumin (P > 0.05; Fig. 8A). Additionally, we found that miR-146b-3p–transfected AGA-treated macrophage CM significantly reduced MPO activity compared with control miR-transfected AGA-treated macrophage CM (P < 0.001; Fig. 8B).
Figure 8.
Effect of human macrophages CM on leukocyte/endothelial cell interaction. (A) Effect of the CM of AGA-, albumin-, or control-treated macrophages or direct AGA or albumin treatment on leukocyte adhesion to hRECs. Fold change of MPO activity (indicator of leukocyte adhesion) showing significant increases in leukocyte adhesion after treatment with the CM of AGA-treated macrophages compared with the CM of control macrophages or albumin-treated macrophages (*P < 0.05 versus control CM group, #P < 0.05 versus albumin CM group). Direct treatment of hRECs with AGA did not show any significant increases in leukocyte adhesion compared with albumin treatment (P > 0.05; n = 6). (B) Effect of the CM of miR-146b-3p–transfected AGA-treated macrophages on leukocyte adhesion to hRECs. Fold change of MPO activity (indicator of leukocyte adhesion) showing significant decreases in leukocyte adhesion after treatment with the CM of miR-146b-3p–transfected AGA-treated macrophages compared with the CM of control miR-transfected AGA-treated macrophages (*P < 0.05 versus control miR CM group; n = 6).
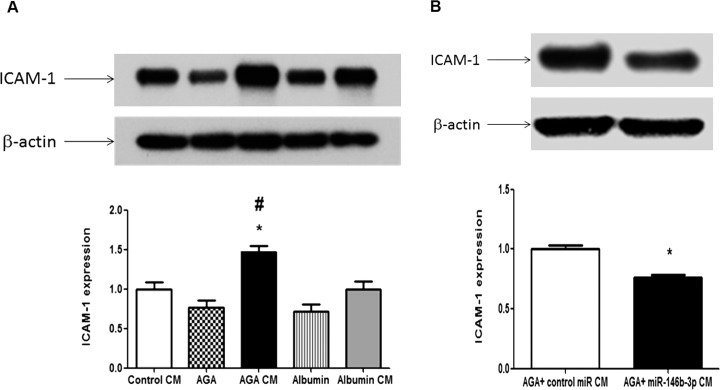
Also, we assessed the effect of CM of macrophages on ICAM-1 expression in hRECs. We found that AGA-treated macrophage CM significantly increased ICAM-1 expression compared with the CM of control macrophages and albumin-treated macrophages (P < 0.05). On the other hand, direct AGA treatment did not show any significant increases in ICAM-1 expression compared with albumin treatment (P > 0.05; Fig. 9A). In addition, miR-146b-3p–transfected AGA-treated macrophage CM significantly reduced ICAM-1 expression in hRECs compared with control miR-transfected AGA-treated macrophage CM (P < 0.01; Fig. 9B).
Figure 9.
Effect of human macrophages CM on expression of adhesion molecule ICAM-1 in hRECs. (A) Western blot of ICAM-1 in hRECs treated with the CM of AGA-, albumin-, or control-treated macrophages or direct AGA or albumin. There is significant up-regulation of ICAM-1 expression in hRECs treated with CM of AGA-treated macrophages compared with the CM of control macrophages or albumin-treated macrophages (*P < 0.05 versus control CM group, #P < 0.05 versus albumin CM group). Direct treatment of hRECs with AGA did not show any significant increases in ICAM-1 expression compared with albumin treatment (P > 0.05; n = 4). (B) Western blot of ICAM-1 in hRECs treated with the CM of miR-146b-3p–transfected AGA-treated macrophages showing significant decrease in ICAM-1 expression in hRECs after treatment with the CM of miR-146b-3p–transfected AGA-treated macrophages compared with the CM of control miR-transfected AGA-treated macrophages (*P < 0.05 versus control miR CM group; n = 4).
Discussion
Inflammation is a key feature in diabetic complications such as DR.32 Retinal immune cells play an important role in DR, as during diabetes these cells are activated and lead to retinal inflammation. These cells participate in proinflammatory and anti-inflammatory processes. Adenosine induces the anti-inflammatory process, and its concentration is regulated by the adenosine deaminase enzymes.16 During inflammation, increased ADA2 has been found in macrophage-rich tissues,11 and it has been reported that microglia/macrophages were accumulated in the subretinal space during diabetes.33 Therefore, we studied the role of ADA2 in AGA-treated macrophages and subsequently in hRECs. The major findings of the current study were as follows: (1) increased ADA2 activity in AGA-treated macrophages was associated with significant increase in TNF-α, IL-6, and IL-10 levels; (2) inhibition of ADA2 activity by miR-146b-3p significantly prevented the effect of AGA on TNF-α, IL-6, and IL-10 levels in human macrophages; and (3) disruption of hREC barrier function and increased leukocyte adhesion by the CM of AGA-treated macrophages. These effects were abrogated by miR-146b-3p, suggesting a key role of ADA2 activity in mediating the inflammatory response in the retina during diabetes.
Current therapeutic options for DR such as photo-coagulation, vitrectomy and intraocular steroids injections, and anti-VEGF remain limited by their adverse effects.34 Therefore, a new therapeutic approach should be found for DR treatment. MicroRNAs have recently been identified as attractive therapeutic targets. As miRs play important roles in human diseases, regulating these miRs by either antagonizing or restoring miR function may provide a therapeutic benefit.35 We previously found that miR-146b-3p expression significantly decreased in macrophages treated with AGA, and miR-146b-3p could inhibit ADA2 expression and activity in macrophages. Also, we previously found that miR-146b-3p level was significantly decreased in the vitreous of diabetic human patients compared with the control group. However, ADA2 activity was significantly increased in the vitreous of diabetic human patients.16 Additionally, we proved that human ADA2 mRNAs have conserved miR-146b-3p recognition sites, and the coexpression of miR-146b-3p mimic in U937 cells significantly suppressed the GLuc luciferase reporter activity of the ADA2 linked 3′-UTR, indicating that miR-146b-3p suppresses ADA2 expression through miRNA binding sequences in its 3′-UTR.16,25 Therefore, we studied the ability of miR-146b-3p to regulate the inflammatory cascade in AGA-treated macrophages and the subsequent effect on hRECs.
We found that ADA2 activity was significantly increased in macrophages after treatment with AGA compared with albumin and the control group. We also found that this elevation of ADA2 activity in macrophages was significantly inhibited by miR-146b-3p compared with control miR. Additionally, ADA2 increased activity in macrophages was accompanied by significant elevation of TNF-α, IL-6, and IL-10 levels, and miR-146b-3p significantly decreased TNF-α, IL-6, and IL-10 levels in AGA-treated macrophages compared with the control miR. From these results, we can conclude that glycated proteins have the ability to activate macrophages and increase ADA2 activity, which leads to the production of proinflammatory and anti-inflammatory cytokines. All of these changes could be reversed by miR-146b-3p, which suggests that miR-146b-3p could attenuate the diabetic-induced inflammation in macrophages and hence a potential therapeutic target to prevent the development of retinal inflammatory response during DR. To further explore this possibility, we evaluated whether miR-146b-3p could impact retinal endothelial cell barrier dysfunction in response to treatment with AGA-treated macrophage CM.
Breakdown of BRB and vascular hyperpermeability are the main features of DR.30 Therefore, we studied the effect of macrophage CM on hREC permeability. The TER is a sensitive index of tight junction integrity36; therefore, we measured the effect of AGA, albumin, albumin-treated macrophage CM, and AGA-treated macrophage CM on TER of hRECs. We interestingly found that direct treatment of hRECs with AGA did not significantly reduce TER compared with albumin, whereas the AGA-treated macrophage CM significantly reduced TER of hRECs compared with direct AGA treatment and albumin-treated macrophage CM. Also, albumin-treated macrophage CM significantly reduced TER of hRECs compared with direct albumin treatment, which might be due to the effects of TNF-α and IL-6 proinflammatory cytokines that were produced from albumin-treated macrophages.
From these results, we concluded that AGA might not directly increase hREC permeability. However, AGA might first activate macrophages, which secreted soluble proinflammatory cytokines that increased hREC permeability and disrupted the barrier function of endothelial cells. Additionally, we found that miR-146b-3p–transfected AGA-treated macrophage CM significantly increased the TER of hRECs compared with the control miR-transfected AGA-treated macrophage CM.
Endothelial cell permeability is regulated by tight junction proteins such as occludin, claudins, JAMs, tricellulin, and ZO-1.37 Zonula occludens-1 is one of the main tight junction proteins that is related directly to TER.36,38 Therefore; we studied the effect of macrophage CM on ZO-1 pattern in hRECs to investigate the mechanism responsible for increased permeability. We found that ZO-1 pattern remained intact after direct albumin or AGA treatment and after treatment with the CM of control macrophages or albumin-treated macrophages. However, ZO-1 pattern was highly disrupted after treatment with AGA-treated macrophage CM.
Endothelial cells specifically and highly express claudin-5.39 Therefore, we evaluated mRNA expression level of claudin-5 in hRECs after treatment with macrophage CM. Amadori glycated albumin–treated macrophage CM significantly reduced the expression of claudin-5 mRNA in hRECs in comparison with the cells treated with CM of the control macrophages. Although AGA-treated macrophage CM also induced a marked decrease in claudin-2 and cadherin-4 (CDH4), it did not reach the statistical significance (P > 0.05). Interestingly, the mRNA levels of claudin-5 and CDH4 were restored in hRECs treated with the CM of AGA-treated macrophages that were transfected with miR-146b-3p. Our data suggest that AGA-treated macrophage CM increased the permeability of hRECs, probably via its effect on several tight and adherence junction proteins (TJPs and AJPs) including ZO-1, claudin-5, claudin-2, and CDH4 and that miR-146b-3p might play beneficial role in protecting the retinal endothelial cell barrier function against the inflammatory response to AGA.
These results suggest that glycated proteins during diabetes may activate macrophages to produce soluble proinflammatory cytokines, which may cross the endothelial cell basement membrane in vivo and disrupt the tight junction proteins, finally leading to the increase in hREC permeability.
Chemokines and cell adhesion molecules such as ICAM-1 are seen to be elevated in the aqueous and vitreous of DR patients.40 Increased expression of ICAM-1 facilitates the leukocyte adhesion in the diabetic retina. Leukostasis is an important phenomenon for the increased monocytes and neutrophils, which associated with retinal vascular abnormalities in diabetes.41 Adhesion of leukocytes is one of the earlier events in diabetic retinal inflammation that leads to loss of endothelial cells and breakdown of BRB.42,43 Diapedesis in the retina is mediated through the dissociation of tight junctional proteins in the endothelial cells during intercellular leukocyte migration.44,45 Due to this important role of ICAM-1 and leukocyte adhesion in DR pathophysiology, we studied the effect of macrophage CM on ICAM-1 expression and leukocyte adhesion to hRECs. We found that direct treatment of hRECs with AGA did not show any significant increase in ICAM-1 expression compared with albumin, whereas AGA-treated macrophage CM significantly increased ICAM-1 expression of hRECs compared with control macrophage CM or albumin-treated macrophage CM. Also, AGA direct treatment of hRECs did not affect leukocyte adhesion; however, AGA-treated macrophage CM significantly increased leukocyte adhesion to hRECs. From these results, we can conclude that during DR, macrophages are activated by the leaked glycated proteins and secrete inflammatory cytokines, which through a paracrine loop, activate retinal endothelial cells and results in increasing ICAM-1 expression and ultimately leukocyte adhesion.
Also, we found that that miR-146b-3p–transfected AGA-treated macrophage CM significantly decreased ICAM-1 expression and leukocyte adhesion to hRECs compared with the control miR-transfected AGA-treated macrophage CM. These results suggest that miR-146b-3p might inhibit leukocyte adhesion. Because leukocyte adhesion has been implicated in the development of retinal hyperpermeability, capillary degeneration, and RNV during DR, we suggest miR-146b-3p as a potential therapeutic intervention to inhibit the development of microvascular dysfunction associated with DR.
We focused on the potential role of ADA2 in the development of an early inflammatory response during DR. However, its role in various stages of the disease has not yet been established. Diabetic retinopathy is a disease that passes through different stages: the early inflammatory response (leukostasis and hyperpermeability), followed by pathologic RNV. Although there is no direct evidence for the role of ADA2 in pathologic RNV, few studies have correlated its substrate (adenosine) with pathologic RNV. Elimination of adenosine activity via targeting its receptor A2A demonstrated reduction in pathologic RNV in a mouse model of oxygen-induced retinopathy.46 This suggests that activation of ADA2 might elicit antiangiogenic activity through degradation of adenosine into inosine. Taken together, our data and other studies suggest that the adenosine–ADA2 pathway might have a differential effect on the development of DR depending on the stage of the disease. Although ADA2 is implicated in early inflammation, its activation could elicit an antiangiogenic effect during the late stage of disease. To confirm that, we need further investigations using an experimental model of pathologic RNV.
Conclusions
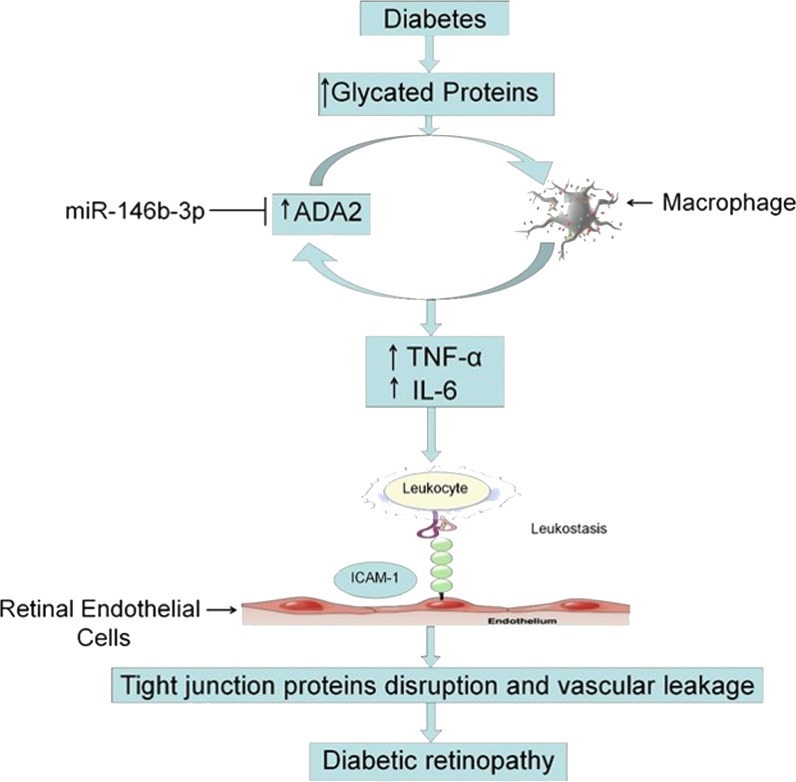
We conclude that activation of macrophages by leaked glycated proteins initiates the inflammatory cascade of DR through activation of ADA2 and production of soluble inflammatory cytokines, which activate leukocyte adhesion to hRECs and disrupt the tight junction proteins leading to hRECs hyperpermeability. Thus, inhibition of ADA2 by miR-146b-3p could be a useful tool to prevent leukostasis and in turn preserve BRB function in DR (Fig. 10).
Figure 10.
Proposed novel signaling pathway in the development of diabetic retinopathy. During diabetes, leaked glycated proteins initiate the inflammatory cascade of DR through activation of ADA2 in macrophages and production of soluble inflammatory cytokines like TNF-α and IL-6, which activate leukocyte adhesion to retinal endothelial cells and finally leads to disruption of tight junction proteins and breakdown of the BRB. MicroRNA-146b-3p might be able to inhibit the production of inflammatory cytokines from macrophages through inhibition of ADA2 and subsequently might protect BRB. This signaling pathway suggests ADA2 as a potential therapeutic target to prevent or at least minimize the microvascular dysfunction in DR.
Acknowledgments
Supported by Department of Defense Grant W81XWH-11-2-0046 (GIL), National Eye Institute Grant R01EY023315-01 (MA), and Egyptian Cultural and Educational Bureau Grant 20141123 (YAS).
Disclosure: Y.A. Samra, None; H.M. Saleh, None; K.A. Hussein, None; N.M. Elsherbiny, None; A.S. Ibrahim, None; K. Elmasry, None; S. Fulzele, None; M.M. El-Shishtawy, None; L.A. Eissa, None; M. Al-Shabrawey, None; G.I. Liou, None
References
- 1. Sivaprasad S,, Gupta B,, Gulliford MC,, et al. Ethnic variations in the prevalence of diabetic retinopathy in people with diabetes attending screening in the United Kingdom (DRIVE UK). PLoS One. 2012; 7: e32182. [DOI] [PMC free article] [PubMed] [Google Scholar]
- 2. Aiello LP,, Gardner TW,, King GL,, et al. Diabetic retinopathy. Diabetes Care. 1998; 21: 143– 156. [DOI] [PubMed] [Google Scholar]
- 3. Ciulla TA,, Amador AG,, Zinman B. Diabetic retinopathy and diabetic macular edema: pathophysiology, screening, and novel therapies. Diabetes Care. 2003; 26: 2653– 2664. [DOI] [PubMed] [Google Scholar]
- 4. Shah CA. Diabetic retinopathy: a comprehensive review. Indian J Med Sci. 2008; 62: 500– 519. [PubMed] [Google Scholar]
- 5. Haskó G,, Linden J,, Cronstein B,, Pacher P. Adenosine receptors: therapeutic aspects for inflammatory and immune diseases. Nat Rev Drug Discov. 2008; 7: 759– 770. [DOI] [PMC free article] [PubMed] [Google Scholar]
- 6. Linden J. New insights into the regulation of inflammation by adenosine. J Clin Invest. 2006; 116: 1835– 1837. [DOI] [PMC free article] [PubMed] [Google Scholar]
- 7. Koscsó B,, Csóka B,, Selmeczy Z,, et al. Adenosine augments IL-10 production by microglial cells through an A2B adenosine receptor-mediated process. J Immunol. 2012; 188: 445– 453. [DOI] [PMC free article] [PubMed] [Google Scholar]
- 8. Ryzhov S,, Zaynagetdinov R,, Goldstein AE,, et al. Effect of A2B adenosine receptor gene ablation on adenosine-dependent regulation of proinflammatory cytokines. J Pharmacol Exp Ther. 2008; 324: 694– 700. [DOI] [PubMed] [Google Scholar]
- 9. Nagy LE,, Diamond I,, Casso DJ,, Franklin C,, Gordon AS. Ethanol increases extracellular adenosine by inhibiting adenosine uptake via the nucleoside transporter. J Biol Chem. 1990; 265: 1946– 1951. [PubMed] [Google Scholar]
- 10. Adanin S,, Yalovetskiy IV,, Nardulli BA,, Sam AD, II,, Jonjev ZS,, Law WR. Inhibiting adenosine deaminase modulates the systemic inflammatory response syndrome in endotoxemia and sepsis. Am J Physiol Regul Integr Comp Physiol. 2002; 282: R1324– R1332. [DOI] [PubMed] [Google Scholar]
- 11. Law WR,, Valli VE,, Conlon BA. Therapeutic potential for transient inhibition of adenosine deaminase in systemic inflammatory response syndrome. Crit Care Med. 2003; 31: 1475– 1481. [DOI] [PubMed] [Google Scholar]
- 12. Ratech H,, Thorbecke GJ,, Meredith G,, Hirschhorn R. Comparison and possible homology of isozymes of adenosine deaminase in Aves and humans. Enzyme. 1981; 26: 74– 84. [DOI] [PubMed] [Google Scholar]
- 13. Daddona PE,, Kelley WN. Characteristics of an aminohydrolase distinct from adenosine deaminase in cultured human lymphoblasts. Biochim Biophys Acta. 1981; 658: 280– 290. [DOI] [PubMed] [Google Scholar]
- 14. Tsuboi I,, Sagawa K,, Shichijo S,, Yokoyama MM,, Ou DW,, Wiederhold MD. Adenosine deaminase isoenzyme levels in patients with human T-cell lymphotropic virus type 1 and human immunodeficiency virus type 1 infections. Clin Diagn Lab Immunol. 1995; 2: 626– 630. [DOI] [PMC free article] [PubMed] [Google Scholar]
- 15. Pérez-Rodriguez E,, Jiménez Castro D. The use of adenosine deaminase and adenosine deaminase isoenzymes in the diagnosis of tuberculous pleuritis. Curr Opin Pulm Med. 2000; 6: 259– 266. [DOI] [PubMed] [Google Scholar]
- 16. Fulzele S,, El-Sherbini A,, Ahmad S,, et al. MicroRNA-146b-3p regulates retinal inflammation by suppressing adenosine deaminase-2 in diabetes. Biomed Res Int. 2015; 2015: 846501. [DOI] [PMC free article] [PubMed] [Google Scholar]
- 17. Ibrahim AS,, El-Remessy AB,, Matragoon S,, et al. Retinal microglial activation and inflammation induced by amadori-glycated albumin in a rat model of diabetes. Diabetes. 2011; 60: 1122– 1133. [DOI] [PMC free article] [PubMed] [Google Scholar]
- 18. Elsherbiny NM,, Naime M,, Ahmad S,, et al. Potential roles of adenosine deaminase-2 in diabetic retinopathy. Biochem Biophys Res Commun. 2013; 436: 355– 361. [DOI] [PubMed] [Google Scholar]
- 19. Rangasamy S,, McGuire PG,, Das A. Diabetic retinopathy and inflammation: novel therapeutic targets. Middle East Afr J Ophthalmol. 2012; 19: 52– 59. [DOI] [PMC free article] [PubMed] [Google Scholar]
- 20. Yuuki T,, Kanda T,, Kimura Y,, et al. Inflammatory cytokines in vitreous fluid and serum of patients with diabetic vitreoretinopathy. J Diabetes Complications. 2001; 15: 257– 259. [DOI] [PubMed] [Google Scholar]
- 21. Adamis AP,, Berman AJ. Immunological mechanisms in the pathogenesis of diabetic retinopathy. Semin Immunopathol. 2008; 30: 65– 84. [DOI] [PubMed] [Google Scholar]
- 22. Matter K,, Balda MS. Signalling to and from tight junctions. Nat Rev Mol Cell Biol. 2003; 4: 225– 236. [DOI] [PubMed] [Google Scholar]
- 23. Marin T,, Gongol B,, Chen Z,, et al. Mechanosensitive microRNAs-role in endothelial responses to shear stress and redox state. Free Radic Biol Med. 2013; 64: 61– 68. [DOI] [PMC free article] [PubMed] [Google Scholar]
- 24. Konopka W,, Kiryk A,, Novak M,, et al. MicroRNA loss enhances learning and memory in mice. J Neurosci. 2010; 30: 14835– 14842. [DOI] [PMC free article] [PubMed] [Google Scholar]
- 25. Taganov KD,, Boldin MP,, Chang KJ,, Baltimore D. NF-kappaB-dependent induction of microRNA miR-146, an inhibitor targeted to signaling proteins of innate immune responses. Proc Natl Acad Sci U S A. 2006; 103: 12481– 12486. [DOI] [PMC free article] [PubMed] [Google Scholar]
- 26. Nakasa T,, Miyaki S,, Okubo A,, et al. Expression of microRNA-146 in rheumatoid arthritis synovial tissue. Arthritis Rheum. 2008; 58: 1284– 1292. [DOI] [PMC free article] [PubMed] [Google Scholar]
- 27. Kovacs B,, Lumayag S,, Cowan C,, Xu S. MicroRNAs in early diabetic retinopathy in streptozotocin-induced diabetic rats. Invest Ophthalmol Vis Sci. 2011; 52: 4402– 4409. [DOI] [PubMed] [Google Scholar]
- 28. Zhang Y,, Wang Y,, Gao W,, et al. Transfer of siRNA against XIAP induces apoptosis and reduces tumor cells growth potential in human breast cancer in vitro and in vivo. Breast Cancer Res Treat. 2006; 96: 267– 277. [DOI] [PubMed] [Google Scholar]
- 29. Othman A,, Ahmad S,, Megyerdi S,, et al. 12/15-Lipoxygenase-derived lipid metabolites induce retinal endothelial cell barrier dysfunction: contribution of NADPH oxidase. PLoS One. 2013; 8: e57254. [DOI] [PMC free article] [PubMed] [Google Scholar]
- 30. Hussein KA,, Choksi K,, Akeel S,, et al. Bone morphogenetic protein 2: a potential new player in the pathogenesis of diabetic retinopathy. Exp Eye Res. 2014; 125: 79– 88. [DOI] [PMC free article] [PubMed] [Google Scholar]
- 31. Suzuki Y,, Nakazawa M,, Suzuki K,, Yamazaki H,, Miyagawa Y. Expression profiles of cytokines and chemokines in vitreous fluid in diabetic retinopathy and central retinal vein occlusion. Jpn J Ophthalmol. 2011; 55: 256– 263. [DOI] [PubMed] [Google Scholar]
- 32. Liou GI. Diabetic retinopathy: role of inflammation and potential therapies for anti-inflammation. World J Diabetes. 2010; 1: 12– 18. [DOI] [PMC free article] [PubMed] [Google Scholar]
- 33. Omri S,, Behar-Cohen F,, de Kozak Y,, et al. Microglia/macrophages migrate through retinal epithelium barrier by a transcellular route in diabetic retinopathy: role of PKCζ in the Goto Kakizaki rat model. Am J Pathol. 2011; 179: 942– 953. [DOI] [PMC free article] [PubMed] [Google Scholar]
- 34. Liou GI,, Ahmad S,, Naime M,, Fatteh N,, Ibrahim AS. Role of adenosine in diabetic retinopathy. J Ocul Biol Dis Infor. 2011; 4: 19– 24. [DOI] [PMC free article] [PubMed] [Google Scholar]
- 35. Bader AG,, Brown D,, Winkler M. The promise of microRNA replacement therapy. Cancer Res. 2010; 70: 7027– 7030. [DOI] [PMC free article] [PubMed] [Google Scholar]
- 36. Gardner TW,, Lieth E,, Khin SA,, et al. Astrocytes increase barrier properties and ZO-1 expression in retinal vascular endothelial cells. Invest Ophthalmol Vis Sci. 1997; 38: 2423– 2427. [PubMed] [Google Scholar]
- 37. Zhang X,, Zeng H,, Bao S,, Wang N,, Gillies MC. Diabetic macular edema: new concepts in patho-physiology and treatment. Cell Biosci. 2014; 4: 27– 40. [DOI] [PMC free article] [PubMed] [Google Scholar]
- 38. Aveleira CA,, Lin CM,, Abcouwer SF,, Ambrósio AF,, Antonetti DA. TNF-α signals through PKCζ/NF-κB to alter the tight junction complex and increase retinal endothelial cell permeability. Diabetes. 2010; 59: 2872– 2882. [DOI] [PMC free article] [PubMed] [Google Scholar]
- 39. Morita K,, Sasaki H,, Furuse K,, Furuse M,, Tsukita S,, Miyachi Y. Expression of claudin-5 in dermal vascular endothelia. Exp Dermatol. 2003; 12: 289– 295. [DOI] [PubMed] [Google Scholar]
- 40. Meleth AD,, Agrón E,, Chan CC,, et al. Serum inflammatory markers in diabetic retinopathy. Invest Ophthalmol Vis Sci. 2005; 46: 4295– 4301. [DOI] [PubMed] [Google Scholar]
- 41. Schröder S,, Palinski W,, Schmid-Schönbein GW. Activated monocytes and granulocytes, capillary nonperfusion, and neovascularization in diabetic retinopathy. Am J Pathol. 1991; 139: 81– 100. [PMC free article] [PubMed] [Google Scholar]
- 42. Yuuki T,, Kanda T,, Kimura Y,, et al. Inflammatory cytokines in vitreous fluid and serum of patients with diabetic vitreoretinopathy. J Diabetes Complications. 2001; 15: 257– 259. [DOI] [PubMed] [Google Scholar]
- 43. Joussen AM,, Murata T,, Tsujikawa A,, Kirchhof B,, Bursell SE,, Adamis AP. Leukocyte-mediated endothelial cell injury and death in the diabetic retina. Am J Pathol. 2001; 158: 147– 152. [DOI] [PMC free article] [PubMed] [Google Scholar]
- 44. Muller WA. Leukocyte-endothelial-cell interactions in leukocyte transmigration and the inflammatory response. Trends Immunol. 2003; 24: 327– 334. [DOI] [PubMed] [Google Scholar]
- 45. Rangasamy S,, McGuire PG,, Das A. Diabetic retinopathy and inflammation: novel therapeutic targets. Middle East Afr J Ophthalmol. 2012; 19: 52– 59. [DOI] [PMC free article] [PubMed] [Google Scholar]
- 46. Liu XL,, Zhou R,, Pan QQ,, et al. Genetic inactivation of the adenosine A2A receptor attenuates pathologic but not developmental angiogenesis in the mouse retina. Invest Ophthalmol Vis Sci. 2010; 51: 6625– 6632. [DOI] [PMC free article] [PubMed] [Google Scholar]


