

Abstract
Our objective was to compare the effect of commercial weight-loss programs on blood pressure and lipids to control/education or counseling among individuals with overweight/obesity. We conducted a systematic review by searching MEDLINE and Cochrane Database of Systematic Reviews from inception to November 2014 and references identified by the programs. We included randomized, controlled trials ≥12 weeks duration. Two reviewers extracted information on study design, interventions, and mean change in systolic blood pressure (SBP), diastolic blood pressure (DBP), low-density lipoprotein cholesterol (LDL-c), high-density lipoprotein cholesterol (HDL-c), triglycerides, and total cholesterol and assessed risk of bias. We included 27 trials. Participants’ blood pressure and lipids were normal at baseline in most trials. At 12 months, Weight Watchers showed little change in blood pressure or lipid outcomes as compared to control/education (2 trials). At 12 months, Atkins’ participants had higher HDL-c and lower triglycerides than counseling (4 trials). Other programs had inconsistent effects or lacked long-term studies. Risk of bias was high for most trials of all programs. In conclusion, limited data exist regarding most commercial weight-loss programs’ long-term effects on blood pressure and lipids. Clinicians should be aware that Weight Watchers has limited data that demonstrate CVD risk factor benefits relative to control/education. Atkins may be a reasonable option for patients with dyslipidemia. Additional well-designed, long-term trials are needed to confirm these conclusions and evaluate other commercial programs.
Keywords: Risk factors, Blood pressure, Cholesterol, Commercial weight-loss programs
Introduction
In 2011–2012, 69% of U.S. adults met criteria for overweight or obesity (1). Overweight/obesity have been linked to morbidity related to cardiovascular disease (CVD), including coronary heart disease and stroke (2–4). A higher body mass index (BMI) is associated with increased risk of fatal and non-fatal CVD events (5). Previous studies have suggested a relationship between overweight/obesity and CVD risk factors including higher systolic and diastolic blood pressures, total cholesterol, triglycerides, and low-density lipoprotein cholesterol (LDL-c), as well as lower high-density lipoprotein cholesterol (HDL-c)(6–8).
Weight loss can improve blood pressure and lipids (9–12). Recent weight management guidelines from the American Heart Association, American College of Cardiology and The Obesity Society (AHA/ACC/TOS) endorse CVD risk factor benefits for adults with obesity (5). Strong evidence demonstrates a dose-response relationship between amount of weight loss with reduced blood pressure and improved lipid profile – specifically lowering LDL-c and increasing HDL-c (5).
Nearly two-thirds of Americans report having seriously attempted to lose weight (13). The commercial weight-loss services industry was expected to generate $6.3 billion in revenue in 2015 (14). In the coming years, the weight-loss services industry anticipates continued growth due to increased referrals from clinicians, as the 2010 Patient Protection and Affordable Care Act covers obesity screening. In addition, some state Medicaid programs have considered offering commercial weight-loss programs as a covered benefit (15).
Commercial programs may not incorporate all components recommended in the guidelines – high-intensity counseling that promotes a healthful, reduced-calorie diet, increased physical activity, and behavior change strategies (5). Programs that rely on prepackaged foods may not provide or recommend an appropriate balance of macronutrients or sodium. In general, highly processed foods contain higher levels of salt, sugars, and saturated fats than recommended (16–17). The U.S. Department of Agriculture (USDA) encourages diets limited in sodium, sugar, and saturated fat, given their relationship with CVD risk (18). Commercial programs may also not provide the recommended program intensity or behavioral counseling. Therefore, while prior studies support the benefits of lifestyle change and weight loss on blood pressure and lipids, it is unclear whether commercial weight-loss programs provide similar benefits. Prior systematic reviews have evaluated the weight loss efficacy of commercial weight-loss programs (19–21), but none have evaluated blood pressure or lipid outcomes. Our objective was to compare the effect of commercial weight-loss programs on these CVD risk factors to control/education or counseling among individuals with overweight/obesity.
Methods
Identification and Selection of Weight-Loss Programs
We generated a list of 141 commercial and proprietary weight-loss programs through several sources: obesity experts, U.S. News & World Report rankings, and Internet searches (Google and Bing), which we then narrowed to only include programs that emphasized nutrition (dietary change and/or meal replacements) and behavioral counseling/social support components with or without physical activity. We required that all programs be currently available in the U.S. Additional details on program identification and selection have been published previously (20). We included 32 programs for consideration in this review (Supplemental Table 1).
Data Sources and Search Strategy
We developed a study protocol prior to data collection that we publically registered with PROSPERO (CRD42014007155). We used three data sources to identify citations: MEDLINE, Cochrane Database of Systematic Reviews (CDSR), and the commercial programs themselves. Our search strategy has been published previously (20). In brief, we searched MEDLINE for articles published from October 2002 through November 2014. We screened all articles included in a prior review, which had searched MEDLINE from inception to October 2003 (19). We searched CDSR from inception to November 2014 using a similar search strategy as our MEDLINE search. We reviewed the reference lists of each included article, relevant review articles, and related systematic reviews to identify additional citations for screening. In November 2014, we reviewed each included weight-loss program’s website and culled any scientific articles listed for screening. We also contacted all included weight-loss programs to request bibliographies of published studies using their program and any unpublished trial results.
Study Selection
Two study team members independently reviewed and screened articles against pre-specified eligibility criteria (Supplemental Table 2). We included randomized controlled trials (RCTs) among adults (age ≥20) with overweight/obesity (body mass index ≥25 kg/m2) that compared blood pressure and lipids between a commercial weight-loss program to control/education or counseling. We labeled comparators as “control/education” if participants received no intervention, only printed materials, health education curriculum, or engaged in less than 3 educational sessions with a provider during the study period; and as “counseling” if participants had 3 or more consultations with a provider to discuss diet, exercise, and/or behavior modification. RCTs needed to be of 12 weeks duration or longer.
Data Extraction
Two team members extracted data on study design, setting, population characteristics, and intervention characteristics. Our outcomes included mean change in the following: systolic blood pressure (SBP), diastolic blood pressure (DBP), LDL-c, HDL-c, triglycerides, and total cholesterol. These CVD risk factors were pre-specified secondary outcomes of our review, and we have previously reported programs’ effect on our primary outcomes of weight loss, adherence, and harms (20), and another reports glycemic outcomes (22).
Data Synthesis and Analysis
For all comparisons, we synthesized the data by calculating and displaying the between-group mean differences with 95% CIs for individual RCTs grouped by comparison. Many studies did not report tests of between-group mean differences in outcomes (e.g., analysis of change over time in each study arm; between-group mean difference in percentage change; comparison with pooled intervention arms); therefore, we calculated between-group differences from provided information. In addition, many studies did not provide variance measures (e.g., no standard deviation, confidence intervals or p-value reported; non-specific statement that p-value was “non-significant”), which prevented estimate of confidence intervals for between-group mean differences. We denote analysis type (intention-to-treat or completers) for each result. Primary time periods of interest were 6 months (range 5–6 months) and 12 months (range 10–15 months). We do not present any meta-analyses due to the trials’ heterogeneous study populations and comparator arms, varying analysis types, and failure to report variance estimates for some outcomes.
Risk of Bias Assessment
Two reviewers independently assessed the risk of bias (ROB) for each included study using the Cochrane Collaboration’s tool (23). We designated a trial’s overall ROB at a time point as “low” if the following were all low: selection bias based on inadequate generation of a randomized sequence, detection bias based on lack of outcome assessor blinding, and attrition bias. We designated the trial’s ROB as “high,” if any domain was high. If all domains were unclear, we labeled the trial as “unclear.” ROB was otherwise “moderate.” Finally, we reexamined the rating of each trial to incorporate potential reporting bias when a test of between-group mean differences was not reported. We rated any trial with this potential bias as “high,” if not already rated at that level. We characterized the ROB for each program’s body of evidence by examining the overall ROB for relevant trials. For each program, we rated the ROB across trials as “low,” if most studies were low; as “high,” if most trials were high; and otherwise as “moderate.”
Results
Of the 4,212 unique citations identified, we identified 39 RCTs that tested a commercial weight-loss program (20), but only 27 reported at least one blood pressure and/or lipid outcome and were included in this study (Figure 1). Supplemental Table 3 provides a complete bibliography of included trials and their corresponding articles, and Supplemental Table 4 describes each included program’s components and costs.
Figure 1. Summary of evidence search and selection.

*Trials with ineligible study designs (e.g., retrospective case series or RCTs <12 weeks in duration) or ineligible programs (e.g., not available in the United States). **Used medications or supplements; modified specifically for the study; unavailable in the United States; or available only to special populations (e.g., active-duty military personnel or veterans). Abbreviations: CDSR — Cochrane Database of Systematic Reviews; RCT — randomized, controlled trial.
Overall, trial participants’ mean age ranged from 36 to 59 years and the majority was female. Race varied across trials. Participants’ blood pressure and lipids were normal at baseline in most trials. Most studies received financial support from the commercial program that they were investigating. Supplemental Table 5 provides details on study and population characteristics, ROB ratings, and weight loss outcomes for each individual trial. We highlight our primary results at 6 and 12 months here; however, the supplement contains 3- and 24-month outcomes (Supplemental Tables 6 and 7). While Figures 2–7 include blood pressure and lipids results for all programs, the results should not be used to directly compare outcomes between commercial programs as studies had different eligibility criteria and comparator groups. Our results can be used to compare each program to outcomes of control/education or counseling.
Figure 2. Difference in mean systolic blood pressure (SBP) change in mmHg between commercial programs and comparators at 6 and 12 months, displayed by program type.
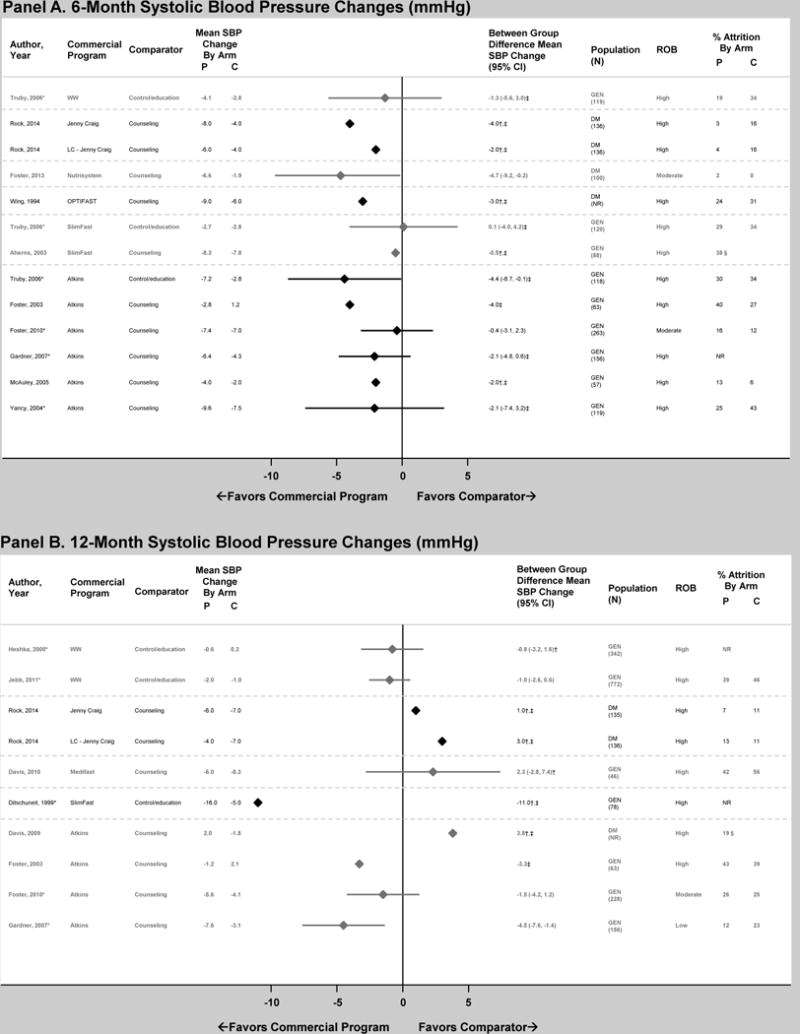
Panel A displays 6-month results and Panel B displays 12-month results. Diamond size is standardized across trials and does not reflect the sample size analyzed. Risk of bias (ROB) reflects overall assessment of each outcome at the time point for that trial, which were determined based on ratings of selection, detection, attrition, and reporting biases. “Attrition” reflects the percentage of participants unavailable for outcome measurement at that time point or weight measurement if N analyzed was not reported. *Results reported in >1 article. †Analysis did not use intention-to-treat approach (e.g., completers’ only). ‡Between-group differences inferred from results provided (e.g., analysis of change over time in each study arm). §Overall attrition at time point. Abbreviations: C — comparator group; DM — overweight or obese patients with diabetes mellitus; GEN — general population of overweight and obese patients; LC — low-carbohydrate version of program; NR — not reported; P — commercial program group; ROB – risk of bias; SBP – systolic blood pressure; WW — Weight Watchers.
Figure 7. Difference in mean total cholesterol (TC) change in mg/dL between commercial programs and comparators at 6 and 12 months, displayed by program type.

Panel A displays 6-month results and Panel B displays 12-month results. Diamond size is standardized across trials and does not reflect the sample size analyzed. Risk of bias (ROB) reflects overall assessment of each outcome at the time point for that trial, which were determined based on ratings of selection, detection, attrition, and reporting biases. “Attrition” reflects the percentage of participants unavailable for outcome measurement at that time point or weight measurement if N analyzed was not reported. To convert units from mg/dL to mmol/L, multiply by 0.02586. *Results reported in >1 article. †Analysis did not use intention-to-treat approach (e.g., completers’ only). ‡Between-group differences inferred from results provided (e.g., analysis of change over time in each study arm). §Overall attrition at time point. Abbreviations: C — comparator group; DM — overweight or obese patients with diabetes mellitus; GEN — general population of overweight and obese patients; LC — low-carbohydrate version of program; NR — not reported; P — commercial program group; ROB – risk of bias; T – telephone-based program; TC – total cholesterol; WW — Weight Watchers.
Weight Watchers
Weight Watchers is a high-intensity program where individuals monitor their food intake by tracking points and participate in group, one-on-one, or online support. Baseline mean SBP and DBP were within the normal range (Table 1). No significant between-group differences in SBP change occurred at 6 or 12 months (1 and 2 trials, respectively)(Figure 2). DBP decreased more in the Weight Watchers groups at 6 and 12 months (3 trials), but this difference was only statistically significant in one trial at 12 months (Figure 3).
Table 1.
Population Characteristics among Included Randomized Controlled Trials, by Program and Comparator
| Commercial Program | Comparator | RCTs, n (N eligible) |
Range Study Duration, months | RCTs with COI*, n | Ranges of Overall Baseline Population Characteristics
|
||||||
|---|---|---|---|---|---|---|---|---|---|---|---|
| Mean Age, years | Women, % | White Black, % | Mean BMI, kg/m2 | Mean SBP Mean DBP, mmHg | Mean LDL-c Mean HDL-c, mg/dL | Mean TG, mg/dL | |||||
|
| |||||||||||
| Weight Watchers | Control/education | 4 (1,358) |
3–24 | 3 | 36–48 | 72–100 | 74** 13** |
31–34 | 117–130 78–81 |
138–141** 45–50** |
124–155** |
| Counseling | 0 | – | – | – | – | – – |
– | – – |
– – |
– |
|
|
| |||||||||||
| Jenny Craig | Control/education | 1 (70) |
12 | 1 | 40–42 | 100 | 57 3–17 |
34 | NR NR |
113–121 50–52 |
99–112 |
| Counseling | 2 (669) |
12–24 | 2 | 44–57 | 47–100 | 68–80 3–9 |
34–36 | 131–133** 83–84** |
79–122 37–57 |
107–181 | |
|
| |||||||||||
| Nutrisystem | Control/education | 1 (69) |
3 | 1 | 52–53 | 68–74 | 37–44 44–60 |
39 | 125–126 74 |
NR NR |
128–160 |
| Counseling | 2 (127) |
3–6 | 2 | 54–56 | 58–100 | 32–40** 54–64** |
33–35 | 126–132 74–82 |
94–96** 50–52** |
137–141** | |
|
| |||||||||||
| HMR | Control/education | 0 | – | – | – | – | – – |
– | – – |
– – |
– |
| Counseling | 1 (38) |
6 | 0 | 45–51 | 75–77 | 91–94 6–9 |
35–36 | NR NR |
119–121 NR |
NR | |
|
| |||||||||||
| Medifast | Control/education | 0 | – | – | – | – | – – |
– | – – |
– – |
– |
| Counseling | 1 (90) |
10 | 1 | 43–45 | 33–76 | 42–60 46–56 |
38–39 | 125–126 83 |
109–117 52 |
109–135 | |
|
| |||||||||||
| OPTIFAST | Control/education | 0 | – | – | – | – | – – |
– | – – |
– – |
– |
| Counseling | 1 (93) |
6 | 0 | 51–52 | 63–67 | NR NR |
37–38 | 139–140 87 |
124–128 42–43 |
195–225 | |
|
| |||||||||||
| SlimFast | Control/education | 3 (275) |
6–51 | 3 | 39–49 | 35–82 | NR NR |
32–35 | 129–140 76–83 |
137–151** 40–51 |
124–198 |
| Counseling | 3 (227) |
3–12 | 3 | 48–59 | 33–41** | NR NR |
29–34 | 128–130** 72** |
98–125 38–54 |
133–217 | |
|
| |||||||||||
| Atkins | Control/education | 1 (118) |
12 | 0 | 41 | 74–75 | NR NR |
32 | 130–135 81–83 |
141–144 46–47 |
124–146 |
| Counseling | 7 (1,026) |
6–24 | 3 | 40–54 | 9–100 | 14–79** 3–66** |
31–37 | 116–131** 73–83** |
92–157 38–55 |
113–190 | |
|
| |||||||||||
| Biggest Loser Club | Control/education | 1 (203) |
3 | 1 | 42 | 58–59 | NR NR |
32 | 121–122 79–80 |
116–120 50 |
142–159 |
| Counseling | 0 | – | – | – | – | – – |
– | – – |
– – |
– | |
|
| |||||||||||
| Curves | Control/education | 1 (48) |
3 | 1 | 48 | 100 | NR NR |
36 | NR NR |
NR NR |
NR |
| Counseling | 0 | – | – | – | – | – – |
– | – – |
– – |
– | |
We considered COI to occur if the trial or study investigators received support from the commercial program that they were studying.
Results from trials reporting this characteristic. Abbreviations: BMI – body mass index; COI – conflict of interest; DBP – diastolic blood pressure; HDL-c – high-density lipoprotein cholesterol; HMR – Health Management Resources; LDL-c – low-density lipoprotein cholesterol; NR – not reported; RCT – randomized controlled trial; SBP – systolic blood pressure; TG – triglycerides.
Figure 3. Difference in mean diastolic blood pressure (DBP) change in mmHg between commercial programs and comparators at 6 and 12 months, displayed by program type.

Panel A displays 6-month results and Panel B displays 12-month results. Diamond size is standardized across trials and does not reflect the sample size analyzed. Risk of bias (ROB) reflects overall assessment of each outcome at the time point for that trial, which were determined based on ratings of selection, detection, attrition, and reporting biases. “Attrition” reflects the percentage of participants unavailable for outcome measurement at that time point or weight measurement if N analyzed was not reported. *Results reported in >1 article. †Analysis did not use intention-to-treat approach (e.g., completers’ only). ‡Between-group differences inferred from results provided (e.g., analysis of change over time in each study arm). §Overall attrition at time point. Abbreviations: C — comparator group; DBP – diastolic blood pressure; DM — overweight or obese patients with diabetes mellitus; GEN — general population of overweight and obese patients; LC — low-carbohydrate version of program; NR — not reported; P — commercial program group; ROB – risk of bias; WW — Weight Watchers.
Baseline mean lipids values were within the normal range or slightly elevated (Table 1). One trial compared lipid outcomes at 6 months between Weight Watchers and control/education; however, appropriate variance estimates were not reported for LDL-c, HDL-c or triglycerides to determine statistical significance. At 12 months, Weight Watchers lowered LDL-c significantly more than control/education (1 trial)(Figure 4). Weight Watchers raised HDL-c more than control/education at 12 months (2 trials), which was statistically significant in one trial (Figure 5). No significant between-group differences existed for change in triglycerides or total cholesterol at 12 months (Figures 6 and 7).
Figure 4. Difference in mean low-density lipoprotein cholesterol (LDL-c) change in mg/dL between commercial programs and comparators at 6 and 12 months, displayed by program type.

Panel A displays 6-month results and Panel B displays 12-month results. Diamond size is standardized across trials and does not reflect the sample size analyzed. Risk of bias (ROB) reflects overall assessment of each outcome at the time point for that trial, which were determined based on ratings of selection, detection, attrition, and reporting biases. “Attrition” reflects the percentage of participants unavailable for outcome measurement at that time point or weight measurement if N analyzed was not reported. To convert units from mg/dL to mmol/L, multiply by 0.02586. *Results reported in >1 article. †Analysis did not use intention-to-treat approach (e.g., completers’ only). ‡Between-group differences inferred from results provided (e.g., analysis of change over time in each study arm). §Overall attrition at time point. Abbreviations: C — comparator group; DM — overweight or obese patients with diabetes mellitus; GEN — general population of overweight and obese patients; HMR – Health Management Resources; LC — low-carbohydrate version of program; LDL-c – low-density lipoprotein cholesterol; NR — not reported; P — commercial program group; ROB – risk of bias; T – telephone-based program; WW — Weight Watchers.
Figure 5. Difference in mean high-density lipoprotein cholesterol (HDL-c) change in mg/dL between commercial programs and comparators at 6 and 12 months, displayed by program type.

Panel A displays 6-month results and Panel B displays 12-month results. Diamond size is standardized across trials and does not reflect the sample size analyzed. Risk of bias (ROB) reflects overall assessment of each outcome at the time point for that trial, which were determined based on ratings of selection, detection, attrition, and reporting biases. “Attrition” reflects the percentage of participants unavailable for outcome measurement at that time point or weight measurement if N analyzed was not reported. To convert units from mg/dL to mmol/L, multiply by 0.02586. *Results reported in >1 article. †Analysis did not use intention-to-treat approach (e.g., completers’ only). ‡Between-group differences inferred from results provided (e.g., analysis of change over time in each study arm). §Overall attrition at time point. Abbreviations: C — comparator group; DM — overweight or obese patients with diabetes mellitus; GEN — general population of overweight and obese patients; HDL-c – high-density lipoprotein cholesterol; LC — low-carbohydrate version of program; NR — not reported; P — commercial program group; ROB – risk of bias; T – telephone-based program; WW — Weight Watchers.
Figure 6. Difference in mean triglyceride (TG) change in mg/dL between commercial programs and comparators at 6 and 12 months, displayed by program type.

Panel A displays 6-month results and Panel B displays 12-month results. Diamond size is standardized across trials and does not reflect the sample size analyzed. Risk of bias (ROB) reflects overall assessment of each outcome at the time point for that trial, which were determined based on ratings of selection, detection, attrition, and reporting biases. “Attrition” reflects the percentage of participants unavailable for outcome measurement at that time point or weight measurement if N analyzed was not reported. To convert units from mg/dL to mmol/L, multiply by 0.01129. *Results reported in >1 article. †Analysis did not use intention-to-treat approach (e.g., completers’ only). ‡Between-group differences inferred from results provided (e.g., analysis of change over time in each study arm). §Overall attrition at time point. Abbreviations: C — comparator group; DM — overweight or obese patients with diabetes mellitus; GEN — general population of overweight and obese patients; LC — low-carbohydrate version of program; NR — not reported; P — commercial program group; ROB – risk of bias; T – telephone-based program; TG – triglyceride; WW — Weight Watchers.
We rated the overall ROB as high for all 6- and 12-month outcomes for all trials, which was due to potential attrition bias (Supplemental Table 5).
Jenny Craig
Jenny Craig is a high-intensity program where individuals use meal replacements and participate in one-on-one counseling. Baseline mean SBP ranged from 131–133 mmHg and mean DBP ranged from 83–84 mmHg. One RCT compared blood pressure outcomes at 6 and 12 months between Jenny Craig groups (traditional and low-carbohydrate) and counseling. The Jenny Craig groups had lower mean SBP and DBP change at 6 months; however, at 12 months, SBP results were reversed for both Jenny Craig groups and DBP results were reversed for the low-carbohydrate Jenny Craig group (Figures 2 and 3). Appropriate variance estimates were not reported to determine statistical significance of the individual arms, as the trial only provided pooled variance estimates for the Jenny Craig arms when reporting between-group differences (which were statistically significant only at 6 months).
Baseline mean lipid levels varied – LDL-c ranged from 79 to 122 mg/dL, HDL-c ranged from 37–57 mg/dL, and triglycerides ranged from 99–181 mg/dL. Two trials compared lipid outcomes at 6 and 12 months between Jenny Craig groups (traditional, low-carbohydrate, telephone) and counseling; however, appropriate variance estimates were not reported for LDL-c, HDL-c, triglycerides, and total cholesterol to determine statistical significance. As compared to control/education, Jenny Craig lowered LDL-c significantly more (8.0 mg/dL greater reduction) and raised HDL-c significantly more (7.0 mg/dL greater increase) at 12 months in one trial (Figures 4 and 5).
We rated the overall ROB as high for all 6- and 12-month outcomes for all trials, which was due to potential detection and attrition biases (Supplemental Table 5).
Nutrisystem
Nutrisystem is a high-intensity program where individuals use meal replacements and participate in one-on-one or online support. Baseline mean SBP, DBP, and lipids were within the normal range (Table 1). In a single trial, Nutrisystem lowered SBP significantly more than counseling at 6 months (4.7 mmHg greater reduction)(Figure 2). No significant between-group differences existed for change in DBP, LDL-c, HDL-c, triglycerides or total cholesterol at 6 months (Figures 3–7). No trial reported 12-month results. We rated the overall ROB as moderate for all 6-month outcomes, which was due to unclear descriptions regarding elements of detection bias (Supplemental Table 5).
Health Management Resources (HMR)
HMR is a high-intensity program where individuals use very-low-calorie or low-calorie meal replacements and participate in one-on-one counseling. The one included RCT showed no statistically significant difference in LDL-c change between low-calorie HMR and counseling at 6 months (Figure 4). No trial reported 12-month results. We rated the overall ROB as high for 6-month LDL-c change, which was due to potential detection and attrition biases (Supplemental Table 5).
Medifast
Medifast is a high-intensity program where individuals use very-low-calorie or low-calorie meal replacements and participate in one-on-one counseling. Baseline mean SBP, DBP, and lipids were within the normal ranges (Table 1). In the one included RCT, Medifast lowered DBP significantly more than counseling at 12 months (4.6 mmHg greater reduction)(Figure 3), but did not significantly reduce SBP (Figure 2). No statistically significant between-group differences existed for change in LDL-c, HDL-c, triglycerides or total cholesterol (Figures 3–7). We rated the overall ROB as high for all 12-month outcomes, which was due to potential detection and attrition biases (Supplemental Table 5).
OPTIFAST
OPTIFAST is a high-intensity program where individuals use very-low-calorie or low-calorie meal replacements and participate in one-on-one counseling. Baseline mean SBP, DBP, and lipids were within the normal ranges or slightly elevated (Table 1). One RCT compared blood pressure and lipid outcomes at 6 months between OPTIFAST and counseling (Figures 2–7); however, appropriate variance estimates were not reported to determine statistical significance. No trial reported 12-month results. We rated the overall ROB as high for all 6-month outcomes, which was due to potential attrition bias (Supplemental Table 5).
SlimFast
SlimFast is a self-directed program where individuals use low-calorie meal replacements and can participate in online support. Most trials did not report variance estimates for between-group differences, which limited our ability to report statistical significance. Baseline mean SBP and DBP were within the normal range or slightly elevated (Table 1). At 6 months, one RCT found no statistically significant difference in SBP or DBP change between SlimFast and control/education (Figures 2 and 3), and another trial showed similar magnitudes of between-group differences although variance estimates were not reported in this trial. One RCT compared blood pressure at 12 months between SlimFast and control/education (Figures 2–7); however, appropriate variance estimates were not reported to determine statistical significance.
Baseline mean lipid levels varied – LDL-c ranged from 98–155 mg/dL, HDL-c ranged from 38–54 mg/dL, and triglycerides ranged from 124–217 mg/dL. Three RCTs compared lipids at 6 months between SlimFast and comparator (Figures 4–7); however, appropriate variance estimates were not reported to determine statistical significance for two trials. Two RCTs compared lipids at 12 months between SlimFast and comparator (Figures 4–7); however, appropriate variance estimates were not reported to determine statistical significance for one trial.
We rated the overall ROB as high for all 6- and 12-month outcomes for all trials, which was due to potential attrition bias (Supplemental Table 5).
Atkins
Atkins is a self-directed program where individuals follow a low-carbohydrate diet and can participate in online support. Baseline mean SBP and DBP were within the normal range (Table 1). At 6 months, four RCTs provided appropriate variance estimates to determine statistical significance of between-group SBP and DBP change (Figures 2 and 3) – three of these trials reported no significant between-group difference in SBP. All trials showed that Atkins decreased DBP more than comparator, which was statistically significant in only two trials. At 12 months, two RCTS provided appropriate variance estimates to determine statistical significance of between-group SBP and DBP change (Figures 2 and 3). Both trials showed that Atkins decreased SBP more than comparator, which was statistically significant in only one trial. Between-group difference in DBP change was not statistically significant in either trial.
Overall, eight RCTs compared change in lipids between Atkins and control/education (1 trial) or counseling (7 trials)(High ROB). Some trials did not report variance estimates for between-group differences, which limited our ability to report statistical significance. Baseline mean lipid levels varied – LDL-c ranged from 92–157 mg/dL, HDL-c ranged from 38–55 mg/dL, and triglycerides ranged from 113–190 mg/dL. At 6 months, Atkins consistently raised HDL-c and reduced triglycerides more than comparators (Figures 5A and 6A), but increased LDL-c more than comparators (Figure 4A). At 12 months, the between-group difference in LDL-c appears diminished (Figure 4B), while the improvements in HDL-c and triglycerides among Atkins participants were retained (Figure 5B and 6B). Atkins consistently raised total cholesterol more than comparators at 6 and 12 months (Figure 7), although it is unclear whether these changes are statistically significant.
We rated the overall ROB as high for 6-month and moderate 12-month blood pressure outcomes and overall ROB was high for both 6- and 12-month lipid outcomes, which was due to attrition or reporting biases (Supplemental Table 5).
The Biggest Loser Club
One RCT compared blood pressure and lipid outcomes between The Biggest Loser Club and control/education (Low ROB). This trial only reported 3-month outcomes (Supplemental Table 6).
Curves
One unpublished RCT compared lipid outcomes between Curves and control/education (Unclear ROB). This trial only reported 3-month outcomes (Supplemental Table 6).
Discussion
In 2013, AHA/ACC/TOS published guidelines for management of overweight and obesity in adults that emphasized the relationship between weight loss and improved CVD risk factors including blood pressure and cholesterol (5). Yet, it is unclear whether such long-term CVD risk factor benefits are achievable with commercial weight-loss programs, particularly those that use prepackaged foods or meal replacements, are not high intensity (less than 14 sessions over a 6-month period), or offer limited counseling/social support. This study is the first systematic review to evaluate the effect of commercial weight-loss programs on blood pressure and lipids relative to control/education or counseling. Given that the U.S. Preventive Services Task Force has recommended a healthful diet, physical activity and weight loss to prevent CVD (27), we have focused our discussion on outcomes at 12 months to capture changes beyond short-term time periods.
Currently, Weight Watchers has the largest market share of the weight loss services industry (14). As compared to control/education, Weight Watchers resulted in modest improvements in blood pressure and lipids at 12 months, which were not always statistically significant. While Weight Watchers has been shown to decrease weight significantly more than comparator (3% greater than control/education or 5.9 kg more than no diet at 12 months)(20–21), our findings do not demonstrate greater improvements in blood pressure and lipids relative to this comparator. The degree of relative weight loss achieved may have been insufficient to result in substantial between-group differences in these CVD risk factors, particularly among populations who had relatively normal blood pressure and lipids at baseline. Additional long-term RCTs evaluating Weight Watchers would enable future meta-analyses to clarify whether the modest blood pressure and lipids benefits are statistically significant.
The other two market leading programs are Jenny Craig and Nutrisystem. Both Jenny Craig and Nutrisystem encourage the use of prepackaged foods as part of their programs along with counseling that may occur one-on-one, in groups or online. Food items have variable sodium and saturated fat levels (Jenny Craig – sodium range per item: 30–660 mg; saturated fat range per item: 0–4.0 g. Nutrisystem – sodium range per item: 0–600 mg; saturated fat range per item: 0–7.0 g)(24–25). Given the high ROB for all blood pressure and lipids outcomes and lack of variance estimates reported in the Jenny Craig trials, the literature base prevents any definitive conclusions about the effect of this program on these CVD risk factors despite several studies reporting these outcomes. We found no trials of Nutrisystem that reported blood pressure and lipids at 12 months or beyond. When considering the results of our review, clinicians should note our moderate to high ROB ratings for these trials. While Jenny Craig and Nutrisystem have been shown to decrease weight significantly more than comparator (Jenny Craig: 5 to 8% greater than comparator or 6.4 kg more than no diet at 12 months at 12 months; Nutrisystem: 6% greater at 6 months)(20–21), more trials are needed to determine their effect on blood pressure and lipids.
We identified few studies that met our eligibility criteria that reported long-term blood pressure and lipids among intensive very-low-calorie or low-calorie meal replacement programs (HMR, Medifast, and OPTIFAST). We also included one self-directed program that uses low-calorie meal replacements, SlimFast, which had no consistent effects on blood pressure or lipids relative to comparators. Clinicians should note our high ROB ratings for these trials. Given the paucity of consistent evidence, we cannot draw any conclusions regarding the efficacy of these meal replacement programs on these CVD risk factors.
Atkins resulted in higher HDL-c and lower triglycerides than comparators at 12 months. These long-term conclusions should be interpreted cautiously, given these trials’ high ROB. Decreased carbohydrate intake, as Atkins promotes, has been previously shown to lower triglycerides (26), which may occur irrespective of weight loss. Epidemiologic studies have linked elevated non-fasting triglycerides with myocardial infarction (27), although whether Atkins prevents this CVD outcome is unknown.
Other programs we included were The Biggest Loser Club and Curves. The Biggest Loser Club and Curves only reported outcomes a 3 months; therefore, additional trials are needed to evaluate their long-term effects on blood pressure and lipids.
Increasingly, clinicians are being tasked with addressing obesity and CVD risk reduction with their patients. The U.S. Preventive Services Task Force has recommended that clinicians provide intensive counseling and behavioral interventions (28); however, barriers exist to implementing this practice due to limited time and counseling skill (29). Other guidelines have suggested that clinicians refer patients to high-intensity weight-loss programs where individuals engage in ≥14 sessions within a 6-month period (5), yet access to such programs varies. Commercial weight-loss programs offer a potential alternative and are available in most geographic areas. Our results outlining effects on blood pressure and lipids may help clinicians and policymakers weigh the value of commercial programs when considering the weight-loss options for their patients or beneficiaries. In our recent review of the weight loss efficacy of these programs, we suggested that clinicians could consider referring patients to Weight Watchers given the long-term weight loss benefits (20). However, they should be aware that the current evidence available for this program does not demonstrate clear benefits on blood pressure or lipids over control/education, although additional RCTs are needed to confirm this conclusion. Atkins had modest weight loss at 12 months as compared with counseling (0.1% to 2.9% greater weight loss)(20), yet showed promising 12-month benefits for some CVD risk factors. Atkins may therefore be a reasonable option for patients with dyslipidemia. Clinicians should consider making patients aware of the absence of long-term data on these CVD risk factors for other popular programs. Finally, it is important to note that the long-term benefits of modest weight loss on long-term CVD outcomes such as fatal and nonfatal myocardial infarction or stroke remain unproven (30).
While guidelines recommend weight loss for the potential CVD risk factor improvement (5,28), weight loss can have other benefits on physical and mental health that are important for patients and clinicians. For example, patients with knee osteoarthritis who achieved modest weight loss through diet and physical activity change experienced greater pain relief and improved functional status (31). Disability among obese patients can be improved with a weight loss greater than 5% (32). Weight loss achieved through lifestyle changes has also been associated with reduction in depressive symptoms (33). Given the association between obesity and certain cancers (2), weight loss may have cancer risk reduction benefits and clinical trials are ongoing investigating this theory. Future studies might also explore whether weight loss through commercial programs results in benefits for these other outcomes.
This review has limitations. First, we only examined blood pressure and lipids, as most studies were not of sufficient duration or were not designed to capture CVD endpoints such as myocardial infarction or stroke. It is also important to note that many studies only reported short-term changes in these CVD risk factors (<12 months). We have emphasized 12-month outcomes; however, future trials may consider examining longer-term outcomes at 24 months or beyond to demonstrate a sustained benefit. Second, while all studies included populations with overweight/obesity, none specifically targeted patients with underlying CVD or CVD risk factors. As a result, participants’ blood pressure was relatively controlled at many trials’ start, which may have diminished the magnitude of the programs’ effect on this outcome. It is unclear whether a more robust decrease in blood pressure may have been achieved if the trials occurred among individuals with hypertension. Similarly, relatively normal baseline lipid levels may have also decreased the magnitude of effect that could be achieved with lipid outcomes. In addition, study populations occurred predominantly among middle-aged women, who typically have lower rates of CVD and lower CVD risk than men or older women, which may have biased the results towards the null. Future studies should consider testing these programs among populations with pre-existing hypertension or dyslipidemia to establish whether CVD risk factor reduction can be achieved in these high-risk populations. We did not report any head-to-head comparisons; therefore, our review should not be used to directly compare outcomes between commercial programs as studies had different eligibility criteria and comparator groups. Results of head-to-head trials have been reported elsewhere (34). We also limited the scope of this review to RCTs of programs available across the U.S.
Finally, we particularly highlight the high ROB in nearly all studies included in this review. Most trials received support from the commercial program they were studying, which might influence the interpretation or reporting of results and estimation of intervention effect. For example, many studies did not report tests of between-group mean differences in outcomes, which raises concerns about potential reporting bias of non-significant results. Internal validity of some trials was weak due to high attrition. Statistical methods in many studies inadequately handled missing data by using completers analyses. We rated many trials as having a high ROB typically due to detection bias and/or attrition bias. Studies’ failure to report variance measures or statistical data limited our ability to synthesize data and conduct meta-analyses.
Conclusions
In summary, limited data exist regarding the long-term effects of most commercial weight-loss programs on blood pressure and lipids. We found limited evidence for long-term blood pressure or lipid improvements with Weight Watchers relative to control/education. In contrast, Atkins showed promising 12-month results with respect to improved HDL-c and triglycerides as compared to counseling. Additional well-designed, long-term trials are needed to confirm these conclusions and evaluate other commercial programs.
Supplementary Material
Acknowledgments
Funding Sources
This study had no direct funding support. RSD was supported by the Johns Hopkins medical student summer research program and the Johns Hopkins Institute for Clinical and Translational Research (ICTR), which is partly funded by the National Center for Advancing Translational Sciences (NCATS)(TL1TR001078). DKJ was supported by the Medical Student Research Program in Diabetes at JHU-UMD Diabetes Research Center from the National Institute of Diabetes and Digestive and Kidney Diseases (P30DK079637). SNB and KAG were supported by career development awards from the National Heart, Lung, and Blood Institute (K01HL096409 and K23HL116601, respectively). The contents of this publication are solely the responsibility of the authors and do not necessarily represent the official view of the Johns Hopkins ICTR, NCATS or the National Institutes of Health.
Footnotes
Disclosures
The authors have no personal conflicts of interest relevant to this article to disclose. Johns Hopkins University has an institutional consulting agreement with Healthways, Inc, which includes activities such as monitoring Innergy™, an employer-based commercial weight-loss intervention. Johns Hopkins receives fees for these services and royalty on the sales of this program.
References
- 1.Ogden CL, Carroll MD, Kit BK, Flegal KM. Prevalence of Childhood and Adult Obesity in the United States, 2011–2012. JAMA. 2014;311:806–814. doi: 10.1001/jama.2014.732. [DOI] [PMC free article] [PubMed] [Google Scholar]
- 2.Flegal KM, Graubard BI, Williamson DF, Gail MH. Cause-specific excess deaths associated with underweight, overweight, and obesity. JAMA. 2007;298:2028–37. doi: 10.1001/jama.298.17.2028. [DOI] [PubMed] [Google Scholar]
- 3.Hubert HB, Feinleib M, McNamara PM, Castelli WP. Obesity as an independent risk factor for cardiovascular disease: a 26-year follow-up of participants in the Framingham Heart Study. Circulation. 1983;67:968–977. doi: 10.1161/01.cir.67.5.968. [DOI] [PubMed] [Google Scholar]
- 4.Rexrode KM, Hennekens CH, Willett WC, Colditz GA, Stampfer MJ, Speizer FE, Manson JE. A prospective study of body mass index, weight change, and risk of stroke in women. JAMA. 1997;277:1539–1545. doi: 10.1001/jama.1997.03540430051032. [DOI] [PubMed] [Google Scholar]
- 5.Jensen MD, Ryan DH, Apovian CM, Ard JD, Comuzzie AG, Donato KA, Hu FB, Hubbard VS, Jakicic JM, Kushner RF, Loria CM, Millen BE, Nonas CA, Pi-Sunyer FX, Stevens J, Stevens VJ, Wadden TA, Wolfe BM, Yanovski SZ, Jordan HS, Kendall KA, Lux LJ, Mentor-Marcel R, Morgan LC, Trisolini MG, Wnek J, Anderson JL, Halperin JL, Albert NM, Bozkurt B, Brindis RG, Curtis LH, DeMets D, Hochman JS, Kovacs RJ, Ohman EM, Pressler SJ, Sellke FW, Shen WK, Smith SC, Jr, Tomaselli GF, American College of Cardiology/American Heart Association Task Force on Practice Guidelines 2013 AHA/ACC/TOS guideline for the management of overweight and obesity in adults: a report of the American College of Cardiology/American Heart Association Task Force on Practice Guidelines and The Obesity Society. Circulation. 2014;129:S102–38. doi: 10.1161/01.cir.0000437739.71477.ee. [DOI] [PMC free article] [PubMed] [Google Scholar]
- 6.Tuck MI, Sowers J, Dornfeld L, Kledzik G, Maxwell M. The effect of weight reduction on blood pressure, plasma renin activity and plasma aldosterone level in obese patients. N Engl J Med. 1981;304:930–933. doi: 10.1056/NEJM198104163041602. [DOI] [PubMed] [Google Scholar]
- 7.Denke MA, Sempos CT, Grundy SM. Excess body weight. An under-recognized contributor to high blood cholesterol levels in white American men. Arch Intern Med. 1993;153:1093–1103. doi: 10.1001/archinte.153.9.1093. [DOI] [PubMed] [Google Scholar]
- 8.Denke MA, Sempos CT, Grundy SM. Excess body weight. An under-recognized contributor to high blood cholesterol levels in white American women. Arch Intern Med. 1994;154:401–10. doi: 10.1001/archinte.154.4.401. [DOI] [PubMed] [Google Scholar]
- 9.Reisin E, Abel R, Modan M, Silverberg DS, Eliahou HE, Modan B. Effect of weight loss without salt restriction on the reduction of blood pressure in overweight hypertensive patients. N Engl J Med. 1978;298:1–6. doi: 10.1056/NEJM197801052980101. [DOI] [PubMed] [Google Scholar]
- 10.Appel LJ, Champagne CM, Harsha DW, Cooper LS, Obarzanek E, Elmer PJ, Stevens VJ, Vollmer WM, Lin PH, Svetkey LP, Stedman SW, Young DR, Writing Group of the PREMIER Collaborative Research Group Effects of comprehensive lifestyle modification on blood pressure control: main results of the PREMIER clinical trial. JAMA. 2003;289:2083–93. doi: 10.1001/jama.289.16.2083. [DOI] [PubMed] [Google Scholar]
- 11.Seven E, Husemoen LL, Wachtell K, Ibsen H, Linneberg A, Jeppesen JL. Five-year weight changes associate with blood pressure alterations independent of changes in serum insulin. J Hypertens. 2014;32:2231–7. doi: 10.1097/HJH.0000000000000317. [DOI] [PubMed] [Google Scholar]
- 12.Bazzano LA, Hu T, Reynolds K, Yao L, Bunol C, Liu Y, Chen CS, Klag MJ, Whelton PK, He J. Effects of low-carbohydrate and low-fat diets: a randomized controlled trial. Ann Intern Med. 2014;161:309–18. doi: 10.7326/M14-0180. [DOI] [PMC free article] [PubMed] [Google Scholar]
- 13.Saad L. To lose weight, Americans rely more on dieting than exercise. Gallup Poll Social Series: Health and Healthcare. 2011 Accessed at www.gallup.com/poll/150986/Lose-Weight-Americans-Rely-Dieting-Exercise.aspx on 27 September 2014.
- 14.IBISWorld. Weight loss services in the US industry market research report. Los Angeles: IBISWorld; Jul, 2015. 2014. Accessed at http://clients1.ibisworld.com/reports/us/industry/default.aspx?entid=1719 on 6 January 2016. [Google Scholar]
- 15.Mitchell NS, Ellison MC, Hill JO, Tsai AG. Evaluation of the effectiveness of making Weight Watchers available to Tennessee Medic- aid (TennCare) recipients. J Gen Intern Med. 2013;28:12–7. doi: 10.1007/s11606-012-2083-8. [DOI] [PMC free article] [PubMed] [Google Scholar]
- 16.Weaver CM, Dwyer J, Fulgoni VL, King JC, Leveille GA, MacDonald RS, Ordovas J, Schnakenberg D. Processed foods: contributions to nutrition. Am J Clin Nutr. 2014;99:1525–42. doi: 10.3945/ajcn.114.089284. [DOI] [PMC free article] [PubMed] [Google Scholar]
- 17.Poti JM, Mendez MA, Ng SW, Popkin BM. Is the degree of food processing and convenience linked with the nutritional quality of foods purchased by US households? Am J Clin Nutr. 2015;101:1251–62. doi: 10.3945/ajcn.114.100925. [DOI] [PMC free article] [PubMed] [Google Scholar]
- 18.U.S. Department of Health and Human Services and U.S. Department of Agriculture. 2015–2020 Dietary Guidelines for Americans. (8th) 2015 Dec; Accessed at http://health.gov/dietaryguidelines/2015/guidelines/ on 20 January 2016.
- 19.Tsai AG, Wadden TA. Systematic review: an evaluation of major commercial weight loss programs in the United States. Ann Intern Med. 2005;142:56–66. doi: 10.7326/0003-4819-142-1-200501040-00012. [DOI] [PubMed] [Google Scholar]
- 20.Gudzune KA, Doshi RS, Mehta AK, Chaudhry ZW, Jacobs DK, Vakil RM, Lee CJ, Bleich SN, Clark JM. Efficacy of commercial weight-loss programs: an updated systematic review. Ann Intern Med. 2015;162:501–12. doi: 10.7326/M14-2238. [DOI] [PMC free article] [PubMed] [Google Scholar]
- 21.Johnston BC, Kanters S, Bandayrel K, Wu P, Naji F, Siemieniuk RA, Ball GD, Busse JW, Thorlund K, Guyatt G, Jansen JP, Mills EJ. Comparison of weight loss among named diet programs in overweight and obese adults: a meta-analysis. JAMA. 2014;312:923–33. doi: 10.1001/jama.2014.10397. [DOI] [PubMed] [Google Scholar]
- 22.Chaudhry ZW, Doshi RS, Mehta AK, Jacobs DK, Vakil RM, Lee CJ, Kalyani R, Bleich SN, Clark JM, Gudzune KA. Commercial weight loss programs’ effect on glycemic outcomes among adutls with and without diabetes: a systematic review. Obes Rev. 2016 doi: 10.1111/obr.12423. (in press) [DOI] [PMC free article] [PubMed] [Google Scholar]
- 23.Higgins JPT, Green S, editors. Cochrane Handbook for Systematic Reviews of Interventions, Version 5.1.0. The Cochrane Collaboration. 2011 Accessed at http://www.cochrane-handbook.org on 1 October 2013.
- 24.Jenny Craig. Cuisine. Accessed at http://www.jennycraig.com/site/cuisine/cuisine.jsp on 6 January 2016.
- 25.Nutrisystem. Our Food. Accessed at http://www.nutrisystem.com/jsps_hmr/catalog/menu/food.jspn6 on 6 January 2016.
- 26.Hu T, Mills KT, Yao L, Demanelis K, Eloustaz M, Yancy WS, Kelly TN, He J, Bazzano LA. Effects of low-carbohydrate diets versus low-fat diets on metabolic risk factors: a meta-analysis of randomized controlled clinical trials. Am J Epidemiol. 2012;176(Suppl7):S44–54. doi: 10.1093/aje/kws264. [DOI] [PMC free article] [PubMed] [Google Scholar]
- 27.Langsted A, Freiberg JJ, Tybjaerg-Hansen A, Schnohr P, Jensen GB, Nordestgaard BG. Nonfasting cholesterol and triglycerides and association with risk of myocardial infarction and total mortality: the Copenhagen City Heart Study with 31 years of follow-up. J Intern Med. 2011;270:65–75. doi: 10.1111/j.1365-2796.2010.02333.x. [DOI] [PubMed] [Google Scholar]
- 28.LeFevre ML, U.S. Preventive Services Task Force Behavioral Counseling to Promote a Healthful Diet and Physical Activity for Cardiovascular Disease Prevention in Adults With Cardiovascular Risk Factors: U.S. Preventive Services Task Force Recommendation Statement. Ann Intern Med. 2014;161:587–93. doi: 10.7326/M14-1796. [DOI] [PubMed] [Google Scholar]
- 29.Kushner RF. Barriers to providing nutrition counseling by physicians: a survey of primary care practitioners. Prev Med. 1995;24:546–52. doi: 10.1006/pmed.1995.1087. [DOI] [PubMed] [Google Scholar]
- 30.Look AHEAD Research Group. Wing RR, Bolin P, Brancati FL, Bray GA, Clark JM, Coday M, Crow RS, Curtis JM, Egan CM, Espeland MA, Evans M, Forety JP, Ghazarian S, Gregg EW, Harrison B, Haxuda HP, Hill JO, Horton ES, Hubbard VS, Jakicic JM, Jeffery RW, Johnson KC, Kahn Se, Kitabchi AE, Knowler WC, Lewis CE, Maschak-Carey BJ, Montez MG, Murillo A, Nathan DM, Patricio J, Peters A, Pi-sunyer X, Pownall H, Reboussin D, Regensteiner JG, Rickman AD, Ryan DH, Safford M, Wadden TA, Wagenknecht LE, West DS, Williamson DF, Yanovski SZ. Cardiovascular effects of intensive lifestyle intervention in type 2 diabetes. N Engl J Med. 2013;369:145–54. doi: 10.1056/NEJMoa1212914. [DOI] [PMC free article] [PubMed] [Google Scholar]
- 31.Messier SP, Loeser RF, Miller GD, Morgan TM, Rejeski WJ, Sevick MA, Ettinger WH, Pahor M, Williamson JD. Exercise and dietary weight loss in overweight and obese older adults with knee osteoarthritis: the arthritis, diet, and activity promotion trial. Arthritis Rheum. 2004;50:1501–10. doi: 10.1002/art.20256. [DOI] [PubMed] [Google Scholar]
- 32.Christensen R, Bartels EM, Astrup A, Bliddal H. Effect of weight reduction in obese patients diagnosed with knee osteoarthritis: a systematic review and meta-analysis. Ann Rheum Dis. 2007;66:433–9. doi: 10.1136/ard.2006.065904. [DOI] [PMC free article] [PubMed] [Google Scholar]
- 33.Fabricatore AN, Wadden TA, Higginbotham AJ, Faulconbridge LF, Nguyen AM, Heymsfield SB, Faith MS. Intentional weight loss and changes in symptoms of depression: a systematic review and meta-analysis. Int J Obes (Lond) 2011;35:1363–76. doi: 10.1038/ijo.2011.2. [DOI] [PMC free article] [PubMed] [Google Scholar]
- 34.Vakil RM, Doshi RS, Mehta AK, Chaudhry ZW, Jacobs DK, Lee CJ, Bleich SN, Clark JM, Gudzune KA. Direct comparisons of commercial weight-loss programs on weight, waist circumference, and blood pressure: a systematic review. BMC Public Health. 2016 doi: 10.1186/s12889-016-3112-z. (in press) [DOI] [PMC free article] [PubMed] [Google Scholar]
Associated Data
This section collects any data citations, data availability statements, or supplementary materials included in this article.