

Abstract
Allostatic load (AL) is a complex clinical construct, providing a unique window into the cumulative impact of stress. However, due to its inherent complexity, AL presents two major measurement challenges to conventional statistical modeling (the field’s dominant methodology): it is comprised of a complex causal network of bioallostatic systems, represented by an even larger set of dynamic biomarkers; and, it is situated within a web of antecedent socioecological systems, linking AL to differences in health outcomes and disparities. To address these challenges, we employed case-based computational modeling (CBM), which allowed us to make four advances: (1) we developed a multisystem, 7-factor (20 biomarker) model of AL’s network of allostatic systems; (2) used it to create a catalog of nine different clinical AL profiles (causal pathways); (3) linked each clinical profile to a typology of 23 health outcomes; and (4) explored our results (post hoc) as a function of gender, a key socioecological factor. In terms of highlights, (a) the Healthy clinical profile had few health risks; (b) the pro-inflammatory profile linked to high blood pressure and diabetes; (c) Low Stress Hormones linked to heart disease, TIA/Stroke, diabetes, and circulation problems; and (d) high stress hormones linked to heart disease and high blood pressure. Post hoc analyses also found that males were overrepresented on the High Blood Pressure (61.2%), Metabolic Syndrome (63.2%), High Stress Hormones (66.4%), and High Blood Sugar (57.1%); while females were overrepresented on the Healthy (81.9%), Low Stress Hormones (66.3%), and Low Stress Antagonists (stress buffers) (95.4%) profiles.
Keywords: allostatic load, health risk outcomes, complexity theory, artificial neural nets, computational modeling, case-based modeling
INTRODUCTION
Allostatic Load as a Complex System
Allostatic load (AL) is a highly useful framework—introduced by McEwen and colleagues [1–7]—for understanding the cumulative health costs (“wear and tear”) associated with stress, particularly short-term-intense or chronic distress.
The theoretical framework for AL follows a complex, multidimensional and multilevel trajectory: situated within a wider set of intersecting socioecological systems (i.e., poverty traps, high-stress workplaces, combat, etc), an individual’s perceived distress (i.e., stress overload, lack of control, etc) causes many of the body’s key allostatic systems—a complex, nonlinear network of interactive and adaptive mediators (e.g., blood pressure, cardiovascular, metabolic, etc)—to shift into a state of relative disequilibrium to maintain wellbeing [6]. Often times, particularly when distress is short-term-intense or chronic, this sustained disequilibrium can lead to dysregulation, which can cause significant dysfunction/damage to these allostatic systems; which, in turn, can lead to significant, negative health outcomes (e.g., heart disease, cancer, depression, alcoholism, PTSD) [1–7].
Given its theoretical complexity, AL has shown great potential as an interdisciplinary tool for assessing cumulative health risk [7–11]. For example, as Gallo et al. state, “In contrast to the common practice of examining risk factors within a single physiological system, the allostatic load framework provides an integrative approach that may better characterize the cumulative impact of dynamic and nonlinear influences across major biological regulatory systems.” [12] In this way, AL links to a variety of fields (from medical sociology and medicine to human biology and public health) focused on the negative impact that stress events have on health and wellbeing; particularly across the life-course and across different antecedent socioecological factors such as gender, age, ethnicity, mental status, psychological trauma, residence, occupation and—a current major focus—health disparities [8–11,13–19]. For example, regarding health disparities, Beckie [19] states, “The theoretical constructs of allostasis and allostatic load (AL) have contributed to our understanding of how constantly changing social and environmental factors impact physiological functioning and shape health and aging disparities, particularly along socioeconomic, gendered, racial, and ethnic lines” (p. 311).
The Challenge of Measuring AL
Given its potential as an interdisciplinary index of personal and public health, researchers have developed a variety of ways to measure AL [7,17–19]. The challenge, however, is built into the very nature of what makes AL unique: it is a complex, dynamic, evolving network of intersecting allostatic systems, which are situated within a wider web of intersecting socioecological systems [7,17–21]. In other words, the study of AL is a complex systems problem.
When complexity scientists say AL is a complex system problem, they mean that, like many personal and public health issue, AL displays the key characteristics associated with a complex system—that is, it is nonlinear, emergent, self-organizing, multidimensional, multilevel, multisystems, network-based, etc [14,22–30]. From a measurement perspective, these challenges strains the limitations of conventional statistics. In the case of AL, such challenges amount to four key issues:
First, given its multisystem network of complexity, there is the issue of what biomarker panel best operationalizes AL; and, related, how this panel is best theoretically combined to represent the underlying factor analytic structure of AL [6,7,10,18–21]. As Gallo et al. [12] point out, while AL “is typically operationalized as a composite of biological markers representing multiple systems, especially the neuroendocrine, cardiovascular, metabolic, and immune systems,” existing methods struggle to model such a level of causal complexity (p. 479).
Second, per the conventions of a biomedical approach to statistics, AL is typically measured as a composite index [7,18–21]. In addition to the restricted predictive value of this approach [7,18–21], dichotomizing biomarkers to achieve a composite score (as is often done) dilutes personal and group differences and variability. Also, any sort of “summing” of the biomarkers in a study potentially gives equal weight to all markers. And, finally, reducing AL to a single composite score negates the ability to evaluate complex causal patterns among the biomarkers [7,9–11,18–21]—which takes us back to the first challenge and also leads to the next challenge.
Third, there is the issue of how AL is differentially expressed in groups. As Gruenewald et al. [20] have shown empirically, there are multiple causal pathways for AL; expressed in the form of multiple AL profiles. Furthermore, these profile differences will vary as a function of (1) differences in antecedent socioecological factors and (2) differences in antecedent bioallostatic makeup. These insights [12], which we seek to advance, have significant implication for clinical care, allowing for the development of multiple treatment approaches—at the personal and public health levels—based on differences in AL profiles and their corresponding differential health outcomes.
Fourth, there is the issue of time. The majority of studies, to date, are cross–sectional. More longitudinal research is therefore necessary, examining AL for different subpopulations and cohorts as they evolve across time/space [7,18–21].
Purpose of Current Study
Hence we come to the purpose of the current study: we seek to advance the measurement of AL by modeling it as a complex system, situated within a network of larger socioecological systems, based on the methodological tools of case-based computational modeling (CBM). More specifically, we seek to answer the following three questions: Is AL, as a complex system, comprised of multiple causal pathways, such that different types of AL clinical profiles exist? Second, do these profiles link to subsequent health risk typologies? And, third, do these profiles/outcomes manifest themselves differently within the larger socioecological systems in which AL is situated? These are the three research foci of the current study. To address them, we turned to the tools of CBM.
Case-Based Computational Modeling
As already alluded to above, the complexity sciences constitute an across-the-academy field of study, focused on rethinking scientific inquiry from a complex systems perspective [22–24]. Much of this rethinking is focused on method, particularly computational modeling, which uses high-powered computers and brute-force algorithms to arrive at “approximate” models for highly complex data [22–25]. Examples include genetic algorithms, agent-based modeling, networks, and more recently, CBM [23,25–30].
For those new to CBM, several quick comments are necessary. CBM combines case-comparative method with the various theoretical and methodological tools of the computational and complexity sciences to advance the modeling of complex (social and health) systems; which it does by treating complex systems as sets of cases (i.e., k-dimensional vectors/profiles) [27–30]. Such an approach is a useful addition to current method, as it helps health and medical researchers ask different types of questions, based on cases [23,25–28]. In terms of the current study, for example, it allowed us to ask our three research question—which brings us to the CBM platform used for the current study, the SACS Toolkit [27–30].
The SACS Toolkit—which the second author of the current study and colleagues have developed [27–30]—focuses on cases, specifically how they aggregate and cluster into similar groups in highly complex, multidimensional big data. (For a complete overview, see Refs. 27–30.) In terms of the current study and our three research foci, the strength of the SACS Toolkit is its ability to: (1) identify subgroup differences (profiles) among highly complex data; (2) examine how these profiles link to different typologies or health risk outcomes; and (3) explore how these AL clinical profiles/health risk outcomes emerge within the larger socioecological systems in which they are situated. Our study proceeded as follows:
Step 1
First, we used the SACS Toolkit to develop a multisystem factor-analytic measure of AL; which, we argue, makes the following advances. It allows researchers to: (a) bypass simplistic indices of AL; (b) suggest a preferred approach to constructing a biomarker panel; (c) engage in a theoretical exploration of different causal pathways among key AL subsystems; and (d) preserve the multisystem complexity of AL while (simultaneously) decomposing it onto a meaningful set of factors. In terms of establishing a preferred approach to constructing a biomarker panel, we followed the theoretical framework of McEwen et al. [1–5,7] and Seeman et al. [8–11] focusing on twenty key components of major allostatic systems (see METHODS).
As a final point, our approach, while novel, builds on previous research [7,21,31], specifically a preliminary factor analysis conducted by the first author of this paper [21]; which Seeman et al. [8] have already successfully used to examine health disparities based on social status, suggesting our measure’s utility. In terms of the current study, we advance the first authors preliminary factor analysis by (a) studying a larger sample, (b) situating our results within a complex multisystems framework; and (c) using our results to construct complex AL clinical profiles—which takes us to the next step.
Step 2
Second, we used the SACS Toolkit to construct a catalog of AL clinical profiles (see Table 3 and METHODS for details), based on subject scores from our factor analytic solution (See Table 1). In terms of advancement, this clinical catalog allows for a more complex and nuanced understanding of AL, based on the idea that AL is comprised of multiple clinical profiles, each demonstrating a unique set of causal pathways among the underlying latent seven-factor structure of AL. Such a view can not only advance how AL manifests itself among different populations, but it also can advance AL as a form of personalized medicine, based on subgroup variations in antecedent bioallostatic makeup and socioecological factors.
TABLE 3.
Allostatic Load Clusters and Their Differences on Key Self-Reported Health Measures
| Clustera
| |||||||||||||||||||
|---|---|---|---|---|---|---|---|---|---|---|---|---|---|---|---|---|---|---|---|
| Health Assessmentb | 1 | 2 | 3 | 4 | 5 | 6 | 7 | 8 | 9 | ||||||||||
| Low Cholesterol |
Healthy |
High BP |
Low Stress Hormone |
Metabolic Syndrome |
Hi Blood Sugar |
Low Stress Antagonist |
High Stress Hormone |
High Pro- Inflammatory |
|||||||||||
| Yes | No | Yes | No | Yes | No | Yes | No | Yes | No | Yes | No | Yes | No | Yes | No | Yes | No | ||
| Heart disease | Observedc | 15 | 81 | 1 | 137 | 10 | 145 | 12 | 157 | 7 | 136 | 8 | 26 | 24 | 85 | 26 | 119 | 27 | 75 |
| Expected | 11.40 | 84.60 | 16.40 | 121.60 | 18.50 | 136.50 | 20.10 | 148.90 | 17 | 126.00 | 4.10 | 29.90 | 13.00 | 96.00 | 17.30 | 127.70 | 12.20 | 89.80 | |
| High blood pressure | Observed | 29 | 63 | 8 | 129 | 49 | 102 | 58 | 110 | 61 | 81 | 15 | 20 | 51 | 55 | 63 | 82 | 61 | 42 |
| Expected | 33.89 | 58.68 | 49.92 | 86.45 | 55.75 | 96.54 | 61.22 | 106.01 | 52.47 | 90.86 | 12.75 | 22.08 | 38.63 | 66.89 | 52.84 | 91.49 | 37.53 | 64.99 | |
| Circulation problems | Observed | 9 | 86 | 9 | 128 | 12 | 139 | 10 | 157 | 16 | 128 | 7 | 28 | 15 | 93 | 11 | 130 | 20 | 78 |
| Expected | 9.61 | 85.30 | 13.87 | 123.01 | 15.38 | 136.48 | 16.90 | 149.94 | 14.57 | 129.29 | 3.54 | 31.43 | 10.93 | 96.97 | 14.27 | 126.60 | 9.92 | 87.99 | |
| blood clots | Observed | 5 | 91 | 4 | 134 | 4 | 151 | 11 | 157 | 5 | 139 | 4 | 31 | 6 | 102 | 9 | 137 | 13 | 91 |
| Expected | 5.35 | 90.65 | 7.69 | 130.31 | 8.64 | 146.36 | 9.37 | 158.63 | 8.03 | 135.97 | 1.95 | 33.05 | 6.02 | 101.98 | 8.14 | 137.86 | 5.80 | 98.20 | |
| Heart murmur | Observed | 12 | 83 | 14 | 124 | 17 | 138 | 28 | 139 | 19 | 124 | 4 | 31 | 16 | 90 | 28 | 116 | 18 | 85 |
| Expected | 13.63 | 81.28 | 19.80 | 118.07 | 22.24 | 132.61 | 24.11 | 143.74 | 20.52 | 122.35 | 5.02 | 29.94 | 15.21 | 90.69 | 20.67 | 123.20 | 14.78 | 88.12 | |
| TIA/stroke | Observed | 6 | 90 | 2 | 136 | 6 | 149 | 2 | 165 | 4 | 139 | 2 | 33 | 6 | 101 | 8 | 138 | 7 | 97 |
| Expected | 3.78 | 92.13 | 5.43 | 132.44 | 6.10 | 148.75 | 6.58 | 160.27 | 5.67 | 138.20 | 1.38 | 33.59 | 4.21 | 102.69 | 5.75 | 140.12 | 4.10 | 99.81 | |
| Anemia | Observed | 17 | 79 | 27 | 110 | 13 | 142 | 36 | 133 | 13 | 130 | 4 | 31 | 26 | 83 | 11 | 135 | 16 | 87 |
| Expected | 14.32 | 81.68 | 20.43 | 116.57 | 23.12 | 131.88 | 25.20 | 143.80 | 21.33 | 121.67 | 5.22 | 29.78 | 16.26 | 92.74 | 21.77 | 124.20 | 15.36 | 87.64 | |
| Cholesterol problems | Observed | 42 | 53 | 28 | 110 | 38 | 111 | 79 | 87 | 83 | 57 | 19 | 14 | 49 | 57 | 66 | 78 | 68 | 35 |
| Expected | 41.52 | 52.95 | 60.31 | 76.92 | 65.99 | 84.17 | 72.99 | 93.09 | 61.62 | 78.59 | 14.86 | 18.95 | 46.76 | 59.64 | 62.93 | 80.27 | 45.01 | 57.41 | |
| Diabetes | Observed | 2 | 93 | 4 | 134 | 6 | 149 | 10 | 159 | 11 | 133 | 28 | 7 | 6 | 103.0 | 19 | 126 | 37 | 65 |
| Expected | 10.68 | 84.15 | 15.52 | 122.23 | 17.43 | 137.29 | 19.00 | 149.69 | 16.19 | 127.55 | 3.94 | 31.00 | 12.26 | 96.55 | 16.41 | 129.32 | 11.58 | 91.23 | |
| Asthma | Observed | 13 | 83 | 11 | 127 | 16 | 139 | 18 | 150 | 23 | 121 | 3 | 31 | 16 | 92 | 14 | 130 | 19 | 85 |
| Expected | 11.69 | 84.22 | 16.81 | 121.07 | 18.88 | 135.98 | 20.58 | 148.26 | 17.54 | 126.33 | 4.14 | 29.83 | 13.15 | 94.75 | 17.54 | 126.33 | 12.67 | 91.24 | |
| Emphysema/COPD | Observed | 2 | 93 | 5 | 133 | 1 | 154 | 3 | 165 | 2 | 142 | 1 | 34 | 5 | 103 | 4 | 141 | 8 | 96 |
| Expected | 2.69 | 92.22 | 3.91 | 133.96 | 4.40 | 150.46 | 4.79 | 164.05 | 4.08 | 139.78 | 0.99 | 33.98 | 3.06 | 104.84 | 4.11 | 140.75 | 2.95 | 100.96 | |
| Tuberculosis | Observed | 1 | 95 | 2 | 136 | 0 | 155 | 0 | 168 | 1 | 143 | 0 | 35 | 1 | 108 | 0 | 146 | 1 | 103 |
| Expected | 0.53 | 95.47 | 0.76 | 137.24 | 0.85 | 154.15 | 0.92 | 167.08 | 0.79 | 143.21 | 0.19 | 34.81 | 0.60 | 108.40 | 0.80 | 145.20 | 0.57 | 103.43 | |
| Positive TB skin test | Observed | 5 | 90 | 8 | 130 | 7 | 146 | 11 | 158 | 6 | 137 | 7 | 28 | 13 | 96 | 18 | 126 | 14 | 90 |
| Expected | 7.76 | 87.24 | 11.27 | 126.73 | 12.49 | 140.51 | 13.80 | 155.20 | 11.68 | 131.32 | 2.86 | 32.14 | 8.90 | 100.10 | 11.76 | 132.24 | 8.49 | 95.51 | |
| Thyroid disease | Observed | 14 | 81 | 17 | 121 | 17 | 138 | 25 | 144 | 14 | 130 | 4 | 31 | 22 | 87 | 10 | 135 | 16 | 88 |
| Expected | 12.19 | 83.73 | 17.52 | 120.36 | 19.68 | 135.18 | 21.45 | 147.39 | 18.28 | 125.59 | 4.44 | 30.53 | 13.84 | 95.06 | 18.41 | 126.46 | 13.20 | 90.70 | |
| Peptic ulcer | Observed | 2 | 93 | 3 | 133 | 5 | 149 | 16 | 151 | 8 | 135 | 0 | 34 | 8 | 101 | 7 | 138 | 7 | 96 |
| Expected | 4.90 | 90.10 | 7.01 | 128.99 | 7.94 | 146.06 | 8.61 | 158.39 | 7.37 | 135.63 | 1.75 | 32.25 | 5.62 | 103.38 | 7.48 | 137.52 | 5.31 | 97.69 | |
| Cancer | Observed | 16 | 80 | 22 | 116 | 10 | 144 | 18 | 151 | 21 | 122 | 4 | 31 | 22 | 87 | 21 | 124 | 23 | 81 |
| Expected | 13.79 | 82.21 | 19.82 | 118.18 | 22.12 | 131.88 | 24.28 | 144.72 | 20.54 | 122.46 | 5.03 | 29.97 | 15.66 | 93.34 | 20.83 | 124.17 | 14.94 | 89.06 | |
| Colon polyp | Observed | 18 | 77 | 17 | 121 | 19 | 136 | 35 | 133 | 22 | 121 | 8 | 26 | 31 | 78 | 30 | 115 | 28 | 74 |
| Expected | 18.13 | 76.78 | 26.33 | 111.54 | 29.58 | 125.28 | 32.25 | 136.60 | 27.29 | 115.58 | 6.49 | 27.48 | 20.80 | 88.10 | 27.67 | 117.20 | 19.46 | 82.44 | |
| Arthritis | Observed | 30 | 61 | 35 | 99 | 59 | 93 | 71 | 94 | 69 | 74 | 17 | 17 | 65 | 38 | 59 | 84 | 56 | 41 |
| Expected | 39.50 | 51.50 | 58.17 | 75.83 | 65.98 | 86.02 | 71.62 | 93.38 | 62.07 | 80.93 | 14.76 | 19.24 | 44.71 | 58.29 | 62.07 | 80.93 | 42.11 | 54.89 | |
| Glaucoma | Observed | 3 | 93 | 5 | 133 | 6 | 148 | 8 | 159 | 2 | 142 | 0 | 35 | 7 | 101 | 4 | 141 | 7 | 97 |
| Expected | 3.69 | 92.14 | 5.30 | 132.44 | 5.92 | 147.80 | 6.46 | 161.24 | 5.53 | 138.20 | 1.34 | 33.59 | 4.15 | 103.65 | 5.61 | 140.12 | 4.00 | 99.81 | |
| Liver cirrhosis | Observed | 2 | 94 | 1 | 137 | 3 | 152 | 4 | 165 | 3 | 141 | 0 | 35 | 1 | 107 | 3 | 143 | 4 | 99 |
| Expected | 1.84 | 94.16 | 2.65 | 135.35 | 2.98 | 152.02 | 3.24 | 165.76 | 2.76 | 141.24 | 0.67 | 34.33 | 2.07 | 105.93 | 2.80 | 143.20 | 1.98 | 101.02 | |
| Alcoholism | Observed | 6 | 90 | 3 | 135 | 9 | 145 | 3 | 166 | 2 | 139 | 0 | 35 | 2 | 106 | 4 | 142 | 3 | 101 |
| Expected | 2.82 | 93.18 | 4.05 | 133.95 | 4.52 | 149.48 | 4.96 | 164.04 | 4.14 | 136.86 | 1.03 | 33.97 | 3.17 | 104.83 | 4.28 | 141.72 | 3.05 | 100.95 | |
| Depression | Observed | 24 | 71 | 29 | 105 | 25 | 130 | 50 | 117 | 38 | 105 | 7 | 28 | 30 | 78 | 26 | 118 | 26 | 75 |
| Expected | 22.39 | 72.61 | 31.58 | 102.42 | 36.53 | 118.47 | 39.36 | 127.64 | 33.70 | 109.30 | 8.25 | 26.75 | 25.45 | 82.55 | 33.94 | 110.06 | 23.80 | 77.20 | |
| Blood transfusion | Observed | 7 | 88 | 7 | 128 | 11 | 141 | 20 | 146 | 7 | 134 | 5 | 30 | 19 | 88 | 9 | 136 | 22 | 78 |
| Expected | 9.45 | 85.55 | 13.42 | 121.58 | 15.12 | 136.88 | 16.51 | 149.49 | 14.02 | 126.98 | 3.48 | 31.52 | 10.64 | 96.36 | 14.42 | 130.58 | 9.94 | 90.06 | |
Clusters from the nine-cluster solution shown in Table 2.
Health Assessments used in StudyÅsee Methods section for more details.
Logistic regression was used to test the overall chi-square obtained when testing membership in all clusters. The current table was created for visual inspection of obvious patterns in terms of comparing observed frequency to expected frequency across all nine clusters.
TABLE 1.
Allostatic Load Seven Factor Structure Solution
| Factors/Componentsa
| |||||||
|---|---|---|---|---|---|---|---|
| Biomarkers | Blood Pressure | Metabolic Syndrome | Cholesterol | Pro-Inflammatory Elements | Stress Hormones | Blood Sugar | Stress Antagonists |
| Systolic BPb | 0.880 | 0.158 | 0.060 | 0.132 | 0.054 | 0.130 | −0.106 |
| Diastolic BPb | 0.883 | 0.181 | 0.120 | −0.052 | 0.141 | 0.020 | 0.220 |
| Waist to hip ratio | 0.305 | 0.700 | −0.090 | 0.113 | 0.150 | 0.308 | 0.294 |
| HDLc | −0.096 | −0.829 | 0.103 | −0.084 | −0.191 | −0.129 | −0.122 |
| Insulin | 0.082 | 0.677 | 0.030 | 0.379 | 0.025 | 0.411 | −0.007 |
| Triglycerides | 0.164 | 0.786 | 0.297 | 0.113 | 0.039 | 0.235 | −0.093 |
| Total cholesterol | 0.099 | −0.005 | 0.980 | 0.021 | −0.033 | 0.011 | −0.011 |
| LDLd | 0.098 | 0.095 | 0.935 | 0.021 | 0.040 | −0.077 | 0.093 |
| IL6e | 0.030 | 0.271 | −0.141 | 0.786 | 0.000 | 0.169 | −0.257 |
| Fibrinogen | 0.001 | −0.009 | 0.092 | 0.804 | −0.037 | 0.148 | −0.096 |
| C Reactive proteins | 0.071 | 0.249 | 0.100 | 0.816 | 0.033 | 0.185 | −0.259 |
| Cortisol | 0.094 | −0.046 | −0.008 | −0.119 | 0.613 | −0.093 | 0.264 |
| Norepinephrine | 0.124 | 0.237 | 0.006 | 0.124 | 0.889 | 0.075 | −0.001 |
| Epinephrine | 0.112 | 0.077 | −0.028 | −0.085 | 0.855 | −0.016 | 0.178 |
| Dopamine | 0.044 | 0.190 | 0.000 | 0.020 | 0.888 | −0.006 | 0.124 |
| Hemoglobin A1c | 0.036 | 0.208 | −0.059 | 0.238 | −0.018 | 0.887 | −0.163 |
| Glucose | 0.115 | 0.355 | −0.015 | 0.130 | 0.006 | 0.895 | −0.015 |
| DHEASf | −0.005 | 0.127 | 0.110 | −0.098 | 0.226 | −0.005 | 0.729 |
| Peak flow | 0.208 | 0.307 | −0.089 | −0.286 | 0.111 | −0.004 | 0.629 |
| IGF-1g | 0.031 | −0.081 | 0.020 | −0.190 | 0.026 | −0.162 | 0.719 |
The allostatic load factor structure was obtained using a principal components analysis with promax solution. Biomarkers were retained for the factor on which they loaded the highest, with a minimum loading of .613.
Blood pressure.
High-density lipoprotein.
Low-density lipoprotein.
Interleukin 6.
Dehydroepiandrosterone sulfate.
Insulin-like growth factor.
The bold values indicate the most important factor loadings for each of the factors.
Step 3
Third, we used CBM to create a health risk outcomes typology for each AL profile. For our study, we hypothesize that our AL profiles, once identified, would reflect group differences in overall biological health or conversely dysregulation. In terms of advancement, such a health risk typology can be used to assess and potentially predict future health risk outcomes based on the current AL of a patient or group of people, allowing for improved personalized and more focused prevention and treatment.
Step 4
Finally, we examined how the complexities of AL link to its larger web of antecedent socioecological systems—which we did by exploring (post hoc) how gender correlates with our results. In terms of advancement, our post hoc analysis is potentially useful, as it allows researchers and clinicians to see how the complexities of AL link to differences in the short-or long-term health of different groups.
Three Caveats
Before we proceed, however, three caveats are needed. First, the exploratory nature of our study needs to be acknowledged: it seeks to push the current methodological paradigm. Second, given the limitations of any one study, we did not address all five “measurement” issues above. For example, while more longitudinal research is necessary, our study is based on a cross-sectional, middle-aged sample (Mean Age = 55.0; SD = 11.8; see METHODS). Third, while there may be merit in exploring the factor analytic structure of AL based on sex or ethnicity, current research suggests otherwise. As Seeman et al. [10] concluded: “We sought to test a hypothesized metafactor model of AL composed of a number of biological system factors, and to investigate model invariance across sex and ethnicity…. A “metafactor” model of AL as an aggregate measure of six underlying latent biological subfactors was found to fit the data…. There was little evidence of model variance across sex and/or ethnicity” (p. 463).
METHOD
Subjects
For this study, we utilized archival data from the Midlife Development in the United States (MIDUS) study, a national survey by the MacArthur Midlife Research Network in 1994/1995, which included data from over 7000 Americans aged 25–74 [32,33]. The purpose of the survey was broad, investigating the role of behavioral, psychological, and social variables on a variety of health outcome measures. In 2002, the University of Wisconsin-Madison carried out a longitudinal follow-up of the original MIDUS respondents. This second initiative (MIDUS II) had five research foci, one of which included comprehensive biomarker assessments obtained from a subsample of MIDUS respondents [32,33].
For the current study, the number of subjects with valid biomarker data used was N = 1151. Missing data from this total were removed pairwise rather than using a substitution. A total of 4.8% of data were missing when calculating the final clusters for our AL catalog. In terms of overall demographics, our sample was 57% female (N = 656) with a mean age of 55.0 (SD = 11.8). Also, our sample was representative of the original MIDUS sample. As a final point, because we did not construct an index, we did not explore medication data. However, for those interested in how medication data was used to augment our initial factor solution, see the study Seeman et al. [8].
AL Biomarker Panel
We used 20 MIDUS II biomarkers—nearly double the average used in 58 studies reviewed by Juster et al. [6]. We also made sure that all 20 biomarkers were utilized in at least two published studies reviewed by Juster et al. [6]. In terms of theory, we organized our biomarkers into five physiological systems. (1) Biomarkers from the neuroendocrine system included (a) three catecholamines (norepinephrine, epinephrine, and dopamine); (b) the androgen dehydroepiandrosterone sulfate (DHEA-S); and (c) the glucocorticoid cortisol—all of which are involved in the body’s stress reaction. (2) The cardiovascular/respiratory system biomarkers were systolic and diastolic blood pressure and peak expiratory flow (which is the maximum speed of expiration and an indicator of airflow through the bronchi). (3) The metabolic system biomarkers are well-known indicators of cardiovascular health. This study included total cholesterol, high-density lipoprotein cholesterol, low-density lipoprotein cholesterol, triglycerides, hemoglobin Alc (HbAlc), glucose, and insulin. (4) We also included biomarkers from the immune system, including (a) C-reactive protein (CRP), an acute phase reaction protein that promotes inflammation; (b) interleukin-6 (IL-6), a mediator of the acute phase response that acts as a pro-inflammatory element; (c) the anti-inflammatory cytokine, fibrinogen, which functions as a blood clotting factor that promotes coagulation but increases risk of thrombosis when excessive, and (d) the insulin-like growth factor (IGF-1), a protein that mediates the effects of growth hormone and inhibits cellular apoptosis. (5) Finally, a biomarker of anthropometric status, which measures body habitus, waist-to-hip ratio was used.
Health Risk Outcomes Measures
For our study, we used a total of 23 MIDUS-II self-report health outcomes: heart disease, high blood pressure, circulation problems, blood clots, heart murmur, TIA/stroke, anemia, cholesterol problems, diabetes, asthma, emphysema/COPD, tuberculosis, positive TB skin test, thyroid disease, peptic ulcers, cancer, colon polyps, arthritis, glaucoma, liver cirrhosis, alcoholism, depression, and blood transfusion before 1993. (For details, see Refs. 32, 33).
Statistical/Computational Analyses
As discussed in the introduction, to model AL as a complex system, we employed a CBM approach [23,25–30] specifically, the SACS Toolkit [27–30]. We did so, given the case-based focus this approach takes, as it allowed us to address our three research question: (1) the possibility of multiple AL clinical profiles, (2) the possibility of concurrent and different AL health risk typologies, and (3) the subsequent possible differences in how these multiple profiles/health risks are manifested in the larger socioecological systems in which AL is situated.
While the SACS Toolkit draws upon a wide variety of computational and statistical techniques, for the current study, we used four: the Kohonen self-organizing map (SOM), k-means cluster analysis, principle components analysis (PCA), and logistic regression. A brief overview of how we employed PCA, k-means and the SOM is provided here:
Step 1: Factor Analytic Solution
We began with PCA [34] in order to: (1) identify the major and multiple pathways/relationships among our twenty biomarkers, based on their factor loadings; and (2) name the factors in the PCA solution. (For those unfamiliar with PCA, see Table 1 for the factors, their names, and the loadings for each of the 20 biomarkers on each factor.) Also, prior to PCA, we used a parallel analysis to identify the appropriate number of factors to be extracted [35]. Also, given that our factors constitute highly complex and interdependent AL biological systems, we did not assume that they would be independent. Instead, given our complex systems approach, we treated their causal pathways as complex, multiple, self-organizing, emergent, and nonlinear. As such, we used a promax (oblique) rotation.
The resulting factor structure was interpreted by requiring a loading of .60 to retain each biomarker for each factor identified. All biomarkers were retained on the factor for which they loaded the highest. No item loaded over 0.60 on more than one factor and all items loaded on at least one factor. Factors were named based on the allostatic systems the biomarkers represented—note, an allostatic system could be represented by more than one factor; or, conversely, a factor could represent more than one system.
Finally, after the PCA was completed, all biomarkers that loaded saliently on a factor were used to form standardized scores. This n-dimensional vector profile for each case in the database was then used, in turn, to complete Step 2.
Step 2: Constructing our AL Catalog
With our factors identified, we sought to assemble a catalog of AL profiles. To do so, we employed the SOM and k-means cluster analysis [36–39] In terms of our usage of these techniques, we provide the following details:
K-means was used first because it requires that the number of clusters be identified ahead of time, based largely on some rationale (usually theoretical or previous empirical research), even if tentative or conjectural. Following convention, we ran our k-means with normalized data (as mentioned at the end of Step 1), using a Euclidian measure of distance, with the convergence criterion set to zero. After several runs, all outliers and cases with only partial data were removed. An ANOVA table with unstandardized F statistics was also generated to determine the relative impact each component in the AL profile had on the final cluster solution.
To construct our AL profiles, we evaluated the centroids (clusters) shown in Table 2. Also, to help determine the crispness of the clusters, box plots were examined for outliers. The distance measures for all cases relative to their clusters were also normalized as z-scores and the standard deviation for each cluster computed.
TABLE 2.
Allostatic Load Nine Cluster Solution
| Clustersa
| ||||||||||
|---|---|---|---|---|---|---|---|---|---|---|
| 1 | 2 | 3 | 4 | 5 | 6 | 7 | 8 | 9 | ||
| Low Cholesterol |
Healthy | High Blood Pressure |
Low Stress Hormones |
Metabolic Syndrome |
High Blood Sugar |
Low Stress Antagonist |
High Stress Hormones |
High
Pro- Inflammatory Elements |
||
| Factor/Componentsb Range (min–max) | ANOVA F-testc | |||||||||
| Stress hormones (−3.02 to 3.11) | −0.79d | 0.33 | 0.35 | −0.92 | 0.66 | −0.22 | −.62 | 1.03 | −0.30 | 118.41e |
| Metabolic syndrome (−2.81 to 2.90) | −0.55 | −1.08 | −0.40 | 0.16 | 1.22 | 1.00 | −0.74 | 12 | 0.95 | 177.97e |
| Pro-inflammatory (−3.03 to 3.08) | −0.41 | −1.19 | −0.71 | 0.29 | 0.99 | 0.57 | −0.27 | 0.12 | 1.08 | 154.72e |
| Cholesterol (−4.69 to 2.75) | −1.12 | 0.06 | 0.42 | 0.73 | 0.73 | −0.01 | −0.08 | −0.69 | −0.82 | 93.77 |
| Blood sugars (−1.83 to 6.70) | −0.32 | −0.48 | −0.36 | −0.13 | 0.18 | 3.71 | −0.25 | 0.08 | 0.36 | 215.42e |
| Stress antagonists (−3.86 to 2.26) | 0.31 | 0.22 | 0.58 | 0.14 | 0.35 | −0.10 | −1.7 | 0.30 | −0.73 | 102.06e |
| Blood pressure (−3.91 to 3.17) | −0.60 | −1.10 | 0.94 | −0.06 | 0.47 | 0.26 | 0.15 | 0.21 | −0.52 | 80.78e |
| N = 96f | N = 138 | N = 155 | N = 169 | N = 144 | N = 35 | N = 109 | N = 146 | N = 104 | ||
This nine-cluster solution was obtained using k-means, with standard Euclidian distance measures; convergence criterion was set to zero.
These are the seven factors from Table 1, used to construct the different profiles for the nine clusters. Included below each factor is its min and max score possible, which comes from summing the biomarkers that loaded on it and converting this sum into a z-score.
Unstandardized F scores (ANOVA) demonstrating, for descriptive purposes only, the relative impact the seven factors had in determining cluster membership
The score for each case, for each of the seven factors, was computed (as noted in b above) by summing each case’s scores on the biomarkers for each factor, as shown in Table 1. In turn, these summed factor scores were converted into z-scores to normalize the data.
F test was significant at.000. The factors with the three highest scores are highlighted.
Number of cases in each cluster.
Next, the SOM was run. Because the SOM is unsupervised, if it arrives at a solution similar to the k-means it provides effective corroboration. Analyses were conducted using the SOM Toolbox, a freeware package for MATLAB [37] The SOM graphs its cluster solution onto a variety of three-dimensional maps. For the current study, as shown in Figure 1, we used the u-matrix and components map. On the u-matrix, cases most like one another are graphically positioned as nearby neighbors, with the most unlike cases placed furthest apart. The u-matrix and components map are also topographical: valleys (darker colored) areas are more similar in AL profile; while hilly, brighter colored areas are more distinct. The component maps visualize how each of the factors from our factor solution contributed to the making of a profile and to the positioning of cases on the u-matrix.
FIGURE 1.
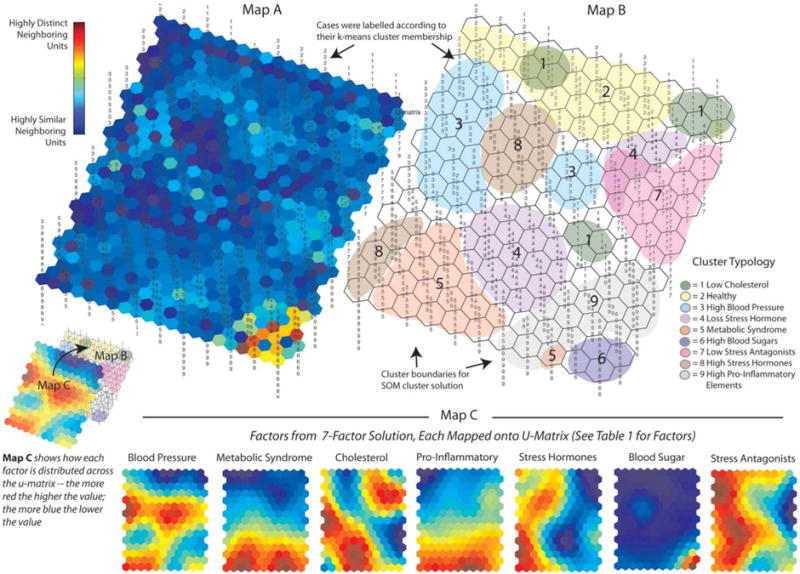
U-Matrix and Components Maps for Nine Allostatic Load Profiles: Map A and Map B are graphic representations of the cluster solution arrived at by the Self-Organizing Map (SOM) Neural Net, referred to as the U-Matrix. In terms of the information, they provide, Map A is a three-dimensional (topographical) u-matrix: for it, the SOM adds hexagons to the original 15×11 map to allow for visual inspection of the degree of similarity among neighboring map units; the dark blue areas indicate neighborhoods of cases that are highly similar; in turn, bright yellow and red areas, as in the lower right comer of the map, indicate highly defined cluster boundaries. Map B is a two-dimensional version of Map A that allows for visual inspection of how the SOM clustered the individual cases. Cases on this version of the u-matrix (as well as Map A) were labeled according to their k-means cluster membership (The nine cluster solution shown in Table 2) to see if the SOM would arrive at a similar solution. Map C is a graphic representation of the relative influence that the seven factors (shown in Table 1) had on the SOM cluster solution. The SOM generates a mini-map for the seven factors, each of which can be overlaid across maps A and B. Each of these mini-maps can then be inspected visually to examine what its rates are across the different neighborhoods (clusters of cases). Dark blue areas indicate the lowest rates for a factor; and the bright red areas indicate the highest rates for a factor. For example, looking at the mini-map for Factor 6 (Blood Sugar), its rates are extremely low across most of the map, except for the lower right comer, which is where (looking at Map A and Map B) the SOM placed Cluster 6.
RESULTS AND DISCUSSION
To advance the measurement of AL and, in turn, its theoretical understanding as a complex system, we did the following: (1) used PCA to determine the underlying factor analytic structure of AL; (2) used the SOM and k-means to construct a catalog of AL clinical profiles; (3) regressed the resulting AL clinical profiles on a series of 23 health outcomes to construct a health-risk typology for AL; and (4) situated our results in the wider network of socioecological systems by exploring, post hoc, differences among our results as a function of gender. Our results and discussion are as follows:
Factor Solution
As shown in Table 1, our PCA arrived at a seven-factor solution, accounting for 72.3% of the total variance. Furthermore, despite the complex causal pathways among the 20 biomarkers, the factor loadings were, overall, very clear. The only exceptions were: (a) Waist-to-Hip on Blood Pressure, Blood Sugar and Stress Antagonists (key stress buffers); (b) Insulin on Pro-Inflammatory Elements and Blood Sugar; (c) Triglycerides on Blood Pressure; (d) Glucose on Metabolic Syndrome; and (e) Peak Flow on Metabolic Syndrome. Still, these additional loading were only 0.411 or lower. Based on the factor loadings, the seven factors were named as follows: (1) Blood Pressure, (2) Metabolic Syndrome, (3) Cholesterol, (4) Pro-Inflammatory Elements, (5) Stress Hormones, (6) Blood Sugar, and (7) Stress Antagonists—by this last term we mean a set of biomarkers which, when low, indicate a person’s struggle to buffer herself/himself against stress.
Overall, then, our results support the usage of factor analysis as a robust empirical and biologically plausible solution for the complex latent structure of AL. More specifically, our results suggest that our 20 biomarker panel—given its theoretical grounding—may, indeed, serve as a preferred approach to constructing a biomarker panel. Finally, our PCA solution provides initial support for measuring AL a complex multi-system biological construct, rather than as a simple composite index.
AL Clinical Profiles
As shown in Table 2 and Figure 1, the SOM and k-means settled on a catalog of nine AL clinical profiles, which we named as follows.
Low Cholesterol: The key feature of this clinical profile is its very low centroid score on Cholesterol (−1.12); and, in turn, Stress Hormones (−0.79). The SOM supported these results. However, looking at Map B, the SOM grouped the Low Cholesterol (forest green) cases (Profile 2) into three possible subgroups. Looking at Map C and Map B together, the top left subgroup has the lowest Cholesterol scores, while the other two subgroups have the lowest Stress Hormones scores (Map C).
Healthy: The centroid scores for this profile were very low on Metabolic Syndrome (−1.08), Pro-Inflammatory Elements (−1.19), and Blood Pressure (−1.10). The SOM supported these results: looking at Map B, the SOM positioned the Healthy cases (Profile 2) at the top, colored in light yellow. Looking at this same area for each of the seven factors in Map C (components map), one finds low to very low scores (dark blue) on Blood Pressure, Metabolic Syndrome, Pro-Inflammatory Elements, and Blood Sugar.
High Blood Pressure: The key feature of this profile is a high score on Blood Pressure (0.94); but, conversely, a low score on Pro-Inflammatory Elements (−0.71). In addition, looking at Map B, the SOM grouped High Blood Pressure (light blue) into two possible subgroups (one large, one small) with cases on the left having both higher Cholesterol (Map C) and Stress Antagonists (stress buffers) (Map C).
Low Stress Hormones: This profile (the largest, N = 169) had the lowest score on Stress Hormones (−0.92) and a High Cholesterol Score (0.73). Looking at Map B, the SOM supported these results, placing the majority of cases in Profile 4 toward the lower center (purple), where some of the highest Cholesterol and lowest Stress Hormones scores are found (Map C). But, the SOM also identified a possible (albeit small) subset of cases toward the upper right of Map B, which is lower on Stress Antagonists (stress buffers).
Metabolic Syndrome: This profile has the highest score on Metabolic Syndrome (1.22) and high scores on Cholesterol (0.73) and Pro-Inflammatory Elements (0.99). The SOM supported these results (Map C), placing Metabolic Syndrome cases (Profile 5) at the bottom center-left (melon) of Map B. The SOM also identified a possible small subset of cases in the lower right, very high on Metabolic Syndrome and Pro-Inflammatory Elements, but not as high on Cholesterol.
High Blood Sugar: This profile—the smallest (N = 35)—has a high Metabolic Syndrome score and the Highest Blood Sugar Score (3.71); placing the centroid scores for Profile 6 three standard deviations above the mean. The SOM strongly supports these results (Map C), placing Profile 6 (purple) in the lower right corner on Map B.
Low Stress Antagonists (low stress buffers): This profile has the lowest score on key stress buffers (Stress Antagonists = −1.70); and also low scores on Metabolic Syndrome (−0.74) and Stress Hormones (0.99). Scoring low on the biomarkers for Stress Antagonists is associated with poor health outcomes. For more, see our discussion of this profile in the Health Risk Outcomes section below. The SOM supported these results (See Map C), placing these cases (Profile 7) along the upper right (pink) of Map B. However, the SOM spreads this profile out a bit, overlapping it with Low Stress Hormones, possibly due to their mutual low scores on Metabolic Syndrome and mild scores on Stress Antagonists (stress buffers).
High Stress Hormones: Directly opposite of the Low Stress Hormones type, this profile (the second largest, N = 146) has the highest score on Stress Hormones (1.03) and one of the lowest scores on Cholesterol (−0.69). Looking at Map B, however, the SOM did not entirely support these results, breaking Profile 8 (mocha) into two possible groups. The upper-left profile is similar to Table 2; however, the bottom-left profile differs, with high scores on Pro-Inflammatory Elements, Metabolic, and Blood Pressure.
High Pro-Inflammatory Elements: This profile had the highest centroid score on Pro-Inflammatory Elements (1.08); a high score on Metabolic Syndrome (.73); and, it is important to note, a low score on Stress Antagonists (stress buffers) (−0.73) and also cholesterol (−0.82). The SOM supports these results (grey), although Pro-Inflammatory Elements, Metabolic, and Cholesterol do go down toward the upper-right.
As these results suggest, a case-based modeling approach further supports researching AL as a complex system. Furthermore, these results support the idea that AL is comprised of multiple clinical profiles, each demonstrating a relatively unique set of causal pathways among the underlying latent seven-factor structure of AL. Finally, if such a diversity of AL clinical profiles and their respective differences in causal structure exist, our results suggest that a more personalized medicine approach may be warranted where AL is treated as a form of differential diagnosis—both for individuals and groups.
Typology of Health Risk Outcomes
As shown in Table 3, using logistic regression, we arrived at a typology of health risk outcomes for each of our AL clinical profiles. To help readers make sense of these results, we created Figure 2, which visually displays the differences between observed and expected frequencies for each self-reported medical condition. In Figure 2, the radii represent all 23 medical conditions used in our study. The profiles are circumscribed around these 23 radii based on the results from Table 3. The resulting health risk outcomes profile is shown in red. Scores higher than 0 (the green circle) indicate a greater observed value than expected, whereas scores below 0 indicate a smaller observed value than expected. The most noteworthy scores for each profile are also labeled in red. Our results are as follows:
FIGURE 2.
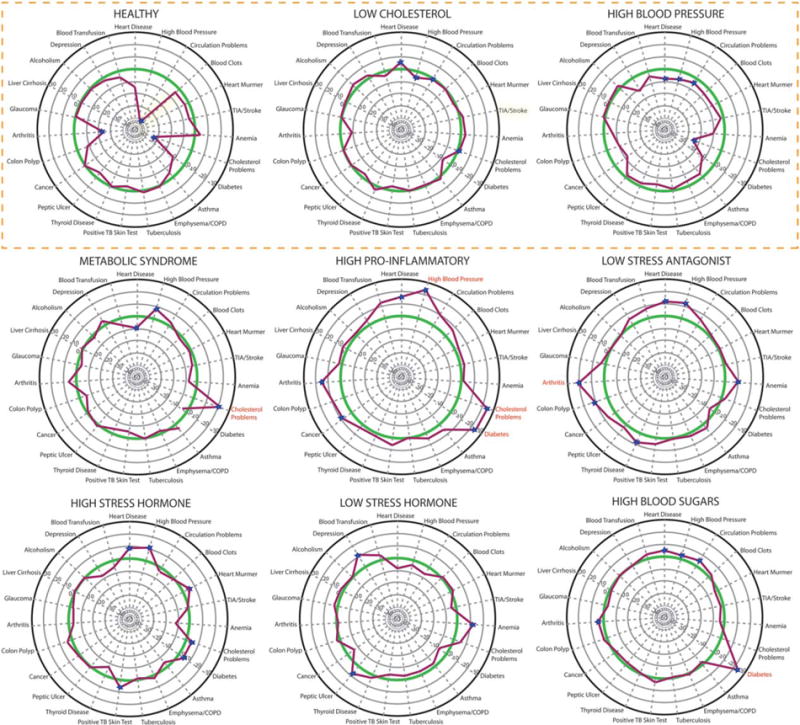
Clinical health risk outcomes for nine allostatic load profiles. This figure displays the differences between observed and expected frequencies for each self-reported medical condition. Each of the radii represents a self-reported medical condition, labeled at the top of their respective radius. The case clusters are circumscribed around the 23 points of each circle based on the average frequency on a particular self-reported medical condition. The resulting profile (which constitutes each Cluster’s health risk profile) is in red. Score higher than 0 (the green circle) indicate a greater observed value than expected, whereas scores below 0 indicate a smaller than observed value than expected. For those scores higher than 20, the corresponding medical condition is labeled in red. The three healthy to marginally healthy profiles are at the top, outlined in orange.
1. Healthy Outcomes
To begin, there were three profiles with healthy to moderately healthy outcomes. Of the three, the most obvious was Healthy; which, in contrast to the other eight profiles, reported, overall, lower health risk outcomes, including exceptionally lower rates of circulation problems, cholesterol and arthritis; as well as low rates of heart disease, diabetes, TIA/stroke, heart murmur and blood clots. Still, this profile reported slightly greater than expected (or equivalent) rates of cancer, anemia, emphysema, tuberculosis, thyroid disease, and glaucoma. Perhaps most important, when viewed as an emergent complex system, the Healthy profile and its associated risk typology illustrated something new: while many of its biomarkers have long been documented to be risk factors for cardiovascular dysfunction, this is the first time, to our knowledge, they have been shown to group together when evaluating the AL outcomes of stress—illustrating, in this case, a positive outcome. For example, less than 1% of the N = 138 cases in this profile reported heart disease.
The second healthy profile is Low Cholesterol; which, overall, had a health risk typology close to expected values on most markers. It did, however, have slightly higher rates on a few outcomes, such as heart disease and alcoholism. And, it certainly did not have the markedly low rates found in the Healthy profile.
The least obvious healthy profile was High Blood Pressure; which underreported on key stress-related disorders, including high blood pressure (49/56) and cholesterol (38/66). These findings suggest that blood pressure, alone, may not initiate the cascade of disorders associated with more pivotal profiles, like Pro-Inflammatory Elements. More likely, however, these results suggest that patients in this profile are, by the time of self-report, receiving treatment for their high blood pressure.
2. Unhealthy Outcomes
In contrast to the health profiles are the other six; which were, to varying degrees, associated with different patterns of poor health outcomes. As a first example, when analyzing Metabolic Syndrome, we found expected high rates for high cholesterol (83/62) and high blood pressure (61/52). But, we also found lower than expected rate for heart disease (7/17).
Another example is High Pro-Inflammatory Elements, which reported a high rate of heart disease (27/12), high blood pressure (61/38), circulation problems (20/10), diabetes (37/12), cholesterol (68/45), cancer (23/15), and arthritis (56/42). This profile also appears to be the most impacted by AL, with consistent higher-than-expected reporting of cardiovascular and metabolic disorders. It may be relevant that this profile is also low on cholesterol and Stress Antagonists (those key stress buffers). The strong association between high levels of Pro-Inflammatory Elements (IL-6, fibrinogen, CRP) and cardiovascular problems is, however, expected [40–42]. Also expected is this profile’s association with diabetes [43–45].
Given that Low Stress Antagonists (stress buffers) indicate a person’s struggle to defend against stress, this AL clinical profile showed a consistent pattern of higher-than-expected reporting on many stress-related health outcomes. A significant number of cases in this profile also reported high rates of heart disease (24/13), high blood pressure (51/39), thyroid (22/14), blood transfusions (19/11), and arthritis (65/45) – which, when viewed in total, raises suspicion about the role that Stress Antagonists (stress buffers) play in this profile.
The typology for this profile is also significant because (like the Healthy profile) it points to the utility of a case-based approach: our exploratory results suggest etiological clues for patterns not entirely expected. As a restatement of what we found, the key biomarkers loading on this profile were IGF-1, DHEA-S, and peak flow. In turn, rates for heart disease, high blood pressure, thyroid disease, blood transfusions, and arthritis were well-above expected outcomes; however, diabetes was less than expected. In terms of interpreting these results, DHEAS (the most common adrenal steroid in the body) declines dramatically with age. However, while the exact progression of DHEAS during stress is poorly documented, it is elevated by stress in the short-term. Furthermore, higher levels of DHEAS during stress are associated with less stress at a later time; although a more common explanation is that the ratio of DHEAS to cortisol is crucial in controlling stress and may provide beneficial behavioral and neurotrophic effects [7]. Its effect may be similar in the long-term. Bremner et al. [46] reported adult women with a childhood history of sexual abuse and current PTSD had higher levels of DHEAS recorded across a 24-h period than control women and women with abuse but no PTSD.
The findings for Low Stress Hormones and its counterpart High Stress Hormones also support the current literature, which can be summarized as follows: while the short term effects of stress hormones—which, in the current study, includes catecholamine and the HPA steroid cortisol—are positive, it appears that long-term circulating effects are negative in heart disease [45]. The fact that Low Stress Hormone also reported less-than-expected heart disease, while High Stress Hormones reported higher-than-expected heart disease and high blood pressure is also consistent with the literature [45]. However, while Low Stress Hormone reported high rates of anemia (36/25), peptic ulcers (16/9), and depression (50/39), it also reported less-than-expected TIA/Stroke, diabetes, and circulation problems—which may suggest broader effects.
Finally, there was High Blood Sugar. The most important outcome for this profile, which was expected, was its very high rates of diabetes (28/4). Everything else, otherwise, was within the normal, expected range.
Post Hoc Results: AL and Gender
Ultimately, if one is to understand the full complexity of AL, it is necessary to explore (in-depth) how our catalog of clinical profiles/health risk typologies link to the larger socioecological systems in which AL is situated across time/space. While such a focus is the goal of subsequent research, we decided to initially explore this issue by examining, post hoc, the influence of gender on our results.
Overall, we found that women were overrepresented on Low Stress Antagonists (95.4%), Healthy (81.9%), and Low Stress Hormones (66.3%). In contrast, men were overrepresented on High Blood Pressure (61.2%), Metabolic Syndrome (63.2%), High Stress Hormones (66.4%), and High Blood Sugar (57.1%). In contrast, however, the “percentage female” for Low Cholesterol (56.3%) and High Pro-Inflammatory Elements (57.7%) was similar to our overall sample (57% female).
The fact that men were overrepresented on High Stress Hormones, as well as the profiles characterized by the downstream effects of these hormones, namely High Blood Pressure and Metabolic Syndrome, leads us to question if men are more susceptible to the negative effects of SAM and HPA hormones. Furthermore, women are overrepresented on the profiles comprising factors consistent with allostasis, namely Healthy and Low Stress Hormone, and yet overrepresent the Low Stress Antagonists (stress buffers) profile.
The post hoc results for Low Stress Antagonists (stress buffers) suggest a possible unique gender-based stress response. The key biomarkers on this profile are peak flow, DHEAS, and IGF-1. While DHEAS is the most common steroid in both men and women, not only having a mild androgenicity effect, it is also the precursor from which all other steroids are metabolized. It drops in a strictly linear fashion with age in both men and women, with women having lower levels than men throughout the lifespan [47–51]. However, this pattern of decline is complicated in old age by the emergence of subgroups that show an increase in levels (after correcting for regression to the mean) for 15% of women and 5% of men [52]. The cause of this unexpected finding is unknown and has led previous studies to conclude that “unknown fundamental gender differences” in adrenal androgen production and excretion might be the cause [53].
In terms of the current study, however, while we cannot directly tie our post hoc results to the gender differences described in the current literature, our results suggest that very low levels of DHEAS may likewise reflect some “unknown fundamental gender differences” in androgen production, which is seemingly associated with the emergence of stress-related disorders. IGF-1 is secreted by the liver and is important for both the regulation of normal physiology and a number of pathological conditions, most notably cancer. While its role in stress is poorly understood, it is reported to be lower in patients suffering multiple traumas [54]; and few would argue that it does not play a relevant role in stress. Reviews of the studies on DHEA supplementation during the 1990s (and even more recently) find reports of a rise in IGF-1 subsequent to DHEA administration [55]. Interestingly, IGF-1 is also reported to rise in association with cortisol. In apparent contradiction, however, several epidemiological studies have found that low IGF-1 is a risk factor for metabolic syndrome. It is difficult to know what biological stress-related functions are driving the high level of self-reported medical difficulties. Also, it is not clear how knowing they are almost exclusively women is informative, yet this profile may well wave a red flag for further research into this dimension of AL, a reasonable outcome for this third part of our study.
Limitations of Current Study
Given the exploratory nature of the current study, several limitations (which we also discussed in the introduction and methods) are important to highlight. First, the health risk outcomes for our study were self-report. Second, we did not use medication data. Third, our study was cross-sectional. Finally, while we examined gender post hoc, future research needs to explore in-depth how the catalog of AL clinical profiles and their corresponding health risk typology link to the larger socioecological systems in which AL is situated across time/space. It is therefore necessary for future research to confirm our results with non-self-report and medication data, as well as employ a longitudinal or cohort design, particularly in order to examine how our factor structure, AL clinical profiles, and health risk outcomes typology change as a function of time or key antecedent socioecological factors, including medical treatment, health behaviors, change in residence, and so forth.
CONCLUSIONS
Over the last several decades, the complexity sciences have sought to demonstrate the utility of thinking about health problems (particularly health disparities) in holistic, complex systems terms [22–24]. AL constitutes one such advance [1–7,18,19]. However, the measurement of this concept, as a complex system, has yet to be fully developed, given the limitations of the statistical methods currently used in the field, which are largely conventional in nature, relying on a reductionist linear model approach [7,19].
In response, the current study sought to make several key advances, in order to demonstrate, in exploratory fashion, the utility of modeling and measuring AL as a complex system. More specifically, we sought to demonstrate that a CBM approach could be used to: (1) determine the underlying factor analytic structure of AL and construct a catalog of corresponding clinical profiles; (2) regress these AL clinical profiles on a series of health outcomes to construct a health-risk typology for AL; and (3) situate these results in the wider network of socioecological systems by exploring, post hoc, differences among our results as a function of gender. While exploratory and tentative, our results, overall, supported our efforts, suggesting that the complexities of AL can be more effectively modeled and measured.
Acknowledgments
Grants: Stress Resilience In Virtual Environments Involving Loss and Grief (STRIVE-Loss) W911NF-04-D-0005. The STRIVE-ONR Project: Stress Resistance in Virtual Environments for ONR N00014-12-1-0163. The authors would like to acknowledge following grants National Institutes of Health grants P01-AG-020166, UL1TR000124, UL1TR001881.
References
- 1.McEwen BS. Allostasis and allostatic load: implications for neuropsycho-pharmacology. Neuropsychopharmacology. 2000;22:108–124. doi: 10.1016/S0893-133X(99)00129-3. [DOI] [PubMed] [Google Scholar]
- 2.McEwen BS. Interacting mediators of allostasis and allostatic load: towards an understanding of resilience in aging. Metabolism. 2003;52:10–16. doi: 10.1016/s0026-0495(03)00295-6. [DOI] [PubMed] [Google Scholar]
- 3.McEwen BS. Protective and damaging effects of stress mediators: central role of the brain. Dialogues Clin Neurosci. 2006;8:367–381. doi: 10.31887/DCNS.2006.8.4/bmcewen. [DOI] [PMC free article] [PubMed] [Google Scholar]
- 4.McEwen BS, Seeman T. Protective and damaging effects of mediators of stress: Elaborating and testing the concepts of allostasis and allostatic load. Ann N Y Acad Sci. 1999;896:30–47. doi: 10.1111/j.1749-6632.1999.tb08103.x. [DOI] [PubMed] [Google Scholar]
- 5.McEwen BS, Stellar E. Stress and the individual: mechanisms leading to disease. Arch Intern Med. 1993;153:2093. [PubMed] [Google Scholar]
- 6.Juster RP, McEwen BS, Lupien SJ. Allostatic load biomarkers of chronic stress and impact on health and cognition. Neurosci Biobehav Rev. 2010;35:2–16. doi: 10.1016/j.neubiorev.2009.10.002. [DOI] [PubMed] [Google Scholar]
- 7.McEwen B, Nasveld P, Palmer M, Anderson R. Allostatic Load: A review of the literature. Canberra: Department of Veterans’ Affairs; 2012. [Google Scholar]
- 8.Seeman M, Merkin SS, Karlamanga A, Koretz B, Seeman T. Social status and biological dysregulation: The “status syndrome” and allostatic load. Soc Sci Med. 2014;118:143–151. doi: 10.1016/j.socscimed.2014.08.002. [DOI] [PMC free article] [PubMed] [Google Scholar]
- 9.Seeman T, Epel E, Gruenewald T, Karlamangla A, McEwen BS. Socio-economic differentials in peripheral biology: Cumulative allostatic load. Ann N Y Acad Sci. 2010a;1186:223–239. doi: 10.1111/j.1749-6632.2009.05341.x. [DOI] [PubMed] [Google Scholar]
- 10.Seeman T, Gruenewald T, Karlamangla A, Sidney S, Liu K, McEwen B, Schwartz J. Modeling multisystem biological risk in young adults: The Coronary Artery Risk Development in Young Adults Study. Am J Hum Biol. 2010b;22:463–472. doi: 10.1002/ajhb.21018. [DOI] [PMC free article] [PubMed] [Google Scholar]
- 11.Seeman TE, Crimmins E, Huang MH, Singer B, Bucur A, Gruenewald T, Berkman LF, Reuben DB. Cumulative biological risk and socio-economic differences in mortality: MacArthur studies of successful aging. Soc Sci Med. 2004;58:1985–1997. doi: 10.1016/S0277-9536(03)00402-7. [DOI] [PubMed] [Google Scholar]
- 12.Gallo LC, Fortmann AL, Mattei J. Allostatic load and the assessment of cumulative biological risk in biobehavioral medicine: Challenges and opportunities. Psychosom Med. 2014;76:478–480. doi: 10.1097/PSY.0000000000000095. [DOI] [PMC free article] [PubMed] [Google Scholar]
- 13.Mair CA, Cutchin MP, Peek MK. Allostatic load in an environmental risk scape: The role of stressors and gender. Health Place. 2011;17:978–987. doi: 10.1016/j.healthplace.2011.03.009. [DOI] [PMC free article] [PubMed] [Google Scholar]
- 14.Castellani B, Rajaram R, Buckwalter JG, Ball M, Hafferty F. Place and Health as Complex Systems: A Case Study and Empirical Test. Springer; Germany: 2014. (SpringerBriefs in Public Health). [Google Scholar]
- 15.Merkin SS, Karlamangla A, Diez Roux AV, Shrager S, Seeman TE. Life course, socioeconomic status and longitudinal accumulation of allostatic load in adulthood: Multi-Ethnic Study of Atherosclerosis. Am J Publ Health. 2014;104:e48–e55. doi: 10.2105/AJPH.2013.301841. [DOI] [PMC free article] [PubMed] [Google Scholar]
- 16.Geronimus AT, Pearson JA, Linnenbringer E, Schulz AJ, Reyes AG, Epel ES, Lin J, Blackburn EH. Race-ethnicity, poverty, urban stressors, and telomere length in a detroit community-based sample. J Health Soc Behav. 2015;56:199–224. doi: 10.1177/0022146515582100. [DOI] [PMC free article] [PubMed] [Google Scholar]
- 17.Loucks EB, Juster RP, Pruessner JC. Neuroendocrine biomarkers, allostatic load, and the challenge of measurement: A commentary on Gersten. Soc Sci Med. 2008;66:525–530. [Google Scholar]
- 18.Carlson ED, Chamberlain RM. Allostatic load and health disparities: A theoretical orientation. Res Nurs Health. 2005;28:306–315. doi: 10.1002/nur.20084. [DOI] [PubMed] [Google Scholar]
- 19.Beckie TM. A systematic review of allostatic load, health, and health disparities. Biol Res Nurs. 2012;14:311–346. doi: 10.1177/1099800412455688. [DOI] [PubMed] [Google Scholar]
- 20.Gruenewald TL, Seeman TE, Ryff CD, Karlamangla AS, Singer BH. Combinations of biomarkers predictive of later life mortality. Proc Natl Acad Sci USA. 2006;103:14158–11416. doi: 10.1073/pnas.0606215103. [DOI] [PMC free article] [PubMed] [Google Scholar]
- 21.Buckwalter JG, Rizzo A, John BS, Finlay L, Wong A, Chin E, Seeman TE. Analyzing the Impact of Stress: A comparison between a factor analytic and a composite measurement of allostatic load. The Interservice/Industry Training, Simulation & Education Conference I/ITSEC. 2011;1 [Google Scholar]
- 22.Capra F, Pier Luigi L. The Systems View of Life: A Unifying Vision. Cambridge University Press; Cambridge, UK: 2014. [Google Scholar]
- 23.Byrne D, Gillian C. Complexity Theory and the Social Sciences: The State of the Art. Routledge; London, UK: 2013. [Google Scholar]
- 24.Mitchell M. Complexity: A guided tour. Oxford University Press; Oxford, UK: 2009. [Google Scholar]
- 25.Byrne D, Ragin C. The Sage Handbook of Case-Based Methods. SAGE; California, USA: 2009. [Google Scholar]
- 26.Byrne D, Uprichard E. Useful Complex Causality. The Oxford Handbook of Philosophy of Social Science. 2012;109 [Google Scholar]
- 27.Castellani B, Rajaram R. Case-based modeling and the SACS Toolkit: a mathematical outline. Comput Math Organ Theory. 2012;18:153–174. [Google Scholar]
- 28.Castellani B, Rajaram R, Gunn J, Griffiths F. Cases, clusters, densities: Modeling the nonlinear dynamics of complex health trajectories. Complexity. in press, Available at http://onlinelibrary.wiley.com/doi/10.1002/cplx.21728/abstract?userIsAuthenticated=false&deniedAccessCustomisedMessage.
- 29.Rajaram R, Castellani B. Modeling complex systems macroscopically: Case/agent-based modeling, synergetics, and the continuity equation. Complexity. 2012;18:8–17. [Google Scholar]
- 30.Rajaram R, Castellani B. The utility of nonequilibrium statistical mechanics, specifically transport theory, for modeling cohort data. Complexity. 2015;20:45–57. [Google Scholar]
- 31.Hawkley LC, Lavelle LA, Berntson GG, Cacioppo JT. Mediators of the relationship between socioeconomic status and allostatic load in the Chicago Health, Aging, and Social Relations Study CHASRS. Psychophysiology. 2011;48:1134–1145. doi: 10.1111/j.1469-8986.2011.01185.x. [DOI] [PMC free article] [PubMed] [Google Scholar]
- 32.Love GD, Seeman TE, Weinstein M, Ryff CD. Bioindicators in the MIDUS national study: Protocol, measures, sample, and comparative context. J Aging Health. 2010;22:1059–1080. doi: 10.1177/0898264310374355. [DOI] [PMC free article] [PubMed] [Google Scholar]
- 33.Friedman EM, Williams DR, Singer BH, Ryff CD. Chronic discrimination predicts higher circulating levels of E-selectin in a national sample: The MIDUS study. Brain Behav Immun. 2009;23:684–692. doi: 10.1016/j.bbi.2009.01.002. [DOI] [PMC free article] [PubMed] [Google Scholar]
- 34.Grimm LG, Yarnold PR. Reading and understanding multivariate statistics. American Psychological Association; Washington, DC, US: 1995. pp. 99–136. [Google Scholar]
- 35.Lautenschlager GJ. A comparison of alternatives to conducting Monte Carlo analyses for determining parallel analysis criteria. Multivariate Behav Res. 1989;24:365–395. doi: 10.1207/s15327906mbr2403_6. [DOI] [PubMed] [Google Scholar]
- 36.Jain AK. Data clustering: 50 years beyond K-means. Pattern Recogn Lett. 2010;31(8):651–666. [Google Scholar]
- 37.Kohonen T, Kaski S, Lagus K, Salojarvi J, Honkela J, Paatero V, Saarela A. Self-organization of a massive document collection. IEEE Trans Neural Netw. 2000;11:574–585. doi: 10.1109/72.846729. [DOI] [PubMed] [Google Scholar]
- 38.Kuo RJ, Ho LM, Hu CM. Integration of self-organizing feature map and K-means algorithm for market segmentation. Comput Oper Res. 2002a;29:1475–1493. [Google Scholar]
- 39.Kuo RJ, Ho LM, Hu CM. Cluster analysis in industrial market segmentation through artificial neural network. Comput Ind Eng. 2002b;42:391–399. [Google Scholar]
- 40.Hedayat M, Mahmoudi MJ, Rose NR, Rezaei N. Proinflammatory cytokines in heart failure: Double-edged swords. Heart Fail Rev. 2010;15:543–562. doi: 10.1007/s10741-010-9168-4. [DOI] [PubMed] [Google Scholar]
- 41.Koenig W, Löwel H, Baumert J, Meisinger C. Creactive protein modulates risk prediction based on the Framingham Score implications for future risk assessment: Results from a large cohort study in Southern Germany. Circulation. 2004;109:1349–1353. doi: 10.1161/01.CIR.0000120707.98922.E3. [DOI] [PubMed] [Google Scholar]
- 42.Stec JJ, Silbershatz H, Tofler GH, Matheney TH, Sutherland P, Lipinska I, Massaro JM, Wilson PFW, Muller JE, D’Agostino RB. Association of fibrinogen with cardiovascular risk factors and cardiovascular disease in the Framingham offspring population. Circulation. 2000;102:1634–1638. doi: 10.1161/01.cir.102.14.1634. [DOI] [PubMed] [Google Scholar]
- 43.Guest CB, Park MJ, Johnson DR, Freund GG. The implication of proinflammatory cytokines in type 2 diabetes. Front Biosci. 2007;13:5187–5194. doi: 10.2741/3074. [DOI] [PubMed] [Google Scholar]
- 44.Schmidt MI, Duncan BB, Sharrett AR, Lindberg G, Savage PJ, Offenbacher S, Azambuja MI, Tracy RP, Heiss G. Markers of inflammation and prediction of diabetes mellitus in adults Atherosclerosis Risk in Communities study: A cohort study. Lancet. 1999;353:1649–1652. doi: 10.1016/s0140-6736(99)01046-6. [DOI] [PubMed] [Google Scholar]
- 45.Adameova A, Abdellatif Y, Dhalla NS. Role of the excessive amounts of circulating catecholamines and glucocorticoids in stress-induced heart disease. Can J Physiol Pharmacol. 2009;87:493–514. doi: 10.1139/y09-042. [DOI] [PubMed] [Google Scholar]
- 46.Bremner D, Vermetten E, Kelley ME. Cortisol, dehydroepiandrosterone, and estradiol measured over 24 hours in women with childhood sexual abuse-related posttraumatic stress disorder. J Nerv Ment Dis. 2007;195:919–927. doi: 10.1097/NMD.0b013e3181594ca0. [DOI] [PubMed] [Google Scholar]
- 47.Ellis BJ, Del Giudice M. Beyond allostatic load: Rethinking the role of stress in regulating human development. Dev Psychopathol. 2014;26:1–20. doi: 10.1017/S0954579413000849. [DOI] [PubMed] [Google Scholar]
- 48.Berr C, Lafont S, Debuire B, Dartigues JF, Baulieu EE. Relationships of dehydroepiandrosterone sulfate in the elderly with functional, psychological, and mental status, and short-term mortality: A French community-based study. Proc Natl Acad Sci USA. 1996;93:13410–13415. doi: 10.1073/pnas.93.23.13410. [DOI] [PMC free article] [PubMed] [Google Scholar]
- 49.Böttner A, Kratzsch J, Müller G, Kapellen TM, Blüher S, Keller E, Blüher M, Kiess W. Gender differences of adiponectin levels develop during the progression of puberty and are related to serum androgen levels. J Clin Endocrinol Metab. 2004;89:4053–4061. doi: 10.1210/jc.2004-0303. [DOI] [PubMed] [Google Scholar]
- 50.Fukai S, Akishita M, Yamada S, Hama T, Ogawa S, Iijima K, Eto M, Kozaki K, Toba K, Ouchi Y. Association of plasma sex hormone levels with functional decline in elderly men and women. Geriatr Gerontol Int. 2009;9:282–289. doi: 10.1111/j.1447-0594.2009.00534.x. [DOI] [PubMed] [Google Scholar]
- 51.Hernández-Morante JJ, Pérez-de-Heredia F, Luján JA, Zamora S, Garaulet M. Role of DHEA-S on body fat distribution: gender-and depot-specific stimulation of adipose tissue lipolysis. Steroids. 2008;73:209–215. doi: 10.1016/j.steroids.2007.10.005. [DOI] [PubMed] [Google Scholar]
- 52.Morsink LF, Vogelzangs N, Nicklas BJ, Beekman AT, Satterfield S, Rubin SM, Yaffe K, Simonsick E, Newman AB, Kritchevsky SB, Penninx BW. Associations between sex steroid hormone levels and depressive symptoms in elderly men and women: Results from the Health ABC study. Psychoneuroendocrinology. 2007;32:874–883. doi: 10.1016/j.psyneuen.2007.06.009. [DOI] [PubMed] [Google Scholar]
- 53.Tannenbaum C, Barrett-Connor E, Laughlin GA, Platt RW. A longitudinal study of dehydroepiandrosterone sulphate DHEAS change in older men and women: the Rancho Bernardo Study. European Journal of Endocrinology. 2004;151:717–725. doi: 10.1530/eje.0.1510717. [DOI] [PubMed] [Google Scholar]
- 54.Jeevanandam M, Holaday NJ, Shamos RF, Petersen SR. Acute IGF-1 deficiency in multiple trauma victims. Clin Nutr. 1992;11:352–357. doi: 10.1016/0261-5614(92)90086-6. [DOI] [PubMed] [Google Scholar]
- 55.Papierska L, Rabijewski M, Kasperlik-Załuska A, Zgliczyński W. Effect of DHEA supplementation on serum IGF-1, osteocalcin, and bone mineral density in postmenopausal, glucocorticoid-treated women. Adv Med Sci. 2012;57:51–57. doi: 10.2478/v10039-011-0060-9. [DOI] [PubMed] [Google Scholar]