

Abstract
Background
In settings like the Ebola epidemic, where proof-of-principle trials have provided evidence of efficacy but questions remain about the effectiveness of different possible modes of implementation, it may be useful to conduct trials that not only generate information about intervention effects but also themselves provide public health benefit. Cluster randomized trials are of particular value for infectious disease prevention research by virtue of their ability to capture both direct and indirect effects of intervention, the latter of which depends heavily on the nature of contact networks within and across clusters. By leveraging information about these networks – in particular the degree of connection across randomized units, which can be obtained at study baseline – we propose a novel class of connectivity-informed cluster trial designs that aim both to improve public health impact (speed of epidemic control) and to preserve the ability to detect intervention effects.
Methods
We consider cluster randomized trials with staggered enrollment, in each of which the order of enrollment is based on the total number of ties (contacts) from individuals within a cluster to individuals in other clusters. Our designs can accommodate connectivity based either on the total number of external connections at baseline or on connections only to areas yet to receive the intervention. We further consider a “holdback” version of the design in which control clusters are held back from re-randomization for some time interval. We investigate the performance of these designs in terms of epidemic control outcomes (time to end of epidemic and cumulative incidence) and power to detect intervention effect, by simulating vaccination trials during an SEIR-type epidemic outbreak using a network-structured agent-based model. We compare results to those of a traditional Stepped Wedge trial.
Results
In our simulation studies, connectivity-informed designs lead to a 20% reduction in cumulative incidence compared to comparable traditional study designs, but have little impact on epidemic length. Power to detect intervention effect is reduced in all connectivity-informed designs, but “holdback” versions provide power that is very close to that of a traditional Stepped Wedge approach.
Conclusions
Incorporating information about cluster connectivity in the design of cluster randomized trials can increase their public health impact, especially in acute outbreak settings. Using this information helps control outbreaks – by minimizing the number of cross-cluster infections – with very modest cost in power to detect effectiveness.
Keywords: Vaccine, cluster randomized trial, Ebola, network, epidemic control, power
Background
Vaccine and other treatment trials are typically designed to ensure sufficient power to detect effects for the intervention under study.1 In an epidemic setting, however, rapid disease control may also be of vital importance. The goal of intervention trials may be to generate proof of efficacy (i.e. benefit to trial participants receiving the intervention), or of effectiveness (i.e. benefit to communities participating in the trial). In an epidemic setting, a trial may also benefit wider society now, if it substantially reduces the number of infectious individuals in the current outbreak, or if it identifies an efficacious intervention for future outbreaks. In this paper we consider designs that are intended to simultaneously address the goals of evaluating effectiveness and of epidemic control.
Statistical inference in the context of vaccine (and other infectious disease) trials is complicated by “dependent happenings” – where the risk of infection of an index depends on the health status of others – which may lead to interference between treatment and control groups.2,3 Cluster randomized trials allow the estimation of combined direct effect (benefit of vaccinating the index) and indirect effect (benefit to the index of vaccinating others). In the commonly-used “Parallel” design, clusters are randomized to treatment or control, and then followed-up for a pre-determined period of time. An alternative approach, the “Stepped Wedge” design, treats all clusters sequentially in a randomized order. In this latter design, intervention effects can be measured through some combination of between- and within-cluster comparisons, accounting for the presence of temporal effects unrelated to the intervention.4, 5 Such designs address logistical difficulties preventing simultaneous intervention roll-out in all clusters, and also have the advantage that the study power is less affected by intraclass correlation than Parallel designs.4 Stepped Wedge designs may be of particular value in settings where efficacy has already been demonstrated in individual-level trials.4
Standard Parallel and Stepped Wedge designs benefit from cluster randomization to prevent possible confounding by underlying heterogeneity in clusters.6 Concerns regarding risk factor imbalance in cluster randomized trials are addressed by matching of clusters based on predictors of outcome, which may also improve efficiency.7 Such designs may be particularly useful in infectious diseases trials, given the likelihood of considerable heterogeneity in outcomes across clusters.8
Cluster randomized trial designs generally seek to minimize contamination between study arms that arises when individuals in different arms have contact with one another,9 but this is not always feasible. For example, in cluster randomized trials for HIV prevention, individuals in one cluster may have partners in another;10 in Ebola vaccine trials, infected individuals from one cluster may travel for care to homes or hospitals in another.11 In an epidemic setting, the degree of connection between clusters is likely to predict outcomes of interest, including outbreak timing within a cluster and epidemic size. Taking between-cluster connectivity into account can therefore aid in matching.
The purpose of a vaccine is to render potentially-infectious network ties (i.e. the direct connection between infectious person i and susceptible person s) non-infectious.12–14 This change can be achieved by successfully vaccinating either end of the tie. Hence, vaccination acts by removing ties from a graph that represents potentially-infectious pathways within a population. Contamination can be conceptualized as a network problem: individuals from clusters randomized to one intervention arm can be impacted by those from clusters randomized to the other arm through ties between them. Such contamination will attenuate the randomized treatment effect observed, and thus limit our ability to measure the causal effect of the intervention.
Recent efforts to measure vaccine efficacy in the context of a waning epidemic have led to innovative designs in which intervention ordering is driven by observed incidence or prevalence of disease (i.e. risk-informed). One such innovative design is the use of “Ring” vaccination – a method previously employed to control smallpox and foot–and–mouth15, 16 – within trials of vaccines against Ebola in Guinea.17, 18 In the Ebola trial, vaccination of all contacts was immediate in the intervention arm, and delayed for three weeks in the control arm.19, 20 Another example is the “risk-prioritized” approach proposed by Bellan et al., in which clusters are assigned to intervention based on recent incident case rates.11
While recent incidence rates are likely to be strong predictor of future case load within a community, the degree to which each community is connected to the outside world, and thus at risk of importing new infection chains, is also likely to predict risk. Taking such connectivity into account when planning the order in which a trial is rolled out to clusters may therefore offer benefits to the trial community, and potentially to those outside this community. It may also increase the public health impact of the trial if clusters treated early on do indeed have higher incidence by virtue of their higher level of connectedness.
We therefore propose a novel class of cluster randomized trial designs, which makes use of information about the connectivity between study clusters. We show that these designs can reduce the number of new infections more rapidly than standard designs, while still allowing for the evaluation of intervention effectiveness. We focus exclusively on Stepped Wedge trials, which are particularly relevant for settings where the intervention’s efficacy has been shown at least in part and when logistic or resource constraints require roll-out in a sequential manner; but where either evidence of field effectiveness is not considered sufficient for licensure, or the usefulness of a licensed vaccine is not sufficiently well established. We investigate the performance of these designs by simulating vaccination trials during an Ebola-like epidemic and evaluate both epidemic outcomes and power to detect the vaccine effect under various designs.
Methods
A class of connectivity-informed cluster trial designs
Connectivity defines how individuals or groups in a network are linked to one-another. For sexually transmitted infections, ties are sexual acts; for hemorrhagic fevers, physical contacts; for behavior change interventions, conversations. In our study, we consider ties measured prior to study start; for each cluster we measure the absolute number of ties from members of the cluster to members of all other clusters. We then rank clusters from most- to least-connected in one of two ways: the “Static Rank” approach, where the ranking is conducted only once at baseline; and the “Adaptive Rank” approach, where clusters that have not yet been assigned to receive the intervention are re-ranked after each randomization based only on their connectedness to other clusters yet to receive the intervention. Both approaches are based on the idea that a cluster’s connectivity to all other clusters is related to its tendency to transmit infections; hence intervening in more connected clusters earlier may slow epidemic spread. Both approaches can be used to determine the order in which interventions will be rolled-out prior to trial commencement, since they use only information available at baseline. We outline the proposed study designs in Figure 1.
Figure 1. A typology of study designs.
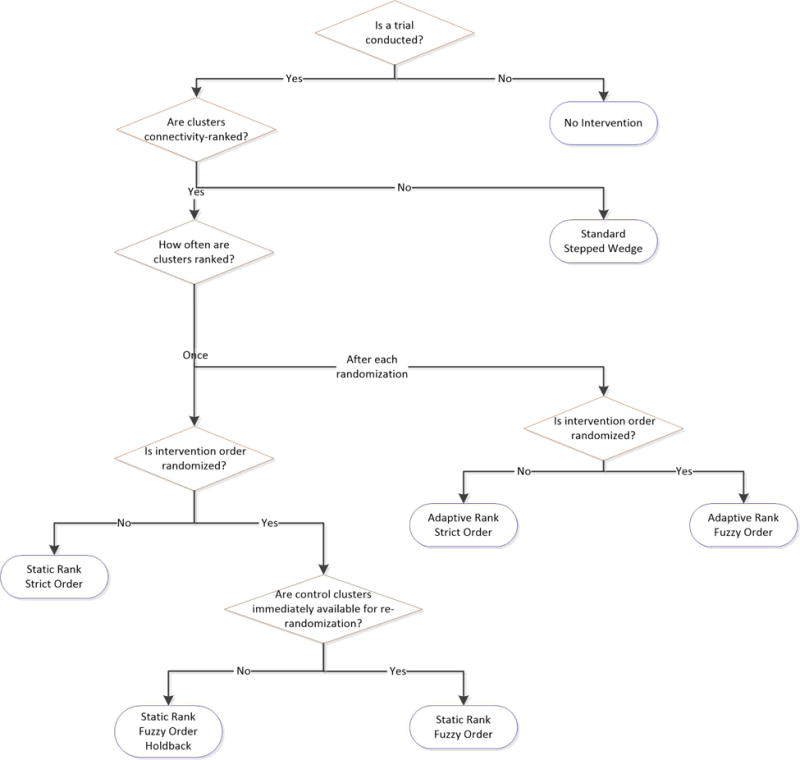
Notes. The seven approaches compared are each shown in the blue rounded rectangles. Strict order designs are unable to evaluate vaccine efficacy.
Within the Static Rank approach, we consider several different designs. First, a “Strict Order” design which rolls-out an intervention in order from the most- to the least-connected clusters; this non-randomized approach roughly provides an upper bound on how fast the epidemic might be controlled using between-cluster connectivity information. Second, a “Fuzzy Order” design which randomizes the two most-connected clusters to intervention and control status at the time of study origin (step 1). At the next time of randomization, the control cluster from step 1 and the next most-connected cluster are randomized. This process is repeated until there is one remaining cluster that has not received the intervention; this cluster is then assigned to intervention. The Fuzzy Order design can be generalized to a “Fuzzy Order Holdback-h” design, in which the control cluster at each time of randomization is held-back from randomization for h intervention time units: if h = 1, the control cluster from step 1 would be re-eligible for randomization at step 3; if h = 2, at step 4, etc. We illustrate how these Static Rank designs operate in Figure 2A. Both Strict Order and Fuzzy Order designs are specific examples of connectivity-informed Stepped Wedge designs, since they are rolled out sequentially based on how connected clusters are.
Figure 2. Between-cluster connectivity calculated at different times in a cluster randomized trial.
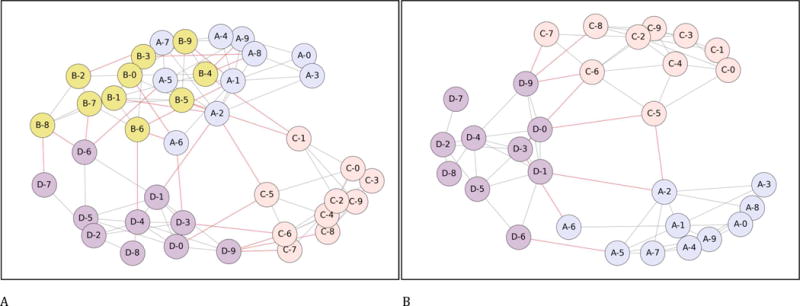
Each figure shows four clusters, each containing 10 individuals. Within-cluster ties are shown in grey (paler) and between-cluster ties are shown in red (darker). In panel A, cluster A has 14 ties to other clusters; cluster B 16; cluster C 8 and cluster D 12; the ordering of cross-cluster ties is thus (B, A, D, C). The Static Rank Strict Order design will follow the order B, A, D, C. The Static Rank Fuzzy Order design will first treat either A or B, with the other acting as control; at step 2, the untreated cluster from A or B will be randomized against D; and at step 3 the remaining untreated cluster will be randomized against cluster C. The Static Rank Fuzzy Order Holdback-1 would first treat either A or B, with the other acting as control and then being barred from randomization at step 2; at step 2 C and D would be randomized; at step 3 only the untreated cluster from the A and B randomization would be available and thus treated; at step 4 the final cluster would be treated.
In panel B, after cluster ‘B’ has been treated and removed from consideration, cluster ‘A’ has moved from the second most-connected to the least-connected cluster; the ordering has now changed to (D, C, A).
All our proposed designs can all also use an Adaptive Rank approach. This approach is particularly relevant for vaccination interventions, since it minimizes provision of the intervention to people whose contacts have already been vaccinated. Because successful vaccination effectively removes the potentially infecting tie between a vaccinated subject and her/his uninfected contact, there is no further benefit to vaccinating susceptible individuals whose contacts have all been successfully vaccinated. This implies that vaccinating a cluster that is highly connected to already-treated clusters is likely to provide less cluster-level benefit than does vaccinating a cluster that is highly connected to untreated clusters. By including only clusters yet to receive the intervention in its measurement of between-cluster connectivity, the Adaptive Rank approach should therefore preferentially target cross-cluster ties that still have the potential to transmit infection.
Removing ties involving clusters that have received the intervention from the set of ties used to define cluster connectivity levels can lead to significant re-rankings (see Figure 2B). Where this leads to more transmissible ties being removed, it should also lead to more rapid epidemic control. The cost of the Adaptive Rank approach is its requirement for more detailed data as compared to the Strict Rank approach: the latter requires only an ordering of clusters by their overall connectivity (K quantities in a study of K clusters), whereas the former requires a measure of connectivity for every pair of clusters .
Simulation studies
We generate a community-structured population using a standard stochastic block model with K = 20 blocks (clusters), with each block consisting of N = 200 nodes (individuals).21 Mean total degree (inclusive of both intra-cluster ties and inter-cluster ties) for each individual is set at 5.5. In the baseline simulation, we assume that within each cluster, ties are distributed uniformly at random across all dyads (node pairs). Half of all clusters are designated to have higher external connectivity: in these clusters, individuals have a number of between-cluster ties drawn from a normal distribution with a mean of 1, compared to 0.5 for the other clusters; the standard deviation of the number of ties for all individuals in all clusters is 0.5.
We simulate an epidemic on the network graph of the community-structured population, using parameter values relevant for Ebola, which provides a recent example of a disease for which preliminary data on vaccine efficacy has been developed. This member of the viral hemorrhagic fever group has caused, acute outbreaks and is, of course, likely to do so again in the future.22 We use a state transition model with six states: Susceptible, Exposed, Infectious, Hospitalized, Funeral, and Removed (see Supplementary Figure 1).21 Parameter values for the simulation are chosen so that progression times between states and the basic reproductive number (R0, the average number of new infections caused by an infectious individual in a fully susceptible population) are roughly equal to those observed for Ebola.23, 24 These values were not optimized to simulate epidemics that resemble those previously observed, as the simulation is intended for design comparison, not Ebola epidemic prediction.
To compare study designs, we first generate a network realization from the stochastic block model. We then simulate seven epidemics on the network, one for each trial design, using the above six-state epidemic model. We initialize the epidemic model by randomly selecting four nodes (corresponding to 0.1% of the population) at the beginning of the simulation to be infected and use the same initial condition for each study design (and for the reference simulation involving no intervention at all). In each case, the epidemic is propagated on the underlying network using daily time steps, and allowed to run for 42 days (six weeks) from the initial introduction of infection. If all seven epidemics have substantial ongoing transmission at this point – specifically the effective reproductive number (Re, the average number of new infections actually caused by each infectious person) is greater than one in week six – then we begin the trial; otherwise we discard this network realization and generate a new realization.
We simulate vaccinating one cluster every seven days. We assume 80% vaccine coverage of susceptible individuals in targeted clusters, and that vaccine immediately removes individuals from a susceptible state 95% of the time. We continue the simulation until each epidemic has died out. We repeat the network generation and epidemic simulation process until we have 1,000 complete realizations. Parameter values for network generation, epidemic model, and infection and vaccination models are provided in Supplementary Table 2.
Statistical analyses
For each simulation we compute three metrics to quantify the epidemic outcomes: (1) time from epidemic start (T0) until Re first falls below one; (2) time from T0 until the last infectious individual recovers; and (3) cumulative incidence for the entire epidemic. These metrics are intended to evaluate the: (i) speed of control; (ii) speed of elimination; and (iii) overall burden of the epidemic. For each metric, we calculate median and interquartile range across all 1,000 simulations.
We compare the statistical power to detect vaccine effectiveness using permutation tests for the five study designs that involve randomization. The null hypothesis is that the cumulative incidence rates in the intervention and control clusters are equal. We evaluate power for a class of test statistics based on the difference in cumulative incidence rates between intervention and control clusters, with varying length of follow-up. The test statistics are calculated from the sum of differences in incidence rates measured during each study week across all applicable pairs of intervention and control clusters. That is, these differences are summed across w weeks after Tk, the date at which the intervention is provided to cluster k. We vary w from 1 to 10. Since there are (K−h−1) randomizations in the trial, the test statistic is the sum of (K − h − 1) terms, where each term represents the difference in cumulative incidence rates between intervention and control clusters within each pair. For example, in a 20-cluster Fuzzy Order trial, which requires 19 randomizations, data from 19 pairs of cluster cumulative incidence rates are used for the test for differing lengths of follow-up.
To generate the permutation null distribution, we randomly permute the treatment assignment within each pair of clusters and calculate the same test statistic as described above. Each permutation test involves 2000 permutations, and p-values are computed as the proportion of test statistics greater or equal to the observed test statistic in absolute value across these 2000 permutations. The validity of the permutation tests is ensured by randomization.25
To assess sensitivity of results to key vaccine, trial and population characteristics, we conduct a range of additional analyses. First, we run a model for a vaccine with no effectiveness (to investigate type-I error control). Second, we model vaccines that are: (i) perfect (100% reach and 100% protective); (ii) poor (70% reach and 70% effective); and (iii) perfect and able to protect those in the Exposed as well as in the Susceptible state, moving them directly to the Removed state. Third, we begin the intervention program at 56 and 70 days post-initial infection. Fourth, we modify the heterogeneity in connectivity between clusters by varying the standard deviation of the number of between-cluster ties from 0.5 to 0.25 and 0.5 to 0.75 contacts. Fifth, we lengthen the time period between intervention steps from 7 to 14 and 21 days. Sixth, we reduce the infectiousness of the infection by 40%, to simulate a less-serious epidemic. Seventh, we consider clusters with skewed distributions for within-cluster ties by drawing each respondent’s degree from a lognormal distribution with σ = 1. Finally, we double the simulation population to 40 clusters, keeping all other parameter values the same, and then randomly select 20 clusters to participate in the trial. Intervention ordering is determined by total connectivity of clusters to both trial and non-trial clusters. The goal of this sensitivity analysis is to evaluate the impact of clusters being connected to the wider world. For each sensitivity analysis we summarize results in terms of the key metrics for epidemic outcomes.
Results
In the absence of an intervention, the spreading process infects a median of 80.0% of the population (interquartile range [IQR] across 1,000 runs: 78.9–81.1%), peaks at a mean of 107.4 incident cases per 1000 susceptible individuals per week, and dies out after a median of 292 days (IQR 270–317). Mean Re declines slowly from a peak of 2.08 on day 36, falling below 1 after a median of 149 days (IQR: 137–164). Temporal plots of mean values for all state variables are shown in Supplementary Figure 2.
As intended, all study designs lead to substantial reductions in proportion of individuals ever infected, time to end of outbreak and time to Re<1, relative to no intervention (Table 1). All connectivity-informed designs lead to lower peak infectiousness than traditional study designs, with little discernible difference among them (Figure 3B). Connectivity-informed designs reduce the proportion of individuals ever infectious relative to the Standard Stepped Wedge by approximately 20%, but do not have meaningful impact on time to last infection or to infection control (Table 1).
Table 1.
Population-level spreading process outcomes
| Proportion ever infectious (%) | Time to Re < 1 (days) | Time to last infectious individual (days) | |
|---|---|---|---|
|
|
|
|
|
| No randomization | |||
| No Vaccination | 80.0 [78.9 – 81.1] | 149 [137 – 164] | 292 [270 – 317] |
| Static Rank Strict Order | 29.7 [20.6 – 37.8] | 130 [119 – 140] | 229 [217 – 242] |
| Adaptive Rank Strict Order | 29.3 [19.9 – 37.5] | 129 [118 – 140] | 228 [216 – 242] |
| Stepped Wedge designs | |||
| Standard Stepped Wedge | 35.8 [28.0 – 42.0] | 131 [120 – 141] | 226 [216 – 240] |
| Static Rank Fuzzy Order | 29.6 [21.3 – 37.0] | 131 [120 – 141] | 227 [217 – 241] |
| Static Rank Fuzzy Order Holdback-1 | 31.2 [22.6 – 38.6] | 130 [119 – 140] | 226 [216 – 240] |
| Adaptive Rank Fuzzy Order | 28.9 [20.2 – 37.9] | 130 [118 – 141] | 230 [218 – 242] |
Notes. All outcome figures are medians and interquartile ranges of result from 1000 simulation realizations. Re: effective reproductive number.
Figure 3.
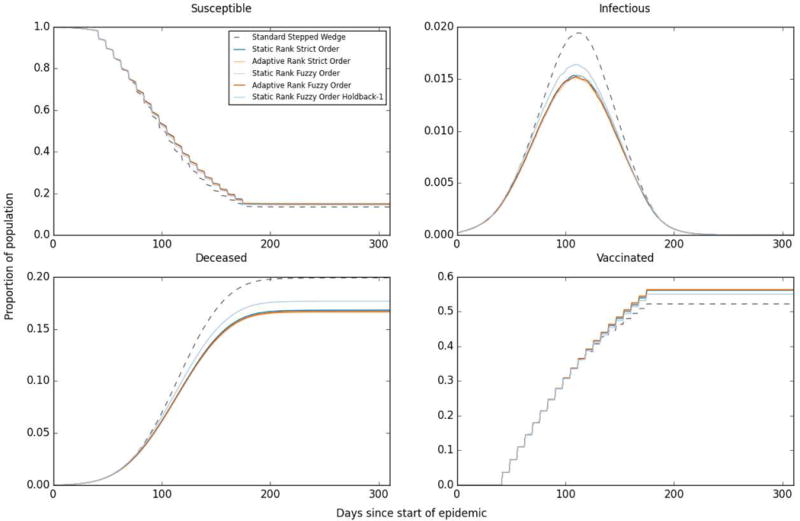
Mean state values for each day since the start of the epidemic across 1000 simulations, selected states
Cluster-level mean incidence rates decline as each cluster receives the intervention (Figure 4). In the Static Rank approach, the clusters that receive the intervention last – and thus have lowest baseline connectivity – have notably lower incidence rates throughout the follow-up period; this is not the case for the other designs where clusters receiving the intervention last are determined either at random (Standard approach) or based on Adaptive Ranks.
Figure 4. Mean weekly incidence (per 1000 susceptible individuals) within clusters.
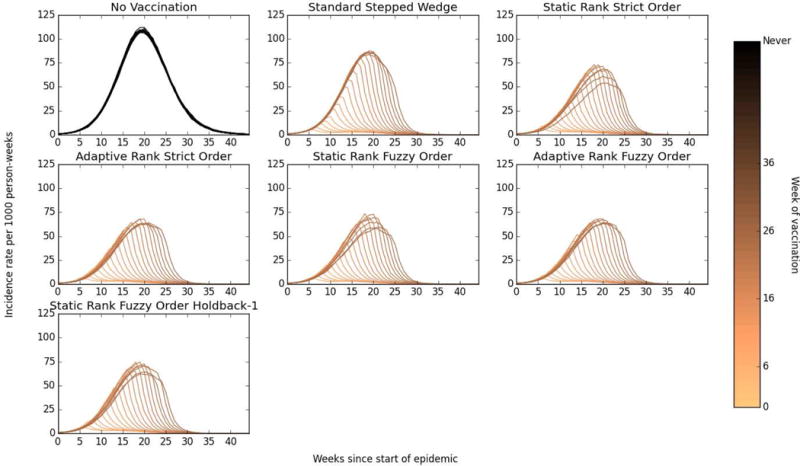
Darker lines represent earlier randomization times, thus the darkest line represents the mean incidence rate in clusters that were treated at the first possible time point (week 6) in each simulation realization.
The Standard Stepped Wedge design has the greatest power to detect differences in incidence rates when using data collected over any length of time post-intervention, rising from 61.8% using data from the first seven days to 82.7% after 2 weeks and 90.4% after 3 weeks (Figure 5). While the trends for the Fuzzy Order designs are similar, the levels of power to detect effects are markedly lower, starting at 47.1% (Static Order) and 45.8% (Adaptive Order) after 1 week, and plateauing at 72% (both orderings) based on 10 weeks of data. The Holdback-1 design falls between the Standard and Fuzzy Order designs, with 56.3% power after 1 week, 74.7% after 2 weeks and 91% after 10 weeks. The lower power of connectivity-informed designs reflects the impact of subsequent intervention on control communities within each pair of clusters.
Figure 5. Comparison of statistical power of various study designs.
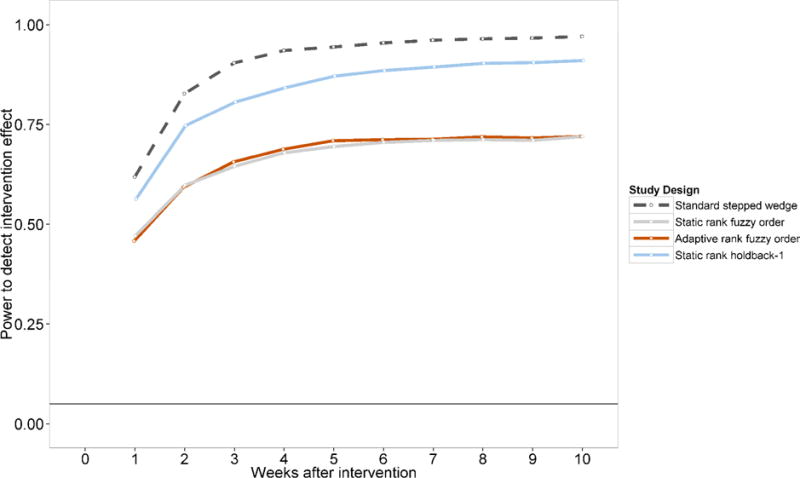
Figure shows the proportion of 1000 simulations that reject the null hypothesis of no difference at α=0.05 between the intervention and control clusters using a permutation test with varying test statistics. Comparisons are therefore across K – h – 1 pairs of cluster-observation time: i.e. 18 pairs for the Holdback-1 design; 19 for the remainder.
Each datapoint in this figure represents a power estimate comparing the cumulative incidence up to the week in question (e.g. the points at “3 weeks after intervention” compare incidence rates over days 1 to 21 after each intervention in the intervention and control clusters). Data on which this figure is based are shown in Supplementary Table 1.
In our first sensitivity analysis we show that when the vaccine is ineffective, cumulative incidences are indistinguishable across intervention approaches and the empirical type-I errors are close to 5% as expected, illustrating the validity of the permutation tests (Supplementary Table 1). Sensitivity analyses also suggest that time to epidemic end is affected strongly by the effectiveness of the vaccine; a vaccine that protects only 50% of vaccinated people leads to outcomes almost equal to no vaccine at all. Less-effective vaccine scenarios lead to both lower power to detect effects and reduced benefits in terms of lower cumulative incidence associated with connectivity-informed designs. Greater heterogeneity in the level of between-cluster connectedness leads to greater epidemic control benefits from the proposed designs and slightly greater power losses compared to the Standard Stepped Wedge design, although these effects were relatively small within the range of parameter values we considered.
Expanding the time between each study step prolongs the epidemic, leading to higher cumulative incidence than does a 7-day step length; as a result, connectivity-informed designs give almost identical results as does the standard design. When we reduce the infectiousness of infected subjects, any intervention is extremely effective in reducing cumulative incidence (from around 40% with no intervention to under 4% in all designs), while power after 1 week is reduced by approximately one-third (3 percentage points) under all connectivity-informed designs compared to the Standard Stepped Wedge.
Finally, analyses in which we either wait until the epidemic is more advanced (start at 8 or 10 weeks) or run the trial within a subset of a larger population (20 out of 40 clusters), cumulative incidence is roughly equal across all connectivity-informed designs (and approximately 10% lower than for the standard design aside from the 10 week start). Power at 1 week is only slightly lower for the Fuzzy Order approach than for the Standard Stepped Wedge, but is higher for the Holdback-1 approach.
Discussion
In this article we propose a class of connectivity-informed designs for cluster randomized trials that provide more rapid epidemic control in return for reduced ability to detect intervention effects that varies from minimal to considerable. This potential addition to the trial design arsenal for epidemic settings is made possible by leveraging knowledge of the contact network between clusters. Based solely on a relative ordering of how connected members of a cluster are to the outside world (Static Rank) or absolute levels of connectivity (Adaptive Rank), our designs aim to minimize the potential number of cross-cluster infections that can arise, and thus reduce both the rate at which incidence grows and the overall epidemic size. In simulation studies, we show that such designs reduce the total number of infections in the study population by up to 20%, compared to traditional Stepped Wedge cluster randomized trials. This benefit appears to be spread across clusters receiving the intervention both early and late in the trial (Figure 4) across a wide range of sensitivity scenarios.
In any trial of an intervention that is expected to reduce disease burden, the primary goal is generally to test vaccine efficacy (or effectiveness) and obtain randomized estimates of vaccine effects (either efficacy or effectiveness). Nonetheless, achieving a public health benefit for those within the trial may also be desirable and achievable – for example, in the next outbreak of Ebola. Our designs are most relevant when some preliminary evidence of vaccine efficacy has been developed: as our class of designs is likely to be more applicable for effectiveness than for efficacy trials, we apply them to Stepped Wedge trials. For example, for interventions intended to control the vectors carrying Zika virus, our design might be appropriate, provided that data are available on how mosquitoes link communities together.
Within the class of designs we propose, the relative level and timing of each study’s ability to detect a difference between study arms varies. The upward sloping power curves in Figure 5 reflect the indirect effect of vaccination of an index on other members of intervened-upon clusters that arises from the fact that a case prevented in one time period has follow-on benefits in subsequent periods.3 All of the connectivity-informed designs perform worse in terms of power than their traditional counterparts, even in the period immediately following intervention, at least in part due to the lower overall cumulative incidence seen in these scenarios. Lower power a few weeks post-vaccination is to be expected for the Fuzzy Order designs, as a cluster which is a control at one time point can be randomized to vaccination status at later time points, potentially underestimating intervention effects.
Nonetheless, adding a holdback period (i.e. a period after randomization to control status in which each control cluster cannot be vaccinated), greatly improves study power in our simulations – regaining more than two-thirds of the power lost by shifting from a Standard to Fuzzy Order design, with little impact on infection levels. While longer gaps between intervention steps can also allow for incidence differences to arise between arms, such pauses also increase the overall cumulative incidence in the population, potentially removing too many susceptibles prior to intervention (as we see in our sensitivity analysis). A brief holdback period therefore appears useful in settings where insufficient sample sizes can otherwise be obtained. Less-effective vaccine scenarios lead to both lower power to detect effects and reduced benefits in terms of lower cumulative incidence associated with connectivity-informed designs.
The choice of design within our connectivity-informed class will depend on the study goals. A Strict Order design should be most effective for epidemic control, since it leads to the fastest immunization of potentially-infectious ties between clusters; but it does not provide randomized comparisons. A Fuzzy Order design includes randomization; however, it can only ensure that each control cluster remains without intervention for a single period. Depending on how fast the infection spreads, this may not be sufficient for substantial differences between intervention and control arms to emerge. Adding holdback periods to the Fuzzy Order design offers the assurance that control clusters remain without intervention for longer periods of time, which can allow larger differentials in observed incidence rates to arise. The trade-off is that some highly connected clusters may not receive the intervention early on.
These connectivity approaches can be applied to Parallel or Stepped Wedge design, although we present only the latter as examples here. It is less clear, however, if and when connectivity-informed designs would perform better or worse than risk-informed ones such as a ring vaccination trial18, 20 or Bellan’s incidence-prioritized model.11 The relative benefit is likely to depend on both the ease of identifying incident infections, which depends on the proportion of infections that are symptomatic and the uniqueness of symptoms, and the ease of detecting relevant connections between clusters. The relative benefit will also depend on the specifics of the epidemic.
A combination of both approaches may be possible: for example, prioritizing clusters for randomization based on some weighted combination of high incidence and high connectivity (drawing on our Static Rank approach), or high levels of connection to clusters with high incidence (drawing on our Adaptive Rank approach).
Another way to incorporate both risk and connectivity would be to use different designs at different epidemic stages. Connectivity-informed designs are likely to have the greatest ability to reduce infections early in the epidemic, when many clusters have low incidence. In such a situation, the ability to stop infections from reaching clusters other than those receiving the intervention, i.e. acting as a fire-break, is greatest. Once the epidemic is widespread or waning, this inter-cluster spillover benefit will be reduced, as seen in the lesser control benefit of connectivity-informed approaches in our sensitivity analyses which started the epidemic later, were less infectious, or were also seen in non-trial clusters. Thus a connectivity-informed approach might be best early on, but a risk-informed one more powerful later in the epidemic.
In addition to the stage of the epidemic, the nature of the connection network is also likely to be important in determining the benefit of a connectivity-informed approach in at least two ways. First, the better-defined the clusters (i.e. the lower the ratio of between-cluster to within-cluster connectivity), the more useful a connectivity-informed approach is likely to be. Second, the more heterogeneous the between-cluster connectivity, the more benefit is likely to arise from prioritizing the most connected clusters, since a larger proportion of all between-cluster ties will be effectively eliminated early on in such settings.
A key aspect of our proposed methods is the assumption that connectivity can be quantified; we stress that our method requires only between-cluster connectivity measures. For the Static Rank approach, only a rank ordering of the connectivity between each cluster and all other individuals (either within or without the trial) is required. While we have focused on connectivity within the trial population itself, all connections outside a cluster can be used to generate measures of connectivity, and indeed when the epidemic under consideration is widespread it would seem prudent to do so.
Ideally, measures of connectivity would be based on empirical data on the type of ties through which the epidemic is passed (e.g. sexual episodes, physical contacts, mosquito movements). Such information is unlikely to be quickly accessible in the context of a fast-moving epidemic. However, more readily measured statistics can potentially be used as proxies. In the context of the designs we present, the crucial aspect of connectivity is the density of connections between cluster pairs. Call detail records for cellphones offer one empirical way to ascertain such densities,26 and they have been used previously to infer approximate residential locations for large numbers of people27 and to learn about their mobility patterns.28 Indeed, a recent study considered how call detail records might be used to estimate between-cluster mixing in the context of a cluster randomized trial.29 Call detail record data can be augmented by self-reported mobility data,30 or data on traffic flows, should such be available. In the absence of rapidly available empirical data on connectivity, a gravity model utilizing only the spatial distance between clusters and their population sizes can be highly effective in predicting how epidemics will spread, particularly for infections spread by interpersonal contact, such as cholera.31 These data can all be analyzed prior to the start of a trial, and different network measures of interest easily recomputed based on the order of cluster intervention.
Limitations of our approach arise from its need for information on connectivity regarding ties through which epidemics are passed (e.g. sexual partners, close contact). This information is not easy to gather accurately, and insofar as it is mis-measured or evaluated via proxy variables, clusters may be mis-ranked. Such mis-ranking may reduce the performance of our proposed designs in reducing overall incidence, though even mis-ranking should not cause overall incidence to be worse than under Standard approaches on average. Second, our designs add complications regarding interpretation of the randomized effect of vaccine in the presence of between-cluster interference, due in part to the fact that random assignment of a cluster depends on prior randomizations. In the presence of connectivity among clusters, the randomized effect differs from the overall causal effect; i.e., the difference between the effect of providing the intervention to all clusters compared to providing it to none.32 In our designs, the order of randomization would impact the randomized effect because the cluster pairs are formed based on connectivity.
This paper could be extended in several ways. First, our set of study designs is not exhaustive. Connectivity information could be used in various other ways, for example it could be measured relative to an outbreak source. Alternatively, one might wish to account for the nature of networks within clusters,10 either in addition to or instead of between-cluster connections. Second, we have presented a vaccine candidate for Ebola but our designs could be applied to interventions for other infections as well as to the spread of ideas or behaviors. The only requirements for our methods are the existence of a spreading process and an intervention that affects this process. Third, we have presented a simple case in which the study population is homogeneous except for each person’s number of contacts. The approach can be extended to adjust for individual covariates of individuals, or characteristics (e.g. strength) of the ties between individuals.
Conclusion
Making use of information about cluster connectivity can allow for cluster randomized trial designs to address both the need for randomized evidence on effectiveness and to serve as public health interventions in their own right – especially in acute outbreak settings. While the performance of these designs depends on the infection and the social context of the outbreak, connectivity-informed designs may play an important role in the implementation of novel interventions for which evidence of efficacy has been established.
Supplementary Material
Acknowledgments
We thank participants at the 2015 Ebola Modeling Workshop at Georgia Tech, at Healthmap and in the Onnela lab group for comments on presentations of these ideas. We thank Laura Balzer and Ravi Goyal for their several helpful comments on a draft of this paper.
Financial support: This research was supported by the National Institutes of Health [grant numbers R37 AI51164, R01 AI24643].
Footnotes
Disclaimer: The funders had no role in study design, data collection and analysis, decision to publish, or preparation of the manuscript.
Authors’ contributions: All authors contributed to the study conception and design, data interpretation and final revisions to the text. GH conducted the network simulations and statistical analyses with contributions from RW and JPO. GH summarized the results in tables and graphs and wrote the first draft of the paper.
Declaration of conflicting interests: The Authors declare that there is no conflict of interest.
References
- 1.Halloran ME, Struchiner CJ, Longini IM. Study designs for evaluating different efficacy and effectiveness aspects of vaccines. Am J Epidemiol. 1997;146:789–803. doi: 10.1093/oxfordjournals.aje.a009196. [DOI] [PubMed] [Google Scholar]
- 2.Halloran ME, Struchiner CJ. Study designs for dependent happenings. Epidemiology. 1991;2:331–338. doi: 10.1097/00001648-199109000-00004. [DOI] [PubMed] [Google Scholar]
- 3.Halloran ME, Haber M, Longini IM, et al. Direct and indirect effects in vaccine efficacy and effectiveness. Am J Epidemiol. 1991;133:323–331. doi: 10.1093/oxfordjournals.aje.a115884. [DOI] [PubMed] [Google Scholar]
- 4.Hussey MA, Hughes JP. Design and analysis of stepped wedge cluster randomized trials. Contemp Clin Trials. 2007;28:182–191. doi: 10.1016/j.cct.2006.05.007. [DOI] [PubMed] [Google Scholar]
- 5.Lipsitch M, Eyal N, Halloran ME, et al. Ebola and beyond. Science. 2015;348:46–48. doi: 10.1126/science.aaa3178. [DOI] [PMC free article] [PubMed] [Google Scholar]
- 6.Hargreaves JR, Prost A, Fielding KL, et al. How important is randomisation in a stepped wedge trial? Trials. 2015;16:359. doi: 10.1186/s13063-015-0872-1. [DOI] [PMC free article] [PubMed] [Google Scholar]
- 7.Campbell M, Donner A, Klar N. Developments in cluster randomized trials and Statistics in Medicine. Stat Med. 2007;26:2–19. doi: 10.1002/sim.2731. [DOI] [PubMed] [Google Scholar]
- 8.Hayes R, Alexander ND, Bennett S, et al. Design and analysis issues in cluster-randomized trials of interventions against infectious diseases. Stat Methods Med Res. 2000;9:95–116. doi: 10.1177/096228020000900203. [DOI] [PubMed] [Google Scholar]
- 9.Hayes R, Moulton L. Cluster randomised trials. Boca Raton, FL: Chapman & Hall/CRC; 2009. [Google Scholar]
- 10.Wang R, Goyal R, Lei Q, et al. Sample size considerations in the design of cluster randomized trials of combination HIV prevention. Clin Trials. 2014;11:309–318. doi: 10.1177/1740774514523351. [DOI] [PMC free article] [PubMed] [Google Scholar]
- 11.Bellan SE, Pulliam JR, Pearson CA, et al. Statistical power and validity of Ebola vaccine trials in Sierra Leone: a simulation study of trial design and analysis. Lancet Infect Dis. 2015;15:703–710. doi: 10.1016/S1473-3099(15)70139-8. [DOI] [PMC free article] [PubMed] [Google Scholar]
- 12.Hébert-Dufresne L, Allard A, Young JG, et al. Global efficiency of local immunization on complex networks. Sci Rep. 2013;3:2171. doi: 10.1038/srep02171. [DOI] [PMC free article] [PubMed] [Google Scholar]
- 13.Meyers L. Contact network epidemiology: Bond percolation applied to infectious disease prediction and control. Bull New Ser Am Math Soc. 2007;44:63–86. [Google Scholar]
- 14.Cohen R, Havlin S, Ben-Avraham D. Efficient immunization strategies for computer networks and populations. Phys Rev Lett. 2003;91:247901. doi: 10.1103/PhysRevLett.91.247901. [DOI] [PubMed] [Google Scholar]
- 15.Keeling M, Woolhouse M, May R, et al. Modelling vaccination strategies against foot-and-mouth disease. Nature. 2003;421:136–142. doi: 10.1038/nature01343. [DOI] [PubMed] [Google Scholar]
- 16.Kretzschmar M, Van den Hof S, Wallinga J, et al. Ring vaccination and smallpox control. Emerg Infect Dis. 2004;10:832–841. doi: 10.3201/eid1005.030419. [DOI] [PMC free article] [PubMed] [Google Scholar]
- 17.Enserink M. High hopes for Guinean vaccine trial. Science. 2015;347:219–220. doi: 10.1126/science.347.6219.219. [DOI] [PubMed] [Google Scholar]
- 18.Ebola ça Suffit Ring Vaccination Trial Consortium. The ring vaccination trial: a novel cluster randomized controlled trial design to evaluate vaccine efficacy and effectiveness during outbreaks, with special reference to Ebola. BMJ. 2015;351:h3740. doi: 10.1136/bmj.h3740. [DOI] [PMC free article] [PubMed] [Google Scholar]
- 19.World Health Organization. Questions and Answers – Ebola Phase III Vaccine Trial in Guinea. 2015 [Google Scholar]
- 20.Henao-Restrepo AM, Longini IM, Egger M, et al. Efficacy and effectiveness of an rVSV-vectored vaccine expressing Ebola surface glycoprotein: interim results from the Guinea ring vaccination cluster-randomised trial. Lancet. 2015;386:857–866. doi: 10.1016/S0140-6736(15)61117-5. [DOI] [PubMed] [Google Scholar]
- 21.Anderson CJ, Wasserman S, Faust K. Building stochastic blockmodels. Soc Networks. 1992;14:137–161. [Google Scholar]
- 22.Check Hayden E. Disease specialists identify post-Ebola threats. Nature. 2015 doi: 10.1038/nature.2015.18952. [DOI] [Google Scholar]
- 23.Legrand J, Grais R, Boelle P, Valleron A, Flahault A. Understanding the dynamics of Ebola epidemics. Epidemiol Infect. 2007;135:610–621. doi: 10.1017/S0950268806007217. [DOI] [PMC free article] [PubMed] [Google Scholar]
- 24.WHO Ebola Response Team. Ebola virus disease in West Africa—the first 9 months of the epidemic and forward projections. N Engl J Med. 2014;371:1481–1495. doi: 10.1056/NEJMoa1411100. [DOI] [PMC free article] [PubMed] [Google Scholar]
- 25.Rosenbaum PR. Interference between units in randomized experiments. J Am Stat Assoc. 2007;102:191–200. [Google Scholar]
- 26.Onnela J-P, Saramäki J, Hyvönen J, et al. Structure and tie strengths in mobile communication networks. Proc Natl Acad Sci USA. 2007;104:7332–7336. doi: 10.1073/pnas.0610245104. [DOI] [PMC free article] [PubMed] [Google Scholar]
- 27.Onnela J-P, Arbesman S, González MC, et al. Geographic constraints on social network groups. PLoS One. 2011;6:e16939. doi: 10.1371/journal.pone.0016939. [DOI] [PMC free article] [PubMed] [Google Scholar]
- 28.Wesolowski A, Eagle N, Tatem AJ, et al. Quantifying the impact of human mobility on malaria. Science. 2012;338:267–270. doi: 10.1126/science.1223467. [DOI] [PMC free article] [PubMed] [Google Scholar]
- 29.Staples PC, Ogburn EL, Onnela JP. Incorporating contact network structure in cluster randomized trials. Sci Rep. 2015;5:17581. doi: 10.1038/srep17581. [DOI] [PMC free article] [PubMed] [Google Scholar]
- 30.Wesolowski A, Stresman G, Eagle N, et al. Quantifying travel behavior for infectious disease research: a comparison of data from surveys and mobile phones. Sci Rep. 2014;4:5679. doi: 10.1038/srep05678. [DOI] [PMC free article] [PubMed] [Google Scholar]
- 31.Tuite AR, Tien J, Eisenberg M, et al. Cholera epidemic in Haiti, 2010: using a transmission model to explain spatial spread of disease and identify optimal control interventions. Ann Intern Med. 2011;154:593–601. doi: 10.7326/0003-4819-154-9-201105030-00334. [DOI] [PubMed] [Google Scholar]
- 32.Carnegie NB, Wang R, DeGruttola V. Estimation of the overall treatment effect in the presence of interference in cluster-randomized trials of infectious disease prevention. Epidemiol Method. 2016 doi: 10.1515/em-2015-0016. in press. [DOI] [PMC free article] [PubMed] [Google Scholar]
Associated Data
This section collects any data citations, data availability statements, or supplementary materials included in this article.