Abstract
Various clinical applications of high intensity focused ultrasound (HIFU) have different requirements for the pressure levels and degree of nonlinear waveform distortion at the focus. The goal of this work was to determine transducer design parameters that produce either a specified shock amplitude in the focal waveform or specified peak pressures while still maintaining quasilinear conditions at the focus. Multi-parametric nonlinear modeling based on the KZK equation with an equivalent source boundary condition was employed. Peak pressures, shock amplitudes at the focus, and corresponding source outputs were determined for different transducer geometries and levels of nonlinear distortion. Results are presented in terms of the parameters of an equivalent single-element, spherically shaped transducer. The accuracy of the method and its applicability to cases of strongly focused transducers were validated by comparing the KZK modeling data with measurements and nonlinear full-diffraction simulations for a single-element source and arrays with 7 and 256 elements. The results provide look-up data for evaluating nonlinear distortions at the focus of existing therapeutic systems as well as for guiding the design of new transducers that generate specified nonlinear fields.
Index Terms: nonlinear waves, focusing, KZK equation, Westervelt equation, shock front, high intensity focused ultrasound, ultrasound surgery, histotripsy
I. Introduction
During the last decade, many novel therapeutic applications have rapidly developed for high intensity focused ultrasound (HIFU). One such application is noninvasive ultrasound surgery, in which a HIFU beam is focused within the body to induce rapid localized heating of tumor tissues [1]. This approach has been already used to treat tumors in various organs: prostate [2], uterus [3], kidneys [4], liver [5], breast [6], and bones [7]. Recently, the first successful surgeries were performed on brain for treating essential tremor using ultrasound irradiation through the skull [8]. Research continues on the possibility of many other applications: targeted drug delivery, mitigating internal bleeding, thrombolysis, stimulating the growth of micro-vessels after a heart attack, treating arrhythmia, and others.
However, despite the clinical success of HIFU applications, certain drawbacks of current thermal HIFU treatments are apparent. Among them are long treatment times; uncertainty in ablation volumes due to thermal diffusion and perfusion; difficulties in ablating tissue close to vessels, bones, and other critical structures; side effects of nearfield heating; and limitations of imaging modalities for treatment monitoring. For example, it takes multiple hours to destroy tumors of several cubic centimeters in size using an MR-guided (MRg) clinical HIFU system [3].
To overcome these challenges, high-power therapeutic systems capable of generating nonlinear waveforms with high-amplitude shock fronts and sonication protocols that utilize the physical effects of shock waves in tissue have attracted increasing attention from researchers. Thermal treatments can be accelerated using shock-wave heating since the efficiency of ultrasound energy absorption at the shocks is increased more than tenfold in comparison to harmonic waves of the same amplitude [9, 10]. Due to fast heating, diffusion effects can be diminished so that the ablated volume follows the geometry of irradiation, enabling treatment of localized volumes close to critical structures. Moreover, as shock-wave heating is localized close to the focus, nearfield heating effects can be minimized. In addition, fast tissue heating by shocks to boiling temperatures makes it possible to use ultrasound (US) imaging to monitor treatments using the echogenicity of vapor bubbles [11, 12, 10]. Several existing clinical systems that utilize real-time US imaging operate at very high in situ intensities and likely produce shock-wave tissue heating and boiling [13, 2, 14].
Besides thermal HIFU, two novel ultrasound surgical methods of mechanical tissue ablation (histotripsy) using shock waves have been recently developed [15, 16, 17, 18]. Both methods use sequences of high-amplitude pulses with a duty factor of <1%. One method uses microsecond-long pulses to fractionate tissue in the focal region by generating a cavitation cloud from an initially induced bubble through a cascade of reflections of high-amplitude shocks [19]. Another method termed boiling histotripsy (BH) uses millisecond-long pulses with shock fronts that induce localized boiling in tissue within each pulse; further interaction of shock waves with the vapor cavity results in mechanical tissue fractionation [20]. Despite different physical mechanisms of action, both methods enable mechanical disintegration of tissue into subcellular fragments.
To implement various histotripsy treatments, ultrasound transducers capable of generating high-amplitude shock fronts (>60 MPa) at the focus are necessary. On the other hand, for certain purely thermal therapies, the absence of shock fronts may be preferable, because shock formation changes the heating pattern in tissue predicted by linear wave propagation models and thus complicates the irradiation protocol. Some recent cavitation-based applications like microtripsy rely on very high peak negative pressures [21] that are difficult to achieve when shocks form and nonlinear saturation effects limit the focal pressures.
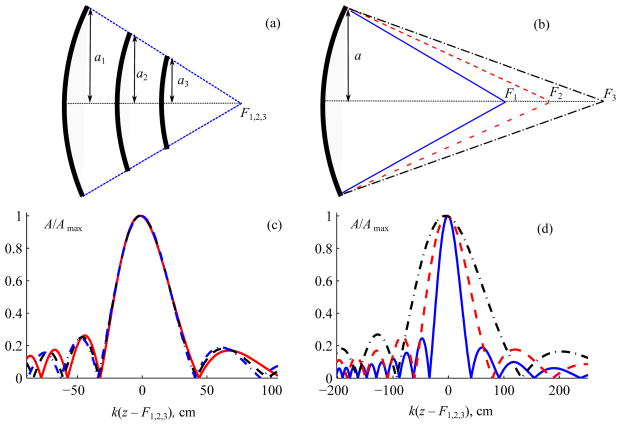
To develop HIFU treatments that will either utilize shock-wave action or avoid strong nonlinear effects and shocks, it is therefore necessary to determine parameters of an ultrasound source that deliver specified pressure levels at the focus with an optimal degree of nonlinear effects. In our earlier study it was proposed that the most important parameter of the source that controls nonlinear effects is its focusing angle – i.e., the angle between the acoustic axis and the path from the focus to the aperture edge [22]. This hypothesis is illustrated in Fig. 1 where pressure amplitude distributions on the axis of linearly focused beams are shown for spherically shaped single-element sources. Only sources with large apertures compared to a wavelength are considered (ka ≫ 1); this criterion is almost always satisfied for medical HIFU transducers. Pressure distributions are calculated using the Rayleigh integral [23] and are normalized to the corresponding maximum values. The focusing angle of a source is characterized by its F-number, which is defined as F# =F/2a for an axisymmetric transducer with focal length F and radius a. As shown in Fig. 1(a, c) for transducers with different radii but the same F-number, the shape and length of the focal lobe are very similar (Fig. 1(c)). For transducers with different F-numbers, pressure distributions are significantly different (Fig. 1(b, d)). For transducers with higher F-numbers and thus weaker focusing, the length of the focal diffraction lobe is larger than for the highly focused ones.
Fig. 1.
Normalized axial pressure amplitude distributions A/Amax for focused spherical transducers with (a), (c) the same and (b), (d) different F-number values. For normalization, Amax is the maximum value in the linear beam for a transducer of a given geometry. Here, a is the transducer radius, k is the wavenumber, F1,2,3 are the focal distances, and k(z–F1,2,3) is the dimensionless axial coordinate along the transducer axis shifted to the focal point. Examples are given for transducers with 1 MHz frequency and (a) a = 3, 4, 5 cm, F# = 0.9; (b) a = 5 cm, F# = 0.9, 1.2, 1.5.
Nonlinear effects are strongest in the high-amplitude focal region of the beam and accumulate with distance. Assuming that the nonlinear effects outside of the focal lobe are negligible, beams with the same F-number and therefore same length of the focal lobe (Fig. 1(c)) should form shock fronts at the same focal pressures, regardless of the transducer aperture 2a. On the contrary, for sources with different F-numbers (Fig. 1(b)), shock fronts should form at lower pressure levels in weakly focused beams with longer focal lobes. Thus, by varying the focusing angle of the source, it is possible to achieve a specified degree of nonlinear effects at a certain focal pressure level.
A method of solving such an inverse nonlinear problem has been recently proposed based on multi-parametric solutions to the Khokhlov-Zabolotskaya-Kuznetsov (KZK) equation [22]. Using this method, parameters of the planar boundary condition to the KZK model at which certain shock amplitudes are achieved at the focus were determined for continuous-wave operating conditions. The goal of the current study was to generalize this previously developed approach to determine transducer parameters that would produce either a specified shock amplitude at the focus or specified peak pressures while still maintaining quasilinear waveform distortion. It is also proposed to reformulate these results in the context of more realistic sources, including single-element transducers with spherically curved shapes as well as multi-element arrays with more complicated geometries.
Toward this end, an equivalent-source approach was used to recalculate parameters of the planar boundary condition to the KZK model to define parameters of an equivalent spherical, single-element source [24]. Geometric parameters of spherically shaped transducers and power outputs were determined to achieve specified focal pressures for three characteristic levels of nonlinear distortion: quasilinear waveforms, waveforms with fully developed shocks, and saturated waveforms. To validate the accuracy of the proposed approach, full diffraction nonlinear Westervelt modeling and high-output characterization measurements were performed for three representative strongly focused HIFU sources: a single-element 1-MHz histotripsy source [25], a custom-built 7-element transducer array designed for boiling histotripsy [26], and a 256-element HIFU array from a clinical MR-guided HIFU system [27]. A relationship was established between each of these sources and an equivalent single-element planar source for the parabolic model or a spherical source for the full diffraction model based on matching measured and modeled axial distributions of acoustic pressure at low output levels.
The results of this work are presented as the dependencies of the peak pressures and shock amplitude in the pressure waveform at the focus as functions of transducer parameters. Three characteristic levels of nonlinear waveform distortion at the focus are considered. Corresponding intensity values at the source at which these distortions are achieved are determined. The quantitative summary of the study is a look-up table for choosing a focusing angle of a HIFU transducer to obtain a certain nonlinear distortion at the focus at the desired pressure levels.
II. Methods
A. Benchmark Modeling with the Westervelt Equation
Modeling based on the Westervelt equation was used to validate results obtained with the KZK model by simulating nonlinear beam focusing for three representative HIFU sources. To introduce the full 3D problem and the attendant notations, this model is presented first.
The Westervelt equation [28] has been widely used as an accurate model to simulate nonlinear acoustic beams generated by strongly focused therapeutic sources at different output levels [27, 29, 30, 31, 32]. The equation includes the effects of nonlinearity, diffraction, and thermoviscous absorption. Details of the numerical algorithm used in this effort have been described in earlier publications [27, 33] and are briefly summarized here.
To model a beam propagating in a direction aligned with the spatial coordinate z, the Westervelt equation written in a retarded time coordinate and a corresponding boundary condition in the plane z = 0 can be expressed as follows:
| (1) |
Here, p is the acoustic pressure, τ=t−z/c0 is the retarded time, Δ = ∂2/∂x2+ ∂2/∂y2+ ∂2/∂z2, and c0 is the sound speed of the medium. In addition, β, ρ0, and δ denote the nonlinearity coefficient, density, and diffusivity of sound of the medium, respectively.
For the boundary condition, pressures p(τ,x,y,z=0) are defined in the plane at the apex of the source, z = 0. These pressures are represented by a single frequency ω0 =2πf0 where f0 is the cyclical operating frequency of the transducer. For two array transducers considered in this paper, spatial distributions of the initial pressure amplitude and phase were determined from acoustic holography measurements conducted at low output levels [34]. Measurements to define a hologram were made in a planar region perpendicular to the beam axis between the source and the focus [26, 27, 35]. The measured hologram was then linearly backpropagated to define the field in the initial plane of modeling z = 0. For the spherical, single-element transducer, a uniform distribution of the normal component of the vibrational velocity over its surface was assumed. The Rayleigh integral was used to calculate a virtual hologram, which was then backpropagated to the initial plane z = 0 [23]. Finally, boundary conditions obtained at low pressures were scaled in amplitude for multiple simulations over a range of operating output levels.
Numerical solutions of Eq. (1) were obtained using a previously developed algorithm [33]. The method of fractional steps with an operator splitting procedure of second-order accuracy over the propagation distance z was employed [29]. The diffraction operator was calculated for the amplitudes of each harmonic using the angular spectrum method [36, 37]. A Godunov-type scheme was employed for modeling the nonlinear term [38]. The absorption term was calculated in the spectral representation using an exact solution for each harmonic. Simulations were performed in water, with the physical parameters of the propagation medium in (1) chosen as follows: c0 = 1485 m/s, β = 3.5, ρ0 = 998 kg/m3, and δ = 4.33·10−6 m2/s.
B. Nonlinear Parabolic KZK Equation
The axially symmetric KZK equation [39,40 41] was used to generate a multi-parametric set of numerical solutions within a wide range of geometrical parameters, frequency, and amplitudes of axially symmetric focused ultrasound sources. Characteristics of nonlinear pressure waveforms at the focus such as peak pressures, shock amplitude, and waveform asymmetry were obtained. Corresponding intensity levels at the source necessary for achieving such distorted waveforms were calculated. Then, parameters of the boundary condition to the KZK equation for achieving specified nonlinear pressure waveforms at the focus can be reconstructed by inference from the direct simulation data [22].
The KZK equation includes a parabolic approximation of diffraction effects that is generally limited to simulation of weakly focused beams the focusing angle remaining less than 32º [42], which is typical for diagnostic applications, but not for strongly focused HIFU fields with focusing angles up to 70°. However, it has been shown in both numerical and experimental studies that certain modifications to the KZK boundary condition yield highly accurate results for simulating acoustic pressures not only in nonlinear beams generated by a planar transducer [43] but also in the focal region of strongly focused sources with F# ~ 1 [44, 45].
The KZK equation with a boundary condition representing a circular uniformly vibrating source with a parabolic phase distribution that provides focusing can be written as [46]:
| (2) |
where (z̃,r̃) are axial and radial coordinates of the parabolic model, and Δ̃⊥ = 1/r̃∂/∂r̃ (r̃∂/∂r̃). Here and below, parameters related to the parabolic approximation are marked by the tilde (~). To facilitate multi-parametric simulations, the KZK equation was rewritten in the dimensionless form [46]:
| (3) |
Here P =p̃/p̃0 is the acoustic pressure normalized to the pressure amplitude at the transducer p̃0, θ = ω0 (t−z̃/c0) is the dimensionless retarded time, σ = z̃/F̃ is the dimensionless axial coordinate normalized to the focal length F̃ of the equivalent source, R=r̃/ã is the radial coordinate normalized to the equivalent source radius ã, Δ⊥ = 1/R·∂/∂R(R∂/∂R) is the transverse Laplace operator for an axially symmetric beam, is the dimensionless nonlinear parameter, G=πf0ã2/c0F̃ is the diffraction parameter (the linear coefficient of pressure amplification with respect to the pressure amplitude on the surface of the transducer), and is the absorption parameter.
The value of the absorption coefficient when focusing in water is very small, A ≪ 1, and it affects only the fine structure of the shock fronts that are developing in the waveform. Thus, the nonlinear field generated by a focused transducer within the parabolic model (3) will depend only on two parameters: N and G [46]. The nonlinear parameter N characterizes the initial pressure magnitude p̃0 at the transducer, and the diffraction parameter G is a combination of two dimensionless parameters kã and F̃# = F̃/2ã: G=kã/4F̃#. All physical parameters of the problem can be therefore reduced to only two dimensionless parameters N and G in equation (3).
Simulations were performed for diffraction parameter G changing within the range 10 ≤G≤100 with step size ΔG = 5. For each value of G, 75 values of the nonlinear parameter within the range 0< N ≤1.5 were considered with variable step sizes: ΔN =0.01 within the interval0<N ≤0.5, where nonlinear effects increase rapidly with increasing N and ΔN = 0.04 for 0.5<N≤1.5, where changes are slower. Additional simulations with smaller steps in ΔN were done around the level of N at which the shock front was formed at the focus and changes in focusing gains are the fastest [22]. Finding numerical solutions within a wide range of values of these two parameters provided data for nonlinear distortion of focal waveforms relevant to medical ultrasound fields.
C. Parabolic Equivalent Source Model
As noted earlier, the parabolic diffraction equation is generally limited to the description of weakly focused beams [42]. However, it has been shown that with certain modification of the boundary condition, the solution of the KZK equation can be used to accurately match low output pressure measurements in the focal region of strongly focused transducers with F# ~ 1 [44, 45]. A disc-shaped source with a quadratic radial distribution of phase to provide focusing was considered as a boundary condition to the parabolic model. The amplitude and the aperture of such an equivalent flat source were varied to provide the best fit between linear beam modeling and low output measurements in the focal lobe.
In a recent publication, an exact analytical solution was obtained to relate the initial pressure, F-number, and focal length of a uniformly vibrating single source in the shape of a spherical segment to the parameters of an equivalent flat source defined by the parabolic model (2). With this solution, the corresponding linear solutions of the full diffraction and parabolic equations agree very well even in several diffraction lobes around the focus [24]. This solution is used here to interpret the results of KZK modeling in terms of the parameters of a physically realistic spherical source. The method to obtain this solution is described in detail in [23] and is briefly presented below.
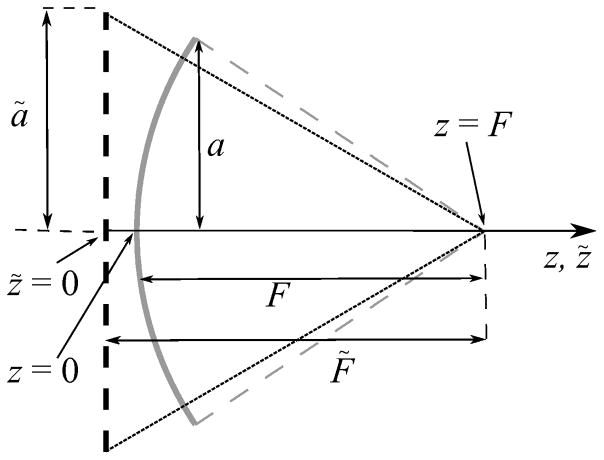
The idea of the method is to determine the location of the boundary condition plane (focal length F̃), the aperture (radius ã), and the initial pressure p̃0 of the equivalent flat source in the parabolic model (Fig. 2) at which the solutions for acoustic pressure amplitude on the axis of the linear beam coincide at the focus and in the first nulls around it for both the parabolic and full diffraction models. In the case of linear focusing, full diffraction analytic solutions for pressure amplitude distributions on the beam axis can be derived using the Rayleigh integral [23] for spherical sources:
| (4) |
and for the focused piston source in the parabolic model:
| (5) |
Fig. 2.
Side view of a spherical single element source (solid curve) with radius a and focal length F and the equivalent planar circular source (dashed curve) with a different radius ã and focal length F̃. Spherical source parameters: 1 MHz frequency, a = 5 cm, F = 9 cm, F# = 0.9. Equivalent source parameters: same frequency, ã = 5.7 cm, F̃ = 9 cm, F̃#= 0.862
Here k=ω0/c0 is the wavenumber and is the distance between the beam axis at distance z and the edge of the spherical source. The solutions (4) and (5) can be rewritten using dimensionless axial coordinate originated from the focus ζ =k(z−F)=k(z̃−F̃) (Fig. 2).
Then three unknown parameters of the equivalent parabolic source, F̃, ã, and p̃0, can be obtained from a set of three equations that equalize the pressure amplitude at the focus à (ζ = 0) = A(ζ = 0), and the location of two diffraction nulls adjacent to the focus, ζ̃1 =ζ1 and ζ̃2 =ζ2. Exact analytic solutions can be derived for this set of equations defining the initial pressure p̃0, F̃#, and dimensionless focal length kF̃ of the equivalent source [24]. When the source aperture and focal length are large compared to the ultrasound wavelength, ka ≫1 and kF ≫1, which is almost always correct for HIFU sources, the solutions can be written in a compact form as:
| (6) |
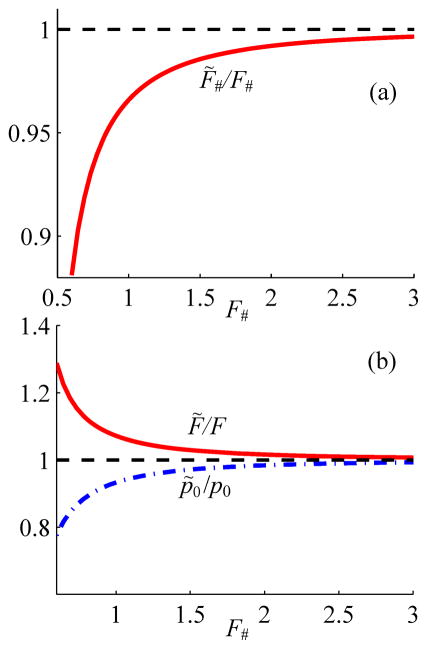
Shown in Fig. 3 are the solutions (6) for three parameters F̃#, kF̃, and p̃0 of the equivalent flat source of the parabolic model plotted as functions of the parameters of the corresponding spherical source. It is seen that modifications to all of the equivalent source parameters compared to those of the spherical source depend only on the F-number. Each parameter of the flat source from the parabolic model therefore can be easily related to the corresponding parameter of the spherical source and corresponding Rayleigh integral solution. Consequently, results of the KZK modeling can be reformulated in terms of spherically shaped single-element transducers.
Fig. 3.
Scaling curves for parameters of the planar source in the parabolic model as compared to the spherical one in the full diffraction model. Here F# = F/2a, and p0 are the F-number, focal length, and pressure amplitude of the spherical source; F̃#, F̃ and p̃0 are the corresponding parameters of the planar source in the parabolic model.
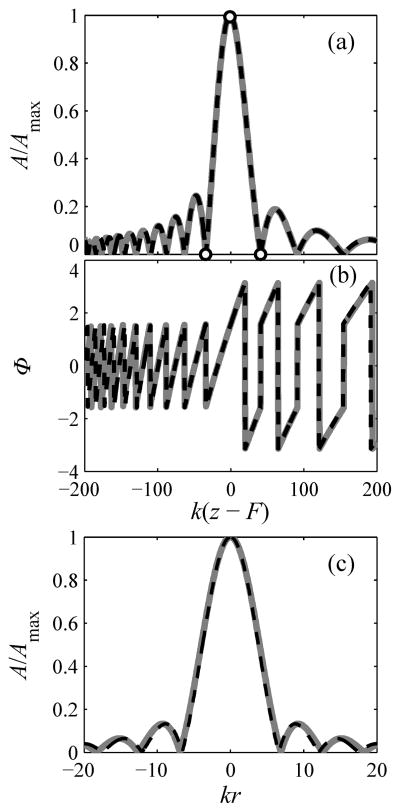
Although matching of the model solutions was only enforced at three points along the beam axis, depicted as circles in Fig. 4(a), good agreement of pressure amplitude and phase was achieved within a large region around the focus even for a strongly focused beam (Fig. 4). In this figure, a spherical 1 MHz transducer is modeled to represent one of the strongly focused sources used later in the paper for experimental validation studies (a = 5 cm, F = 9 cm, F# = 0.9) [25]. The maximum difference between the results of the parabolic and full diffraction modeling relative to the pressure amplitude at the focus max (Ã−A|/A(F)) was 0.04% along the beam axis and 3% transverse to the axis within the focal lobe; outside the focal lobe, the maximum difference was 6% [24].
Fig. 4.
Comparison of model solutions for linear diffraction on axis (a, b) and radially transverse to the beam axis (c). Pressure amplitudes are normalized to the maximum value A/Amax and the axial phase distribution Φ is plotted in (b). Solid lines represent full diffraction solutions for a spherical source; dashed lines represent the parabolic solution for a flat equivalent source. Equivalent source parameters are calculated from solutions (6) by matching three points indicated as circles in the Rayleigh solution (4) and parabolic solution (5) on the beam axis. The distributions are almost indistinguishable in the focal region of the beam including several diffraction lobes around the focus. Here k(z–F) is the dimensionless axial coordinate along the transducer axis shifted to the focal point, kr is the dimensionless radial coordinate. An example is given for a spherical 1 MHz source; a = 5 cm, F = 9 cm, F# = 0.9. Parameters of the equivalent flat source for the parabolic model are: ã = 5.7 cm, F̃ = 9.8 cm, F̃# = 0.862.
The analytical results from Eq. (6) were validated in [24] by a more general numerical approach for optimizing the selection of equivalent parameters. The idea was to vary parameters of the flat source in the parabolic model so as to provide a minimum of an integral error function between the solutions in the full diffraction and parabolic models. Here A and B are the boundaries of the focal region along the beam axes. A similar approach that relies on matching experimental results of axial beam scans in the focal region and linear parabolic simulations has been used for single-element HIFU sources [44, 45]. This approach will be also used here for determining equivalent source parameters when modeling the fields of more complex transducers such as multi-element arrays.
As shown in this section, the determination of an equivalent parabolic source permits the use of simpler diffraction modeling even for strongly focused sources. Specifically, modeling based on the linearized KZK equation can be accurately matched with the solution to the full diffraction problem based on the linearized Westervelt equation for the focal region of the beam generated by a more realistic source in a shape of a spherical segment. Because nonlinear effects are strongest in the focal region where pressure amplitudes are largest, solutions to the corresponding nonlinear equations for focal pressures obtained by scaling source amplitudes are expected to be very close as well. This result has been shown in previous studies [44, 45] and is further validated here for three representative HIFU transducers that may even lack exact axial symmetry.
D. Characteristic Levels of Nonlinear Distortion
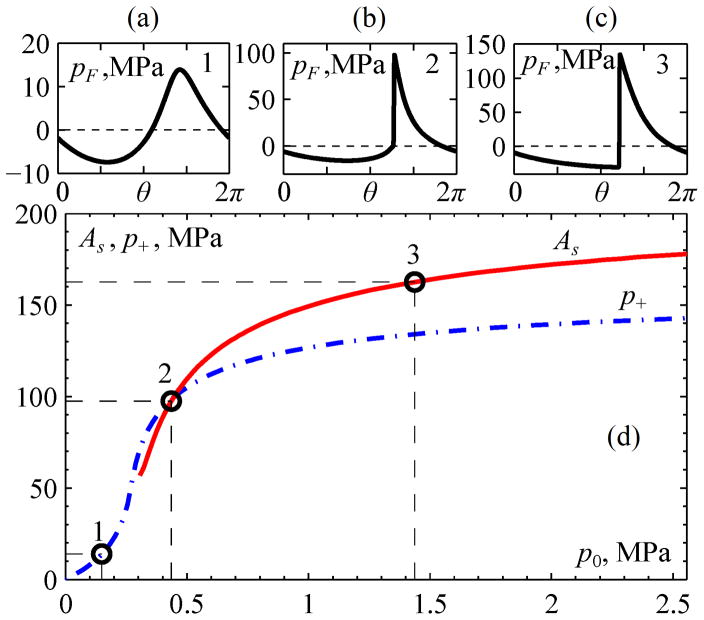
Transducer parameters that produce specified focal pressures were determined for three characteristic levels of nonlinear waveform distortion as illustrated in Fig. 5. Nonlinear simulations were performed here for the same single-element spherical source as considered in Fig. 4. The KZK equation with an equivalent boundary condition determined from Eq. (6) was solved for a range of source amplitudes. Shown in Fig. 5 are simulation results for the peak positive pressure and shock amplitude in the focal waveforms, with specific examples highlighted to illustrate each of the three characteristic levels of nonlinear distortion. The amplitude of the shock front in simulated acoustic waveforms was determined between the time points of the shock front where the time derivative of pressure decreases to a value that is 0.025 times the peak value. This method has been proposed and described in detail in previous studies [22, 47, 48]. With this definition, it has been shown that shock-wave heating predicted by the weak shock theory corresponds well to the heating calculated in direct numerical simulations [9, 10, 22].
Fig. 5.
Illustration of three characteristic levels of waveform distortion at increasing source pressures, which are proportional to the nonlinear parameter N in the KZK equation (3). The quasilinear level (1), the level of a fully developed shock front (2), and a level in the saturation regime (3) are denoted by numbered circles in the lower plot (d), with corresponding waveforms (a), (b), and (c) above. The solid curve represents shock amplitude As, while the dashed curve shows peak positive pressure p+ in the focal waveform. Plots are presented for a spherical source of 1 MHz frequency: a = 5 cm, F = 9 cm, F# = 0.9.
Level 1 for quasilinear distortion was defined from the following considerations: The initial increase of the source pressure p0 (Fig. 5) leads to steepening and asymmetric distortion of the focal waveform caused by generation of harmonics and a relative diffraction phase shift between them. A quasilinear waveform distortion is usually defined following the criterion that less than 10% of the full wave intensity is distributed over harmonics of the fundamental frequency [49]. A limiting situation at which exactly 10% of the focal intensity is transferred to higher harmonics will be termed here as quasilinear distortion (depicted as level 1 in Fig. 5 (a) at p0 = 0.15 MPa).
Level 2 distortion is characterized by the presence of a fully developed shock, which occurs as the source amplitude p0 is increased beyond quasilinear conditions. The shock first appears near the positive peak of the waveform and, with further increase of p0, it grows in amplitude so that the bottom edge of the shock moves toward a level of zero pressure. The level of distortion where the shock amplitude As normalized to the source pressure p0 reaches a maximum, (As/p0) = max, will be termed as the level of fully developed shocks (depicted as level 2 in Fig. 5). This definition was introduced in an earlier publication to serve as a metric for the characteristic shock amplitude generated by a focused transducer [22]. Such a definition is logical as it corresponds to the maximum focusing gain for the shock amplitude relative to the source pressure. It can be also shown that at this regime a relative change in the source pressure Δp0/p0 results in the maximum relative change of the shock amplitude ΔAs/As and ΔAs/As = Δp0/p0. Interestingly, for this level of distortion, the bottom of the shock is located at the zero pressure level and the shock amplitude is equal to the peak positive pressure (as depicted in Fig. 5 (b)).
After the source output increases beyond the level of a fully developed shock, the shock amplitude still continues to grow (Fig. 5). However its growth rate slows down because of strong energy attenuation at the shocks that start to form prefocally. As depicted in Fig. 5, we define level 3 distortion to be characterized by a degree of nonlinear saturation at which the slope of the curve As(p0) decreases to 10% of the maximal value for the condition of fully developed shocks: [dAs/dp0]level3 = 0.1·[dAs/dp0]level2. In other words, a relative change in the shock amplitude ΔAs/As for level 3 distortion is only 10% of the corresponding change of the source pressure Δp0/p0, indicating indeed a significant amount of saturation.
E. Correlation of transducer parameters and focal waveform characteristics
Results of the two-parameter KZK-based simulations (Subsection B) were used to determine relationships between the parameters of an equivalent flat source from the parabolic model (its geometry and output) and focal waveforms with particular characteristics and levels of nonlinear distortion (peak pressures, p+, p−, and shock amplitude As).
While numerical solutions of the KZK equation (3) were technically obtained for various values of dimensionless parameters N and G, it can be shown that these solutions can be represented in terms of the following three quantities: a characteristic internal pressure of the propagation medium, , the source radius measured in ultrasound wavelengths, kã= 2π ã/λ, and its F-number, F̃#. As an example, the solution is described below for determining the amplitude of a fully developed shock at the focus, Ãs as a function of parameters of the flat source in the parabolic model.
Each set of KZK-based simulations with a certain diffraction parameter G was analyzed for increasing values of the nonlinear parameter N, which is proportional to the source pressure p̃0. A value N*=N*(G) was determined for achieving level 2 distortion with a fully developed shock at the focus, and the corresponding dimensionless value of the shock amplitude Ãs/p̃0 for this pair of values G and N* (G) was obtained. Such calculations of Ãs/p̃0 were repeated for a set of values of the parameter G to obtain the corresponding tabulated function ψ (G):
| (7) |
According to the definition of the parameters and G=kã2/4F̃=kã/4F̃#, the solution (7) for N=N* can be rewritten in terms of the quantities , kã, and F̃#:
| (8) |
The condition N=N* (G) yields a solution for the initial pressure amplitude p̃0 at which a fully developed shock is formed at the focus expressed in terms of the same quantities:
| (9) |
As mentioned in Subsection C, there is a single-valued correspondence between the parameters of a flat source of the parabolic model (kã, F̃#, p̃0) and a spherical source (ka, F#, p0) that provides the same pressure field in the focal region in the case of linear propagation (see (6) and Fig. 4). It is assumed that in the case of nonlinear propagation the predicted focal waveforms will be very similar as well. Indeed, since nonlinear effects are amplitude dependent, they will be strongest in the high pressure focal region and accumulate the same way in the two models as pressure levels are matched (Fig. 4(a)). In particular, the developed shock amplitude in the solutions of the Westervelt and KZK equations will be equal: As=Ãs. Therefore, the result (8) provides the shock amplitude As at the focus of a single-element spherical source in terms of its geometrical parameters ka and F#. The corresponding source pressure p0 can be determined from the solution (9) and the relations (6). A similar procedure can be employed when determining other parameters of the focal waveforms, namely the positive and negative peak pressures, and compression and rarefaction phase durations.
Results below are presented in terms of the parameters ka, F#, and p0 for single-element spherical sources for all three considered levels of waveform distortion as introduced in Subsection D: quasilinear (1), fully developed shocks (2), and saturation (3).
F. Experimental Methods
Three representative strongly focused HIFU sources were considered in this study to validate the proposed approach. First, a single-element piezocomposite spherical transducer of 1 MHz frequency (Imasonic, Voray sur I’Ognon, France) designed for histotripsy applications [25] was used in the validation studies. This transducer geometry (a = 5 cm radius, F = 9 cm focal length, F# = 0.9) was used earlier in the current paper as a benchmark example of a strongly focused single-element source. The transducer was driven with a custom class D amplifier with an appropriate matching network [50].
Second, a 7-element 1 MHz source designed for boiling histotripsy applications at the University of Washington was considered. The source was composed of seven circular elements of 5-cm diameter arranged in a confocal configuration to form a source with an overall aperture a = 14.7 cm. The geometric focal length of the source was F = 14 cm (F# = 0.95). The focusing was achieved for each element using flat piezoceramic discs bonded to elliptical plastic lenses in a single housing [51]. All transducer elements were electrically driven in-phase using a class D amplifier similar to that described for the single-element transducer.
A third transducer characterized was a 256-element HIFU array of a Sonalleve V1 3.0T MRgHIFU clinical system (Philips Healthcare, Vantaa, Finland) [27]. The piezocomposite, spherically curved transducer with a geometric aperture a = 63.9 mm and focal length F = 120 mm operated at 1.2 MHz frequency. In practice, the focal length of this transducer is slightly altered from its geometric value due to refraction at the interface between an oil bath surrounding the transducer and an adjacent water bath in which measurements were acquired. The output was controlled by the Sonalleve system to drive all elements in-phase to produce natural focusing.
For each transducer, low-output (linear) measurements were performed for setting a boundary condition to the full diffraction nonlinear Westervelt model and determining parameters of two equivalent single-element sources: a spherically shaped transducer for the Westervelt model and a flat circular source for the KZK model. For the two array transducers, holography measurements were performed over a planar region between the source and the focus, perpendicular to transducer axis using a capsule hydrophone (HGL-0200, Onda Corp., Sunnyvale, CA) [26, 27]. The measured hologram was used to define the field in the initial plane of the 3D full diffraction modeling as described in Subsection A. Axial beam scans through the focus were performed for both the array transducers and the single-element spherical transducer. The focal length, aperture, and amplitude of the corresponding equivalent spherical sources were determined by matching the experimental scans and the exact Rayleigh integral solutions (4) over the -6 dB region of the focal beam lobes. Linear scans were also done in the focal plane in two perpendicular directions and compared with modeling.
High output measurements of the pressure waveforms were performed in a degassed water bath using a fiber optic probe hydrophone (Model FOPH 2000, RP Acoustics, Leutenbach, Germany). Measurements were acquired at the focus over a range of power outputs up to the pressure level where measurements could no longer be acquired due to cavitation or probe tip failure. Raw waveforms were deconvolved from the manufacturer’s impulse response for the hydrophone to obtain true pressure waveforms [52]. These results were compared with the modeling results of both the KZK and the Westervelt equations.
III. Results
A. Level 1 Distortion: Quasilinear Focal Waveforms
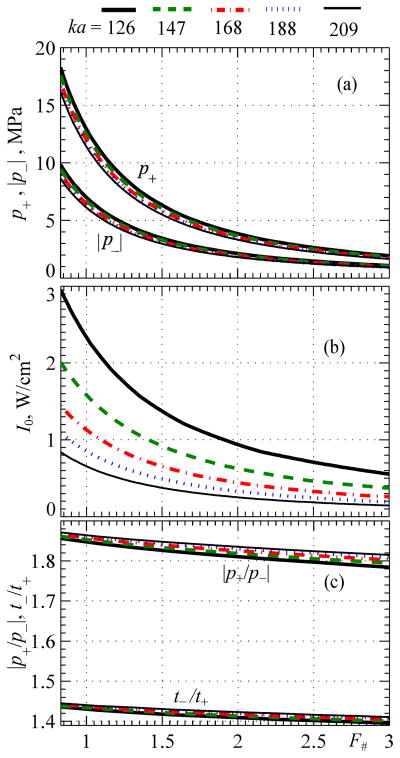
Results are shown in Fig. 6 for level 1 distortion with quasilinear focal waveforms. Peak pressures p+ and p− achievable at this low level of nonlinear effects are presented for spherical transducers with different F-numbers and different dimensionless radii ka = 126, 147, 168, 188, 209. Such values of ka correspond, for example, to transducers of 1 MHz frequency and radii of a = 3, 3.5, 4, 4.5, 5 cm. The largest aperture value of ka = 209 corresponds to the 1 MHz spherical transducer of 5 cm radius and 9 cm focal length considered in this paper as a benchmark example of a strongly focused HIFU source.
Fig. 6.
Parameters of quasilinear focal waveforms and corresponding output conditions for spherical sources as a function of their F-number for different dimensionless source radii ka = 126, 147, 168, 188, 209. Results are presented for the peak positive and negative pressures, intensity at the source I0, and parameters of waveform asymmetry in terms of the ratio of peak pressures |p+/p−| and the ratio of durations of the rarefaction and compression phases t−/t+
As shown in Fig. 6a, five curves obtained for peak pressures at the focus for different source apertures ka are very close to each other. Therefore, peak pressures in the focal waveform with quasi-linear distortion are indeed determined mostly by the F-number of the transducer. For a given F-number, the peak pressures only slightly depend on the frequency of the transducer and its aperture (parameter ka), being generally a little higher for larger values of ka, i.e., for higher frequencies or larger apertures.
The output intensity at the source at which the focal waveform reaches the defined level of quasilinear distortion depends on both values of ka and F-number (Fig. 6b). With the same F-number, higher intensity is required for transducers with smaller apertures ka to provide the same pressure level at the focus. For transducers of the same aperture but different F-numbers, lower intensity I0 is required for less focused transducers.
Two parameters that describe the waveform asymmetry as a function of the source F-number for different values of ka are shown in Fig. 6c: the ratio of peak pressures |p+/p−| and the ratio of durations of the rarefaction and compression phases in the waveform t−/t+. It is seen that focal waveforms are slightly asymmetric at this level of quasilinear distortion, and the asymmetry parameters do not change much with F# (Fig. 6c). For the same aperture, for example ka = 209, the asymmetry in peak pressures |p+/p−| changes from 1.82 for F# = 3 to 1.85 for F# = 0.75. Small asymmetry and variation in durations of the negative and positive pressure phases are also observed. The ratio t−/t+ changes from 1.44 for F# = 0.75 to 1.4 for F# = 3 for the largest aperture of ka = 209.
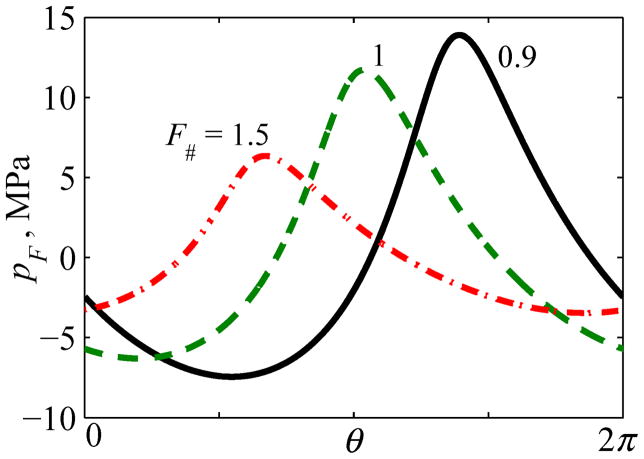
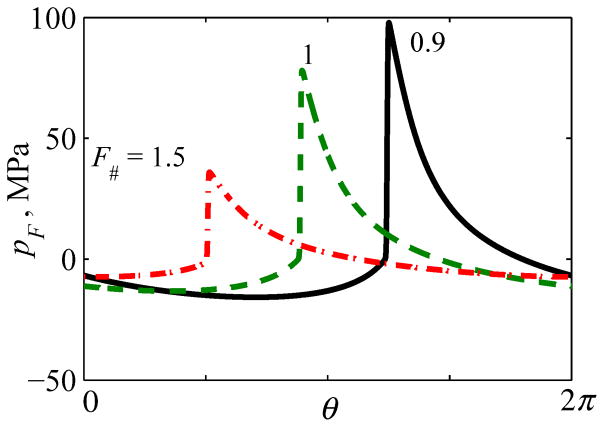
Typical quasilinear focal waveforms are presented in Fig. 7 for spherically shaped sources with F# =0.9, 1, and 1.5. For example, peak positive pressure of 12 MPa and peak negative pressure of 7 MPa can be achieved at the focus with quasi-linear distortion of the waveform pressures for transducers with F# = 1.
Fig. 7.
One cycle of quasilinear focal waveforms pF (θ) for different transducer focusing angles characterized by F-number: F# = 0.9, 1, 1.5. Here θ=2πf0t is the dimensionless time. A relative time shift between the waveforms is introduced for better visibility
B. Level 2 Distortion: Fully Developed Shocks
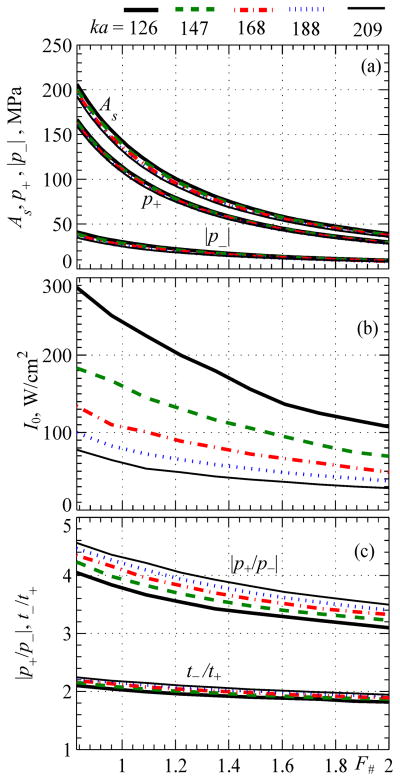
This section presents results for the level of distortion that is most interesting for practical implementation in shockwave-based medical technologies. For a single-element spherical transducer, Fig. 8 shows the dependencies of the shock amplitude As and the peak positive and negative pressures, p+ and p−, at the focus as a function of F-number for different dimensionless radii ka = 126, 147, 168, 188, 209.
Fig. 8.
Parameters of focal waveforms with fully developed shocks and corresponding output conditions for spherical sources as a function of their F-number for different dimensionless source radii ka = 126, 147, 168, 188, 209. Results are presented for the peak positive and negative pressures, intensity at the source I0, and parameters of waveform asymmetry in terms of the ratio of peak pressures |p+/p−| and the ratio of durations of the rarefaction and compression phases t−/t+.
As shown in Fig. 8a, five curves obtained for focal peak pressures and shock amplitudes for different source apertures ka are virtually indistinguishable. Therefore, F-number is indeed the main parameter that determines the pressure levels in the waveform with a fully developed shock at the focus. Similar to the results shown in Fig. 5, it is also seen that, the peak positive pressure in such a waveform is equal to the shock amplitude, As≈p+, for all values of the source F-number. The shock amplitude and both peak pressures decrease with F-number – i.e., they have higher values for more strongly focused sources (lower F-numbers).
The output intensity at the source at which a fully developed shock is formed at the focus is shown in Fig. 8b. It is seen that the source intensity I0 depends on both values of ka and F#. With the same F-number, higher intensity is required for transducers with smaller apertures to provide the same pressure levels in the focus required for shock formation. As expected, for transducers of the same aperture but different F-numbers, a lower intensity I0 is needed for less focused transducers where nonlinear effects accumulate over longer distances within the focal lobe (Fig. 1(b, d)). However, even for strongly focused sources, realistic intensities at the source of 10 – 30 W/cm2 are sufficient to achieve fully developed shocks in water.
Note that according to the results shown in Fig. 8(a) the amplitude of fully developed shocks and corresponding peak pressures at the focus do not depend on the frequency of the transducer. For the same transducer dimensions, nonlinear effects are stronger for higher operating frequencies f0 but accumulate over shorter distances in the focal lobe of the beam. Overall, the change in frequency does not change characteristic pressure levels at the focus at which shock fronts are fully developed. However, lower levels of the source output are required (Fig. 8b) to reach shock formation when operating at higher frequencies (larger ka, k=2πf0/c0) because the focusing gain of the transducer becomes larger. The initial intensity level of the source to achieve a shock of a certain amplitude thus can be controlled by either changing the aperture or the frequency of the source.
For certain applications aimed at utilizing bioeffects induced by shock fronts while avoiding cavitation, minimizing peak negative pressure for a given shock amplitude or peak positive pressure would be beneficial. For cavitation-based therapies, maximizing peak negative pressure in the focal waveform is desirable. The relative duration of the negative pressure phase within one cycle of the waveform is another characteristics that may be useful for evaluating cavitation effects [53]. It is seen that asymmetry in peak pressures |p+/p−| is much stronger for strongly distorted waveforms with fully developed shocks as compared to quasilinear waveforms. For example, peak positive pressure is about six times higher than peak negative pressure for sources with F# = 1. For the same aperture, for example, ka = 209, asymmetry in peak pressures is higher for more focused sources, changing from 4.8 for F# = 3 to 6.8 for F# = 0.75. For the same F-number, asymmetry |p+/p−| is slightly higher for sources with larger apertures. The relative asymmetry in durations of the negative and positive pressure phases t−/t+ is smaller than the comparable ratio for peak pressure values. The ratio t−/t+ is higher for more focused sources, changing from t−/t+ = 2.6 for F# = 0.75 to 2.1 for F# = 3 for the largest aperture of ka = 209 considered here.
The properties of the focal pressure fields discussed above are illustrated in more detail in Fig. 9 where nonlinear waveforms with fully developed shocks at the focus are presented for spherically shaped sources with F# =0.9, 1, and 1.5. The following waveform details are readily apparent: the shock amplitude As is indeed larger for strongly focused sources (or small values of F-number); the lower boundary of each shock front is close to zero; and the waveforms are more asymmetric in terms of the ratios |p+/p−| and t−/t+ in the more focused beam with the F# = 0.9. A shock amplitude of about 80 MPa and a peak negative pressure of 14 MPa correspond to the representative case of F# = 1 typical for transducers and focal waveforms used in boiling histotripsy [15, 16].
Fig. 9.
One cycle of focal waveforms pF (θ) with fully developed shock fronts for different transducer focusing angles characterized by F-number: F# = 0.9, 1, 1.5. Here θ =2πf0t is the dimensionless time. A relative time shift between the waveforms is introduced for better visibility.
C. Level 3 Distortion: Nonlinear Saturation
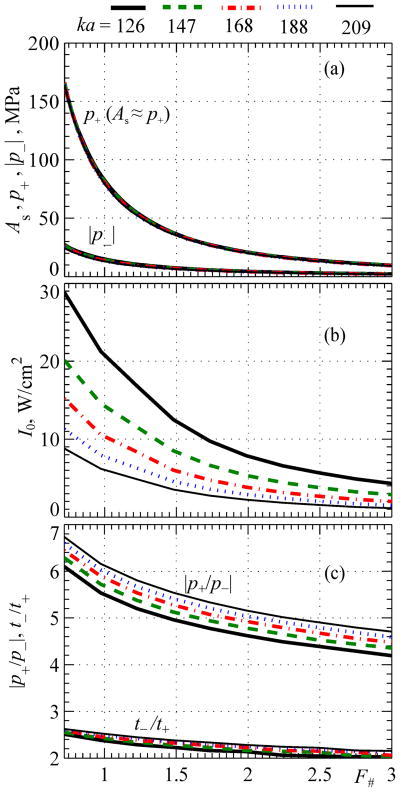
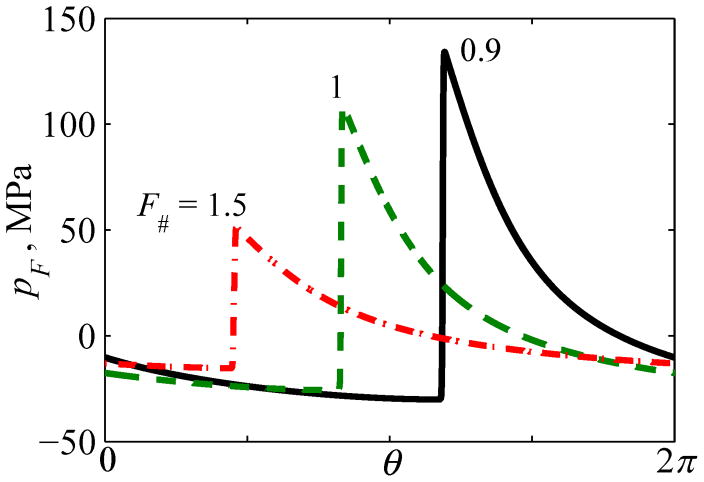
Parameters of the focal waveform that can be reached with focusing at very high source outputs (level 3 in Fig. 5) are depicted in Fig. 10. Focal waveforms for representative F# = 0.9, 1, 1.5 are shown in Fig. 11. Qualitatively, the effects of the F-number and dimensionless source aperture ka on the focal waveform parameters are similar to those observed for distortion levels characterized by quasilinear waveforms and fully developed shocks. However, certain specific details should be noted.
Fig. 10.
Parameters of focal waveforms at the defined level of nonlinear saturation and corresponding output conditions for spherical sources as a function of their F-number for different dimensionless source radii ka = 126, 147, 168, 188, 209. Results are presented for the peak positive and negative pressures, intensity at the source I0, and parameters of waveform asymmetry in terms of the ratio of peak pressures |p+/p−| and the ratio of durations of the rarefaction and compression phases t−/t+.
Fig. 11.
One cycle of characteristic focal waveforms pF (θ) at the saturated level of distortion for different transducer focusing angles characterized by F-number: F# = 0.9, 1, 1.5. Here θ =2πf0t is the dimensionless time. A relative time shift between the waveforms is introduced for better visibility.
For strongly focused sources with F# =0.84, the peak positive pressure p+ saturates at 150 MPa; for a weakly focused source with F# = 2 the corresponding saturation pressure p+ is only 29 MPa. Saturation levels of peak negative pressure p− are 40 MPa for F# = 0.84 and only 9 MPa for F# = 2. The shock amplitude is higher than the peak positive pressure because the lower edge of the shock has a negative value and almost coincides with the peak negative pressure (Fig. 11) and therefore As = p+ +|p−|(Fig. 10a).
A high source intensity is required (Fig. 10(b)) to achieve saturation regimes for strongly focused sources (60–250 W/cm2 for F# = 1 and ka = 209–126). The saturation regime, however, can be reached when using large apertures, high frequencies, or weak focusing. The waveforms become more symmetric (Fig. 10(c)) with a less-rounded shape of the negative phase (Fig. 11) in comparison to the waveforms with fully developed shocks (Fig. 9). The duration of the rarefaction phase is about twice longer than the compression phase and only weakly depends on the transducer F-number.
D. Experimental Validation of the Simulation Results
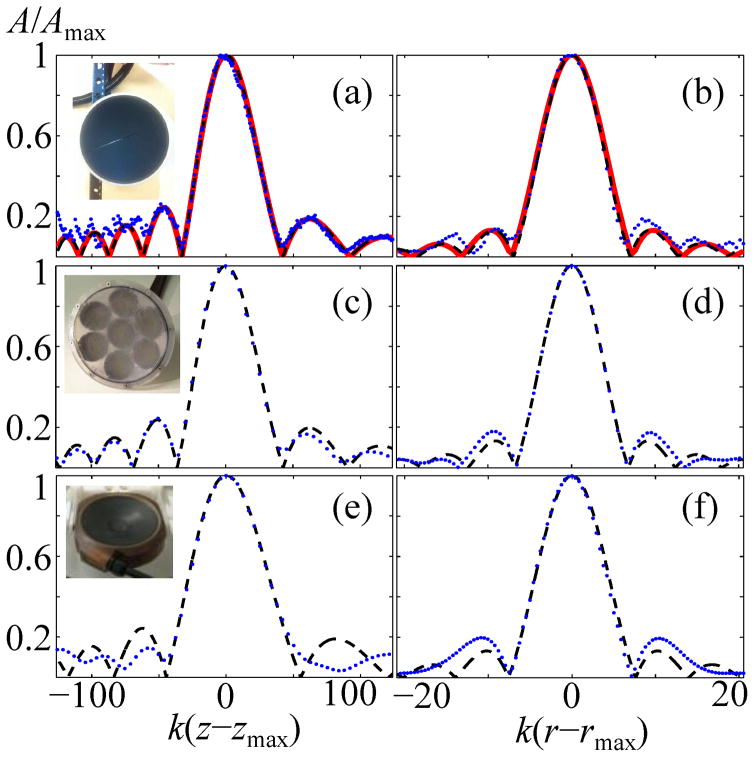
Results presented in the previous subsections correlate acoustic pressures in nonlinear focal waveforms with geometric parameters and output intensities of single-element spherically shaped transducers. It has been also noted that these data can be used for transducers with more complicated geometries such as HIFU arrays. In this case, parameters of such single-element sources should be determined by matching the Rayleigh integral solution for the source (4) with experimental measurements of the on-axis pressures generated by the real transducer at a low output level. Experimental validation of the accuracy of the proposed approaches and modeling results is presented here for three different types of HIFU transducers (Fig. 12).
Fig. 12.
Comparison of the experimental data (dots) with results from the parabolic (dashed line) and full-diffraction (solid line) models. Frames at left show normalized pressure amplitudes A/Amax along the axis of a linear beam, while frames at right show pressures along a radial coordinate in the focal plane. Here (zmax,rmax) are the axial and radial coordinates where the maximum pressure was measured. Three representative HIFU sources were characterized: (a) and (b) - 1 MHz single-element spherical transducer with a = 5 cm, F = 9 cm (F# = 0.9, ka = 209); (c) and (d)–7 - element 1 MHz array (equivalent spherical source: a = 6.4 cm, F = 13.2 cm, F# = 1.03, ka = 269); (e) and (f)–256-element 1.2 MHz array (equivalent spherical source: a = 6 cm, F = 11 cm, F# = 0.922, ka = 301).
1) Single-element source
Experimental linear pressure scans showed that this transducer corresponded very well to the model of a spherical uniformly vibrating source. Indeed, the Rayleigh solution (4) for the axial (Fig 12a) pressure distribution normalized to the maximum value A/Amax (solid curve) shows good agreement with corresponding low-amplitude pressure measurements in the focal and two adjacent diffraction lobes of the beam (dotted curve). While matching was done based on the axial simulations and measurements, the Rayleigh integral solution in the focal plane also matched the focal lobe in experimental pressure scans very well (Fig. 12b).
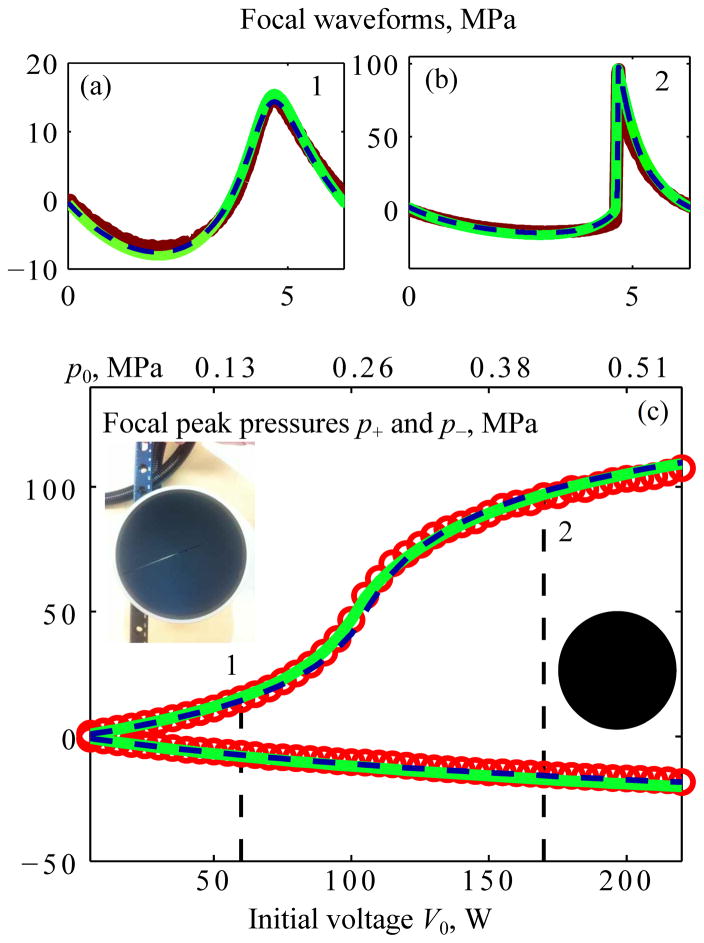
High-output measurements were performed at the focus for nominal electric voltage applied from the amplifier ranging from V0 = 5 V to 220 V. For setting a boundary condition to the nonlinear full-diffraction modeling using the Westervelt equation (1), this voltage range corresponded to initial pressures at the spherical source from p0 = 0.013 MPa to 0.56 MPa. The parameters of the equivalent flat source of the parabolic KZK equation (2) were determined from the equations (6) as ã = 5.7 cm; F̃ = 9.8 cm; F̃# = 0.862, kã = 239, p̃0= 0.917p0. These parameters corresponded to the focusing gain G=kã/4F̃#= 70 and source output range 0 < N < 0.33.
Simulation results obtained using both the Westervelt and KZK models are compared with experimental data in Fig. 13. Focal waveforms modeled and measured for quasilinear conditions (level 1) and conditions with fully developed shocks (level 2) are presented in the top portion of the figure. Experimentally, it was not possible to reach level 3 saturation conditions, so this data is not presented. Shown in the bottom part (c) of Fig. 13 are the peak positive p+ and peak negative p− pressures in the focal waveforms simulated and measured at increasing voltages V0 applied to the transducer. Output levels that correspond to waveform distortion at levels 1 and 2 are marked as vertical dashed lines. The scale of initial pressure p0 in the Westervelt equation is also given at the top of the plot; a photo and a sketch of the transducer are also presented. For focal waveforms, results of the KZK simulations, Westervelt simulations, and measurements show very good agreement. All three curves for the peak pressures p+ and p− obtained using parabolic KZK-based modeling (dashed line), Westervelt full diffraction modeling (solid line), and measurement results at 44 experimental output points (circles) also agree very well. The discrepancy between the results of the KZK modeling and experiment <|pKZK−pexp|/pexp> averaged over the output voltage range (Fig. 13(c)) was 4% for the peak positive pressure and 5% for the peak negative pressure. These results confirm that the KZK parabolic approximation with an equivalent source boundary condition can be applied successfully to predict nonlinear pressure fields at the focus of a strongly focused spherical transducer over a wide range of output levels.
Fig. 13.
Comparison of results for the nonlinear pressure field at the focus of a single-element spherical transducer of 1 MHz frequency, a = 5 cm radius; F = 9 cm focal length (F# = 0.9, ka = 209) [25]. Measurement data (bold curves for the waveforms and circles for peak pressures) and results from KZK (dashed curves) and Westervelt (solid curves) models are shown for focal waveforms pF(θ) (a), (b) and for focal peak pressures as a function of the voltage V0 applied to the transducer surface (c). Vertical dashed lines mark quasilinear (1) and developed shock (2) levels of distortion; corresponding waveforms, (a) and (b), are shown above. A photo and front view sketch of the transducer are also included in the figure.
2) 7-element transducer
A boundary condition to the Westervelt model for the 7-element array (Fig. 12c) was set using low-output holography measurements [26, 34]. Parameters of the equivalent single-element spherical source were determined by minimizing the error function inside the main diffraction lobe on the axis of the linear beam and are given in the caption of Fig. 14. Parameters of the equivalent parabolic source were calculated from Eq. (6) as: ã = 7.1 cm; F̃ = 14.1 cm; F̃#= 0.994, kã = 297, p̃0= 0.917p0. Similar to the results obtained for the single-element transducer, linear pressure amplitudes measured and simulated with the parabolic model in the focal plane of the beam also agree very well in the main diffraction lobe (Fig. 12d).
Fig. 14.
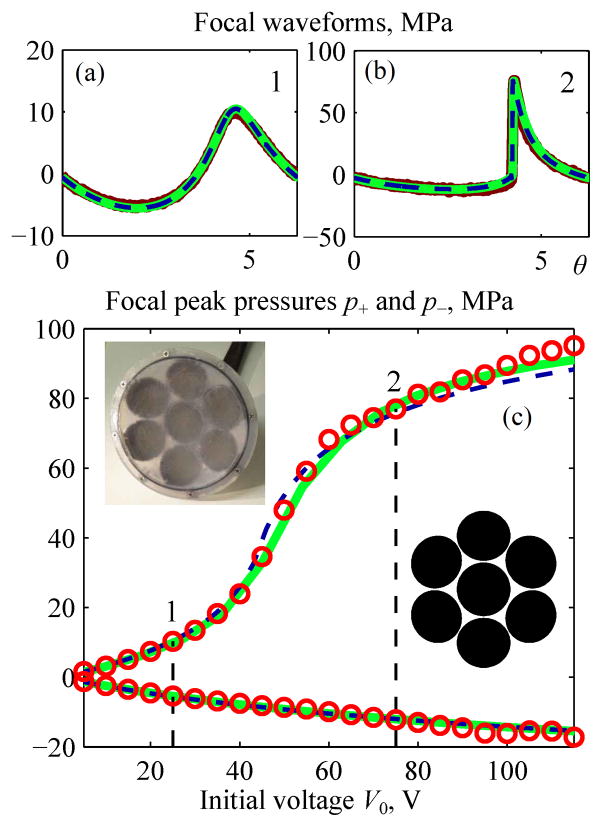
Comparison of results for the nonlinear pressure field at the focus of a 1 MHz 7-element array [26]. Measurement data (bold curves for the waveforms and circles for peak pressures) and results from KZK (dashed curves) and Westervelt (solid curves) models are shown for focal waveforms pF(θ) (a), (b) and for focal peak pressures as a function of the voltage V0 applied to the transducer surface (c). Vertical dashed lines mark quasilinear (1) and developed shock (2) levels of distortion; corresponding waveforms (a) and (b) are shown above. Parameters of an equivalent single-element spherical source were determined as a = 6.4 cm, F = 13.2 cm, F# = 1.03, ka = 269.
The parameters of the parabolic source corresponded to the focusing gain G = 75 and source output range 0 < N < 0.4 for high output measurements performed at the focus for nominal amplifier electric voltages ranging from V0 = 0 V to 120 V. Measured and simulated peak pressures at the focus at increasing source output levels are presented in Fig. 14(c) and agree very well. Focal waveforms (a) and (b) measured and simulated with two models are presented for the conditions of quasi-linear focusing (level 1) and fully developed shock fronts (level 2) also agree. It was not possible to measure a focal waveform for the saturation regime because cavitation occurred at the tip of the FOPH hydrophone.
The results presented in Fig. 14(c) indicate that the axially symmetric nonlinear parabolic model is capable of predicting focal pressures in nonlinear waveforms at the focus even in the case of a 7-element array with large elements in a geometry that is approximately, but not perfectly, axisymmetric.
Here, the difference between the results of the KZK modeling and experiment <|pKZK−pexp|/pexp> averaged over the output voltage range was 4% for peak positive pressure and 6% for the peak negative pressure.
3) 256-element array
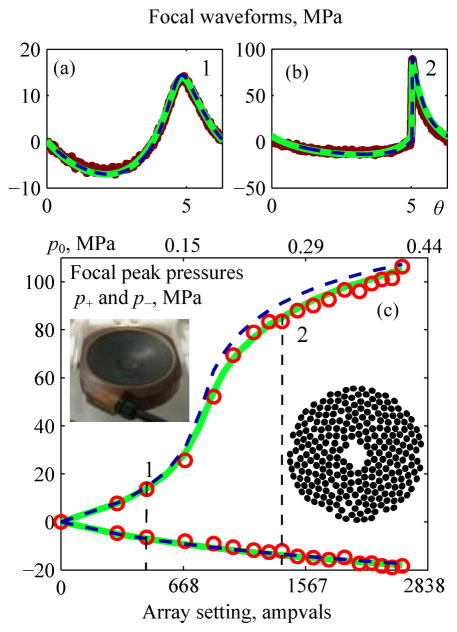
Shown in Fig. 15 are results comparing 3D Westervelt-based modeling, axially symmetric KZK-based modeling, and measurements for the pressure field at the focus of a 256-element clinical HIFU array [27]. Focal waveforms (a) and (b) that correspond to level 1 quasilinear distortion and level 2 distortion with fully developed shock fronts are presented along with peak focal pressures at increasing array outputs (c). Model boundary conditions were set with an approach analogous to that used for the 7-element array. Parameters of the equivalent single-element spherical source are given in the figure caption; the equivalent parabolic model source parameters were determined as: ã = 6.8 cm; F̃ = 12 cm; F̃# = 0.884, kã = 341, p̃0 = 0.678p0. Again, good agreement between modeling and measurement results is demonstrated. The difference between the results of the KZK modeling and experiment <|pKZK−pexp|/pexp> averaged over the output voltage range was 8% for peak positive pressure and 7% for the peak negative pressure.
Fig. 15.
Comparison of results for the nonlinear pressure field at the focus of a 1.2 MHz 256-element clinical array [27]. Measurement data (bold curves for the waveforms and circles for peak pressures) and results from KZK (dashed curves) and Westervelt (solid curves) models are shown for focal waveforms pF(θ) (a), (b) and for focal peak pressures as a function of the voltage V0 applied to the transducer surface (c). Vertical dashed lines mark quasilinear (1) and developed shock (2) levels of distortion; corresponding waveforms (a) and (b) are shown above. Parameters of an equivalent single-element spherical source were determined as a = 6 cm, F = 11 cm, F# = 0.922, ka = 301.
IV. Discussion and Conclusions
In this study, the inverse problem of choosing parameters of a focused transducer that provides a desired nonlinear pressure field in the focal region is solved. Specifically, geometric parameters of spherically shaped transducers and their power outputs are determined to achieve a desired level of nonlinear waveform distortion with specified pressure levels at the focus in water.
The main results are summarized in Figs. 6, 8, and 10 for three characteristic levels of nonlinear waveform distortion: level 1 for quasilinear waveforms (Fig. 6), level 2 for fully developed shocks (Fig. 8), and level 3 for saturated waveforms (Fig. 10). Typical values for transducer F-numbers and focal pressure parameters shown in those figures are listed in Table 1.
TABLE I.
Parameters of the focal waveform at different levels of nonlinear distortion
| F# | 0.75 | 1 | 1.25 | 1.5 | 1.75 | 2 | |
|---|---|---|---|---|---|---|---|
| Level 1: Quasi-linear | p+,, MPa | 21.4 | 12.1 | 8.1 | 5.8 | 4.5 | 3.6 |
| |p−|, MPa | 11.5 | 6.5 | 4.4 | 3.2 | 2.5 | 2.0 | |
|
| |||||||
| Level 2: Developed shocks | p+, As, MPa | 150.2 | 80.5 | 51.4 | 35.8 | 26.4 | 20.4 |
| |p−|, MPa | 23.7 | 13.8 | 9.4 | 6.8 | 5.2 | 4.2 | |
|
| |||||||
| Level 3: Saturation | As, MPa | 248.3 | 136.5 | 89.2 | 63.4 | 47.6 | 37.2 |
| p+, MPa | 203.9 | 110.5 | 71.1 | 50.0 | 37.2 | 28.9 | |
| |p−|, MPa | 46.7 | 27.3 | 19.0 | 14.0 | 10.9 | 8.7 | |
The inverse problem of finding appropriate transducer parameters was solved here by performing a sensitivity analysis of nonlinear acoustic field characteristics at the focus. The axially symmetric parabolic KZK equation was used in multi-parametric simulations instead of 3D full-diffraction modeling by the Westervelt equation, which is much more time consuming. An equivalent flat source model was employed as a boundary condition to the KZK equation to mimic focal fields of realistic, strongly focused sources. The accuracy of the approach was validated by comparing parabolic simulation results with measurements and full-diffraction simulations performed for representative strongly focused sources over a wide range of output levels (Figs. 13–15).
It was shown that while both the Westervelt and KZK equations rely on a large number of parameters to describe the transducer and the propagation medium, the solution is governed by only three independent parameters, namely the F-number, the dimensionless aperture ka, and the internal pressure of the medium , as shown in Eqs. (8) and (9). This can be confirmed as a general property of both the Westervelt and the KZK equations. Indeed, if acoustic pressure p̃ in the KZK Eq. (2) is normalized to the characteristic internal pressure of the propagation medium P=p̃/p*, and other variables are normalized to the same characteristic values used in Eq. (3), then, in the absence of dissipation, the KZK Eq. (2) can be rewritten as:
| (10) |
Equation (10) contains two dimensionless parameters, F# and ka. In addition, the internal pressure of the medium is used as the third parameter to obtain the dimension acoustic pressure p̃ =P·p*. This explains why the solutions (8) and (9) were represented in terms of these three parameters.
In some sense, the phenomenon of nonlinear focusing appears to be even simpler. The results of this study showed that focal pressures corresponding to particular levels of nonlinear waveform distortion in water are mostly determined by only two parameters, the internal pressure in water and the transducer F-number. In strongly focused fields, higher focal pressures are required for nonlinear effects to occur and shock fronts of higher amplitudes to develop. The importance of these two parameters has been revealed in the earlier analytical and numerical studies, where saturation levels of acoustic pressure at the focus were represented as functions of the focusing angle and internal pressure of the medium [54, 55].
An important result shown in this study is that pressure levels at the focus corresponding to a given level of nonlinear distortion are virtually independent of the operational frequency of the source and its aperture in the form of the parameter ka. For example, the amplitude of a fully developed shock at the focus of a source with F# = 1 in water will be the same As = 80.5 MPa independent of the source frequency (Level 1 in Table 1). It is interesting that transducers of many existing HIFU systems are capable of producing shocks with such amplitudes. However, for sources with the same dimensions, a lower source intensity is required for shock formation at higher operational frequencies.
Beyond conditions for a fully developed shock at the focus, acoustic saturation begins (level 3 in Table 1). Increases of the source pressure have reduced efficiency in increasing peak pressures and the shock amplitude at the focus. For example, for a spherically shaped source of F# = 1, the characteristic saturation level is reached after about a threefold increase in source pressure from the condition of a fully developed shock (As = p+ =80.5 MPa, p− = 13.8 MPa). This increased output level yields only a 70% increase in shock amplitude (As = 136.5 MPa), a 37% increase of the peak positive pressure (p+= 110.5 MPa), and a 98% increase of the peak negative pressure (p−= 27.3 MPa) (Fig. 10). Experimentally it was not possible to measure saturated waveforms for transducers considered in this study due to technical limitations on the source output and the generation of cavitation near the hydrophone.
For practical implementation, a natural question is what could be a metric for the measurements at the focus to decide whether the shock is fully developed or saturation occurs. The corresponding condition is not defined by the shock amplitude As per se because As depends also on the source output and F-number. However, the shape of the focal waveform is different for a fully developed shock and a saturated one. As shown here, the shocks can be considered as fully developed when the bottom of the shock is located at the zero pressure level. If the bottom of the shock is above zero pressure, the shock is not fully developed yet, and if it is below zero pressure, saturation starts to occur. When the bottom of the shock coincides with or is very close to the peak negative pressure, then the wave can be considered to represent strong saturation. Therefore, the peculiarities of the waveform distortion may serve as a convenient metric in measurements [22].
For cavitation-based applications, maximizing peak negative pressures is desired. To achieve high negative pressures, shock formation and saturation effects should be limited to occur only at relatively high focal pressures. For this purpose, more strongly focused transducers should be used (Fig. 6). For example, the peak negative pressure for a level 1 quasilinear waveform is 11.5 MPa for sources with F# = 0.75 and only 3.2 MPa for sources with F# = 1.5 (Fig. 6).
In addition, cavitation can be enhanced by elongating the rarefaction part of the waveform. In the linear focusing regime, the negative part of the waveform has the same duration as the positive part–i.e., t−/t+ =1 with the negative part lasting for a half cycle. Nonlinear effects tend to increase the duration of the rarefaction phase, with the most dramatic effects occurring for fully developed shocks. In this regime, t−/t+ can reach 2.5, which may enhance cavitation activity in the focal region.
The results for focal pressures with a certain degree of nonlinear distortion were obtained here under consideration of free-field focusing in water, using the internal pressure of water in simulations. Equation (10) shows how the modeling or measurements in water can be adapted to biological tissue. First, the internal pressure p* and parameter ka should be rescaled to represent a medium with a different sound speed, density, and nonlinearity parameter. Then, to compensate for tissue absorption, a derating procedure proposed in [56] can be used. It was shown that the shock amplitude and peak pressures in tissue would be the same as those in water if a higher dimensionless source pressure P = p/p* is used to compensate for linear losses of beam energy in the prefocal region. Note also that when a coupling layer is present between the source and the treatment site, refraction effects can shift the focus and produce a corresponding change in F-number, which should be considered. With these derating steps, the results of measurements or modeling in water can be transferred to tissue. A more general but significantly more complicated patient-specific approach to predict in situ fields for treatment planning would include direct nonlinear modeling in inhomogeneous tissue with acoustic properties reconstructed from 3D MRI or CT scans [32] and realistic boundary conditions determined from characterization in water [26, 27].
The axisymmetric KZK equation has some constraints that may limit the applicability of the proposed design approach to certain sources. Although it has been successfully validated for array transducers with central holes and approximate axial symmetry, highly asymmetric aperture profiles such as rectangular transducers may naturally have different shapes of the focal lobe on the beam axis. In this case, the focal region may not be accurately replicated by an equivalent circular source. The accuracy of the model will be tested in the future to simulate focal pressures generated by such sources.
In summary, the results presented here can provide look-up data for evaluating nonlinear distortions at the focus of existing therapeutic systems as well as for developing new sources that generate specified degrees of nonlinear effects (Table 1). For existing sources, the output at which each characteristic level of nonlinear distortion is achieved can be determined. Inversely, parameters for source geometry and output level can be estimated for designing transducers for therapeutic applications in which specified shock amplitudes or peak pressures without the formation of a shock front are required.
Acknowledgments
The work was supported by Russian Science Foundation (14-12-00974), National Institutes of Health (EB007643 and P01 DK43881), and NSBRI through NASA NCC 9-58.
The authors thank their colleagues from the Center for Industrial and Medical Ultrasound at the University of Washington for fruitful discussions and Kenneth Bader from the University of Cincinnati for providing a single-element histotripsy transducer manufactured by Imasonic for validation experiments. Simulations were performed on the SKIF “Chebyshev” and “Lomonosov” clusters of the Moscow State University supercomputer center.
Contributor Information
Pavel B. Rosnitskiy, Physics Faculty, M. V. Lomonosov Moscow State University, Moscow, Russia
Petr V. Yuldashev, Physics Faculty, M. V. Lomonosov Moscow State University, Moscow, Russia
Oleg A. Sapozhnikov, Physics Faculty, M. V. Lomonosov Moscow State University, Moscow, Russia. Center for Industrial and Medical Ultrasound, Applied Physics Laboratory, University of Washington, Seattle, WA
Adam Maxwell, Center for Industrial and Medical Ultrasound, Applied Physics Laboratory, University of Washington, Seattle, WA.
Wayne Kreider, Center for Industrial and Medical Ultrasound, Applied Physics Laboratory, University of Washington, Seattle, WA.
Michael R. Bailey, Center for Industrial and Medical Ultrasound, Applied Physics Laboratory, University of Washington, Seattle, WA
Vera A. Khokhlova, Physics Faculty, M. V. Lomonosov Moscow State University, Moscow, Russia. Center for Industrial and Medical Ultrasound, Applied Physics Laboratory, University of Washington, Seattle, WA
References
- 1.Dubinsky TJ, Cuevas C, Dighe MK, Kolokythas O, Hwang H. High-intensity focused ultrasound: current potential and oncologic applications. AJR Am J Roentgenol. 2008;190:191–199. doi: 10.2214/AJR.07.2671. [DOI] [PubMed] [Google Scholar]
- 2.Crouzet S, Chapelon JY, Rouvière O, Mege-Lechevallier F, Colombel M, Tonoli-Catez H, et al. Whole-gland ablation of localized prostate cancer with high-intensity focused ultrasound: oncologic outcomes and morbidity in 1002 patients. Eur Urol. 2013;65(5):907–914. doi: 10.1016/j.eururo.2013.04.039. [DOI] [PubMed] [Google Scholar]
- 3.Dorenberg EJ, Courivaud F, Ring E, Hald K, Jakobsen JA, Fosse E, Hol PK. Volumetric ablation of uterine fibroids using Sonalleve high-intensity focused ultrasound in a 3 Tesla scanner–first clinical assessment. Minim Invasive Therapy and Allied Technol. 2013;22(2):73–79. doi: 10.3109/13645706.2012.702672. [DOI] [PubMed] [Google Scholar]
- 4.Cranston D. A review of high intensity focused ultrasound in relation to the treatment of renal tumours and other malignancies. Ultrason Sonochem. 2015;27:654–658. doi: 10.1016/j.ultsonch.2015.05.035. [DOI] [PubMed] [Google Scholar]
- 5.Aubry JF, Pauly KB, Moonen C, Haar GT, Ries M, Salomir R, et al. The road to clinical use of high-intensity focused ultrasound for liver cancer: technical and clinical consensus. J Ther Ultrasound. 2013;1:13. doi: 10.1186/2050-5736-1-13. [DOI] [PMC free article] [PubMed] [Google Scholar]
- 6.Knuttel FM, van den Bosch MA. Magnetic resonance-guided high intensity focused ultrasound ablation of breast cancer. Adv Exp Med Biol. 2016;880:65–81. doi: 10.1007/978-3-319-22536-4_4. [DOI] [PubMed] [Google Scholar]
- 7.Brown MR, Farquhar-Smith P, William JE, ter Haar G, deSouza NM. The use of high-intensity focused ultrasound as a novel treatment for painful conditions-a description and narrative review of the literature. Br J Anaesth. 2015;115(4):520–30. doi: 10.1093/bja/aev302. [DOI] [PubMed] [Google Scholar]
- 8.Elias WJ, Huss D, Voss T, Loomba J, Khaled M, Zadicario E, Frysinger RC, Sperling SA, Wylie S, Monteith SJ, Druzgal J, Shah BB, Harrison M, Wintermark M. A pilot study of focused ultrasound thalamotomy for essential tremor. New England Journ of Medicine. 2013;369:640–648. doi: 10.1056/NEJMoa1300962. [DOI] [PubMed] [Google Scholar]
- 9.Filonenko E, Khokhlova V. Effect of acoustic nonlinearity on heating of biological tissue by high-intensity focused ultrasound. Acous Phys. 2001;47(4):468–475. [Google Scholar]
- 10.Canney MS, Khokhlova VA, Bessonova OV, Bailey MR, Crum LA. Shock-induced heating and millisecond boiling in gels and tissue due to high intensity focused ultrasound. Ultrasound Med Biol. 2010;36(2):250–267. doi: 10.1016/j.ultrasmedbio.2009.09.010. [DOI] [PMC free article] [PubMed] [Google Scholar]
- 11.Vaezy S, Shi X, Martin RW, Chi E, Nelson PI, Bailey MR, Crum LA. Real-time visualization of focused ultrasound therapy. Ultrasound Med Biol. 2001;27(1):33–42. doi: 10.1016/s0301-5629(00)00279-9. [DOI] [PubMed] [Google Scholar]
- 12.Khokhlova VA, Bailey MR, Reed JA, Cunitz BW, Kaczkowski PJ, Crum LA. Effects of nonlinear propagation, cavitation, and boiling in lesion formation by high intensity focused ultrasound in a gel phantom. J Acoust Soc Am. 2006;119(3):1834–1848. doi: 10.1121/1.2161440. [DOI] [PubMed] [Google Scholar]
- 13.Wu F, Wang ZB, Chen WZ, et al. Extracorporeal high intensity focused ultrasound ablation in the treatment of 1038 patients with solid carcinomas in China: an overview. Ultrason Sonochemistry. 2004;11:149–154. doi: 10.1016/j.ultsonch.2004.01.011. [DOI] [PubMed] [Google Scholar]
- 14.Fry FJ, Sanghvi NT, Foster BR, Hennige C. Ultrasound and Microbubbles: their generation, detection, and potential utilization in tissue and organ therapy–experimental. Ultrasound Med Biol. 1995;21(9):1227–1237. doi: 10.1016/0301-5629(96)89519-6. [DOI] [PubMed] [Google Scholar]
- 15.Maxwell A, Sapozhnikov O, Bailey M, Crum L, Xu Z, Fowlkes B, Cain C, Khokhlova V. Disintegration of tissue using high intensity focused ultrasound: Two approaches that utilize shock waves. Acoustics Today. 2012;8(4):24–36. [Google Scholar]
- 16.Khokhlova VA, Fowlkes JB, Roberts WW, Schade GR, Xu Z, Khokhlova TD, Hall TL, Maxwell AD, Wang YN, Cain CA. Histotripsy methods in mechanical disintegration of tissue: Towards clinical applications. Int J Hyperthermia. 2015;31:2, 145–162. doi: 10.3109/02656736.2015.1007538. [DOI] [PMC free article] [PubMed] [Google Scholar]
- 17.Hoogenboom M, Eikelenboom D, Den brok MH, Heerschap A, Futterer JJ, Adema GJ. Mechanical high-intensity focused ultrasound destruction of soft tissue: working mechanisms and physiologic effects. Ultrasound Med Biol. 2015;41(6):1500–1517. doi: 10.1016/j.ultrasmedbio.2015.02.006. [DOI] [PubMed] [Google Scholar]
- 18.Pahk KJ, Mohammad GH, Malago M, Saffari N, Dhar DK. A novel approach to ultrasound-mediated tissue decellularization and intra-hepatic cell delivery in rats. Ultrasound Med Biol. 2016;42(8):1958–1967. doi: 10.1016/j.ultrasmedbio.2016.03.020. [DOI] [PubMed] [Google Scholar]
- 19.Parsons J, Cain C, Abrams G, Fowlkes J. Pulse, cavitational ultrasound therapy for controlled tissue homogenization. Ultrasound Med Biol. 2006;32(1):115–129. doi: 10.1016/j.ultrasmedbio.2005.09.005. [DOI] [PubMed] [Google Scholar]
- 20.Khokhlova T, Canney M, Khokhlova V, Sapozhnikov O, Crum L, Bailey M. Controlled tissue emulsification produced by high intensity focused ultrasound shock waves and millisecond boiling. J Acoust Soc Am. 2011;130(5):3498–3510. doi: 10.1121/1.3626152. [DOI] [PMC free article] [PubMed] [Google Scholar]
- 21.Lin ]KW, Kim Y, Maxwell AD, Wang TY, Hall TL, Xu Z, Fowlkes JB, Cain CA. Histotripsy beyond the intrinsic cavitation threshold using very short ultrasound pulses: microtripsy. IEEE Trans Ultrason Ferroelectr Freq Control. 2014;61(2):251–265. doi: 10.1109/TUFFC.2014.6722611. [DOI] [PMC free article] [PubMed] [Google Scholar]
- 22.Rosnitskiy PB, Yuldashev PV, Khokhlova VA. Effect of the angular aperture of medical ultrasound transducers on the parameters of nonlinear ultrasound field with shocks at the focus. Acoust Phys. 2015;61(3):301–307. [Google Scholar]
- 23.O’Neil HT. Theory of focusing radiators. J Acoust Soc Am. 1949;21(5):516–526. [Google Scholar]
- 24.Rosnitskiy PB, Yuldashev PV, Vysokanov BA, Khokhlova VA. Setting boundary conditions to the Khokhlov–Zabolotskaya equation for modeling ultrasound fields generated by strongly focused transducers. Acoust Phys. 2016;62(2):151–159. [Google Scholar]
- 25.Bader KB, Holland CK. Predicting the growth of nanoscale nuclei by histotripsy pulses. Phys Med Biol. 2016;61(7):2947–2966. doi: 10.1088/0031-9155/61/7/2947. [DOI] [PMC free article] [PubMed] [Google Scholar]
- 26.Sapozhnikov OA, Tsysar SA, Khokhlova VA, Kreider W. Acoustic holography as a metrological tool for characterizing medical ultrasound sources and fields. J Acoust Soc Am. 2015;138(3):1515–1532. doi: 10.1121/1.4928396. [DOI] [PMC free article] [PubMed] [Google Scholar]
- 27.Kreider W, Yuldashev PV, Sapozhnikov OA, Farr N, Partanen A, Bailey MR, Khokhlova VA. Characterization of a multi-element clinical HIFU system using acoustic holography and nonlinear modeling. IEEE Trans Ultrason, Ferroelect, Freq Contr. 2013;60(8):1683–1698. doi: 10.1109/TUFFC.2013.2750. [DOI] [PMC free article] [PubMed] [Google Scholar]
- 28.Westervelt PJ. Parametric acoustic array. J Acoust Soc Am. 1963;35(4):535–537. [Google Scholar]
- 29.Tavakkoli J, Cathignol D, Souchon R, Sapozhnikov OA. Modeling of pulsed finite-amplitude focused sound beams in time domain. J Acoust Soc Am. 1998;104(4):2061–2072. doi: 10.1121/1.423720. [DOI] [PubMed] [Google Scholar]
- 30.Huijssen J, Verweij MD. An iterative method for the computation of nonlinear, wide-angle, pulsed acoustic fields of medical diagnostic transducers. J Acoust Soc Am. 2010;127:33–44. doi: 10.1121/1.3268599. [DOI] [PubMed] [Google Scholar]
- 31.Jing Y, Wang TR, Clement GT. A k-space method for moderately nonlinear wave propagation. IEEE Trans Ultrason Ferroelectr Freq Control. 2012;59:1664–1673. doi: 10.1109/TUFFC.2012.2372. [DOI] [PMC free article] [PubMed] [Google Scholar]
- 32.Jaros J, Rendell AP, Treeby BE. Full-wave nonlinear ultrasound simulation on distributed clusters with applications in high-intensity focused ultrasound. Int Journ of High Performance Computing Applications. 2015 Apr 29; 1094342015581024. [Google Scholar]
- 33.Yuldashev PV, Khokhlova VA. Simulation of three-dimensional nonlinear fields of ultrasound therapeutic arrays. Acoust Phys. 2011;57(3):334–343. doi: 10.1134/S1063771011030213. [DOI] [PMC free article] [PubMed] [Google Scholar]
- 34.Ultrasonics—field characterization—specification and measurement of field parameters for high intensity therapeutic ultrasound (HITU) transducers and systems, IEC/TS62556, 2014, ed. 1.0.
- 35.Martin E, Ling YT, Treeby BE. Simulating focused ultrasound transducers using discrete sources on regular cartesian grids. IEEE Trans Ultrason Ferroelectr Freq Control. 2016;63(10):1535–1542. doi: 10.1109/TUFFC.2016.2600862. [DOI] [PubMed] [Google Scholar]
- 36.Varslot T, Taraldsen G. Computer simulation of forward wave propagation in soft tissue. IEEE Trans Ultrason Ferroelectr Freq Control. 2005;52(9):1473–1482. doi: 10.1109/tuffc.2005.1516019. [DOI] [PubMed] [Google Scholar]
- 37.Zemp RJ, Tavakkoli J, Cobbold RS. Modeling of nonlinear ultrasound propagation in tissue from array transducers. J Acoust Soc Am. 2003;113(1):139–152. doi: 10.1121/1.1528926. [DOI] [PubMed] [Google Scholar]
- 38.Kurganov A, Tadmor E. New high-resolution central schemes for nonlinear conservation laws and convection-diffusion equations. J Comput Phys. 2000;160(1):241–282. [Google Scholar]
- 39.Zabolotskaya EA, Khokhlov RV. Quasi-plane waves in the nonlinear acoustics of confined beams. Sov Phys Acoust. 1969;15:35–40. [Google Scholar]
- 40.Kuznetsov VP. Equations of nonlinear acoustics. Sov Phys Acoust. 1971;16:467–470. [Google Scholar]
- 41.Rudenko OV. The 40th anniversary of the Khokhlov-Zabolotskaya equation. 2010;56(4):457–466. [Google Scholar]
- 42.Tjotta JN, Tjotta S, Vefring EH. Effects of focusing on the nonlinear interaction between two collinear finite amplitude sound beams. J Acoust Soc Am. 1991;89(3):1017–1027. [Google Scholar]
- 43.Khokhlova VA, Souchon R, Tavakkoli J, Sapozhnikov OA, Cathignol D. Numerical modeling of finite-amplitude sound beams: Shock formation in the near field of a CW plane piston source. J Acoust Soc Am. 2002;110(1):95–108. [Google Scholar]
- 44.Canney MS, Bailey MR, Crum LA, Khokhlova VA, Sapozhnikov OA. Acoustic characterization of high intensity focused ultrasound fields: A combined measurement and modeling approach. J Acoust Soc Am. 2008;124(4):2406–2420. doi: 10.1121/1.2967836. [DOI] [PMC free article] [PubMed] [Google Scholar]
- 45.Bessonova OV, Wilkens V. Membrane hydrophone measurement and numerical simulation of HIFU fields up to developed shock regimes. IEEE Trans Ultrason Ferroelectr Freq Control. 2013;60(2):290–300. doi: 10.1109/TUFFC.2013.2565. [DOI] [PubMed] [Google Scholar]
- 46.Bessonova O, Khokhlova V, Bailey M, Canney M, Crum L. Focusing of high power ultrasound beams and limiting values of shock wave parameters. Acoust Phys. 2009;55(4–5):463–473. doi: 10.1134/S1063771009040034. [DOI] [PMC free article] [PubMed] [Google Scholar]
- 47.Averiyanov M, Ollivier S, Khokhlova V, Blanc-Benon Ph. Nonlinear acoustic N-wave random focusing in fully developed turbulence: laboratory scale experiment. J Acoust Soc Am. 2011;130(6):3595–3607. doi: 10.1121/1.3652869. [DOI] [PubMed] [Google Scholar]
- 48.Perez C, Chen H, Matula TJ, Karzova MS, Khokhlova VA. Acoustic field characterization of the Duolith: Measurements and modeling of a clinical shockwave therapy device. J Acoust Soc Am. 2013;134(2 Pt 2):1663–1674. doi: 10.1121/1.4812885. [DOI] [PMC free article] [PubMed] [Google Scholar]
- 49.Ultrasonics - Field characterization - In situ exposure estimation in finite-amplitude ultrasonic beams. IEC TS 61949, 2007.
- 50.Hall T, Cain C. A low cost compact 512 channel therapeutic ultrasound system for transcutaneous ultrasound surgery. AIP Conf Proc. 2006;829(1):445. [Google Scholar]
- 51.Kim Y, Maxwell AD, Hall TL, Xu Z, Lon KW, Cain CA. Rapid prototyping fabrication of focused ultrasound transducers. IEEE Trans Ultrason Ferroelectr Freq Control. 2014;61(9):1559–1574. doi: 10.1109/TUFFC.2014.3070. [DOI] [PubMed] [Google Scholar]
- 52.Staudenraus J, Eisenmenger W. Fibre-optic probe hydrophone for ultrasonic and shock-wave measurements in water. Ultrasonics. 1993;31:267–273. [Google Scholar]
- 53.Kreider W, Maxwell AD, Khokhlova T, Simon JC, Khokhlova VA, Sapozhnikov O, Bailey MR. Rectified growth of histotripsy bubbles. Proc Meet Acoust. 2013;19(1):075035. doi: 10.1121/1.4800326. [DOI] [PMC free article] [PubMed] [Google Scholar]
- 54.Musatov AG, Rudenko OV, Sapozhnikov OA. Nonlinear refraction and nonlinear absorption in the focusing of high-intensity pulses. Sov Phys Acoust (USA) 1992;38(3):274–279. [Google Scholar]
- 55.Karzova MM, Averiyanov MV, Sapozhnikov OA, Khokhlova VA. Mechanisms for saturation of nonlinear pulsed and periodic signals in focused acoustic beams. Acoust Phys. 2012;58(1):81–89. [Google Scholar]
- 56.Bessonova O, Khokhlova V, Canney M, Bailey M, Crum L. A derating method for therapeutic applications of high intensity focused ultrasound. Acoust Phys. 2010;56(3):354–363. doi: 10.1134/s1063771010030140. [DOI] [PMC free article] [PubMed] [Google Scholar]


