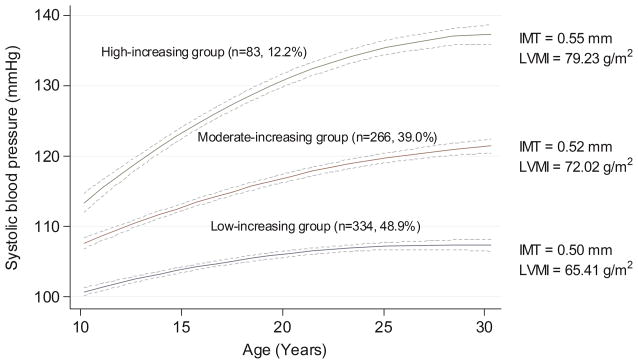
Figure 1. Trajectory groups identified for systolic blood pressure (SBP) from childhood to adulthood.
Their patterns by age, the number and percentage were shown for each group. The mean levels of IMT and LVMI in adulthood were also shown for each group. Dash lines are 95% confidence interval lines.

