Abstract
Background & Aims
Circulating tumor DNA (ctDNA) carrying tumor-specific sequence alterations has been found in the cell-free fraction of blood. Liver cancer tumor specimens are difficult to obtain, and noninvasive methods are required to assess cancer progression and characterize underlying genomic features.
Methods
We analyzed 46 patients with hepatocellular carcinoma who underwent hepatectomy or liver transplantation and for whom whole-genome sequencing data was available. We designed personalized assays targeting somatic rearrangements of each tumor to quantify serum ctDNA. Exome sequencing was performed using cell-free DNA paired primary tumor tissue DNA from a patient with recurrent liver cancer after transcatheter arterial chemoembolization (TACE).
Results
We successfully detected ctDNA from 100 μL of serum samples in 7 of the 46 patients before surgery, increasing with disease progression. The cumulative incidence of recurrence and extrahepatic metastasis in the ctDNA-positive group were statistically significantly worse than in the ctDNA-negative group (P = .0102 and .0386, respectively). Multivariate analysis identified ctDNA (OR 6.10; 95% CI, 1.11–33.33, P = .038) as an independent predictor of microscopic vascular invasion of the portal vein (VP). We identified 45 nonsynonymous somatic mutations in cell-free DNA after TACE and 71 nonsynonymous somatic mutations in primary tumor tissue by exome sequencing. We identified 25 common mutations in both samples, and 83% of mutations identified in the primary tumor could be detected in the cell-free DNA.
Conclusions
The presence of ctDNA reflects tumor progression, and detection of ctDNA can predict VP and recurrence, especially extrahepatic metastasis within 2 years. Our study demonstrated the usefulness of ctDNA detection and sequencing analysis of cell-free DNA for personalized treatment of liver cancer.
Keywords: Circulating Tumor DNA, Exome Sequencing, Hepatocellular Carcinoma, Whole-Genome Sequencing
Abbreviations used in this paper: AFP, α-fetoprotein; ALT, alanine aminotransferase; AST, aspartate aminotransferase; cHCC/CC, combined hepatocellular and cholangiocarcinoma; ctDNA, circulating tumor DNA; DCP, des-γ-carboxy prothrombin; HAIC, hepatic arterial infusion chemotherapy; HBV, hepatitis B virus; HCC, hepatocellular carcinoma; HCV, hepatitis C virus; PCR, polymerase-chain-reaction; TACE, transcatheter arterial chemoembolization; VP, microscopic vascular invasion to portal vein
Summary.
Analysis of circulating tumor DNA from the cell-free fraction of blood can detect tumor recurrence and progression in liver cancer, especially extrahepatic metastasis within 2 years.
Cancer genome sequencing has been performed and applied clinically in several cancers. A subgroup of patients with non-small-cell lung cancer have specific mutations in the epidermal growth factor receptor (EGFR) gene that correlate with clinical responsiveness to the tyrosine kinase inhibitor gefitinib.1, 2 Patients with a colorectal tumor bearing mutated K-ras did not benefit from cetuximab, whereas patients with a tumor bearing wild-type K-ras did benefit from cetuximab.3 Clinical responses to imatinib depend on the exonic location of KIT mutations in gastrointestinal stromal tumors.4 Hence, recent advances in cancer genome analysis and genome-based diagnosis are enabling personalized medicine and individualization of cancer treatment. Cancer genome sequencing is also used to monitor the state of cancer progression.5, 6
In hepatocellular carcinoma (HCC), unlike in many other solid tumors, diagnosis is often based on contrast-enhanced studies, such as computerized tomography or magnetic resonance imaging, and treatment is often undertaken without percutaneous tumor biopsy.7, 8
Circulating tumor DNA (ctDNA) carrying tumor-specific sequence alterations have been found in the cell-free fraction of blood.9, 10 Several studies have indicated that ctDNA carrying specific KRAS mutations are useful for diagnosis and prognostic prediction in some solid tumors.11, 12 Therefore, ctDNA collected without percutaneous tumor biopsy might be an innovative tool to analyze the cancer genome of HCC as a so-called liquid biopsy.
Several studies have shown the utility of ctDNA in monitoring tumor dynamics in patients with various solid cancers5, 6, 13, 14, 15 and in identifying mutations associated with acquired drug resistance in advanced cancers.6 Recent studies have shown that ctDNA contains the comprehensive tumor genome, including variants originating from multiple independent tumors.16, 17 Therefore, ctDNA is expected to be an effective tool to overcome tumor heterogeneity.
In HCC, Chan et al16 showed that shotgun sequencing of plasma samples from HCC patients would allow cancer-associated copy number aberrations and mutations to be analyzed noninvasively and in a genomewide fashion. However, ctDNA of HCC has not been well characterized so far. In this study, we detected cancer-specific genomic rearrangements on 46 HCCs by whole-genome sequencing and validated some of them by polymerase chain reaction (PCR) using ctDNA detection in patient sera. We investigated whether ctDNA levels reflect HCC tumor dynamics and could be used as a predictor of poor prognosis by quantifying each of the cancer-specific genomic rearrangements. We have also investigated whether exome sequencing of cell-free DNA (which is defined in this paper as whole extracellular DNA circulating in blood containing ctDNA) in a patient with liver cancer could identify somatic mutations in cancer tissue.
Materials and Methods
Patients
Eligible patients included those who underwent hepatectomy or liver transplantation for HCC and combined hepatocellular and cholangiocarcinoma (cHCC/CC) at Hiroshima University during the period between October 2009 and January 2012. For 46 of these patients, sequential serum samples were available; somatic rearrangements had been identified by whole-genome sequencing of tumor tissue, and control lymphocytes were recruited. We quantified ctDNA in a total of 50 serial serum samples by means of real-time PCR. We performed exome sequencing of primary tumor tissue and cell-free DNA from plasma samples after transcatheter arterial chemoembolization (TACE) of another patient with cHCC/CC. The study protocol was approved by the Human Ethics Review Committee of Hiroshima University and RIKEN, and a signed consent form was obtained from each patient.
Sample Collection and Storage
A tumor tissue samples were obtained immediately after the liver resection and were frozen in liquid nitrogen and stored at −80°C. Serum samples obtained by venipuncture using 5-mL serum-separating tubes (P1; SRL, Tokyo, Japan) were centrifuged at 3500 rpm for 10 minutes, and the supernatant was kept frozen at −80°C for later use in DNA preparation. Plasma samples obtained by venipuncture using 5-mL EDTA-2K blood collection tubes (VP-DK050K; Terumo, Tokyo, Japan). The blood was centrifuged at 3500 rpm for 10 minutes, and the supernatant (plasma) was collected and centrifuged at 12,000 rpm for 10 minutes. Then the supernatant was collected and stored at −80°C for later use in DNA preparation.
Tumor Markers
We used a chemiluminescent immunoassay (Fujire Bio, Tokyo, Japan) and chemiluminescent enzyme immunoassay (Abbott Laboratories, Abbott Park, IL) to analyze α-fetoprotein (AFP) and des-γ-carboxy prothrombin (DCP), respectively. Thresholds for AFP and DCP abnormalities were defined as 10 ng/mL and 30 mAU/mL, respectively.
Whole-Genome Sequencing
DNA was extracted from frozen tumor tissues and lymphocytes, and 500-bp insert Illumina libraries were prepared from 1 μg of DNA from each sample. The libraries were analyzed using massively parallel sequencing on the HiSeq2000 platform (Illumina, San Diego, CA) with 101-bp paired reads according to the manufacturer’s instructions. Average sequencing depths of the cancer and control (lymphocyte) genomes were about 40x and 30x, respectively, after the removal of PCR duplicates.
Somatic Genomic Rearrangement Calls
Read pairs were mapped to the human reference genome GRCh37 using Burrows-Wheeler Aligner software (bio-bwa.sourceforge.net/).18 Cancer-specific somatic rearrangements were identified as described previously elsewhere.19 Briefly, inconsistent read pairs that occurred within 500 bp of each other were considered to support the same rearrangement. We identified candidate rearrangements in both tumor (support read pairs ≥4) and normal tissue (support read pairs ≥1) samples, and we also identified tumor-specific rearrangement candidates. To exclude mapping errors, we performed a Basic Local Alignment Search Tool (BLAST) search of read pairs that supported rearrangements against the reference genome. Read pairs that mapped with the correct orientation and distance (≤500 bp) with an E-value <10−7 were excluded. Reads that mapped with more than two mismatches were also discarded. After filtering, candidates supported by ≥4 read pairs and at least one perfect match pair were considered somatic rearrangements.
Primer and Probe Design
For each cancer genome, we selected three somatic rearrangements in which calls were supported by the largest number of read pairs in each sample, and we designed primers spanning the breakpoints (see Supplementary Table 1). PCR of the breakpoints using these primers was performed using DNA from the cancer and lymphocytes as positive and negative controls, respectively. The PCR products were confirmed by Sanger sequencing, and confirmed primers were used for serum DNA PCR.
Detection of Circulating Tumor DNA (ctDNA) by PCR
Cell-free DNA was extracted from 100 μL of preoperative serum by the SMI-TEST (Genome Science Laboratories, Tokyo, Japan) according to the manufacturer’s instructions and dissolved in 20 μL of distilled water. The extracted ctDNA from serum samples was amplified by PCR using the primers described in Supplementary Table 2. The 2.5 ng of DNA samples from cancer tissue and from blood cells was used as the positive and negative controls, respectively. We also used cell-free DNA extracted from the serum of chronic hepatitis C (HCV) and hepatitis B (HBV) virus patients without HCC as negative controls.
We loaded 1 μL samples of cell-free DNA dissolved in 20 μL of distilled water. We also performed nontemplate amplification scattered among samples, but no false positive results were observed. PCR was performed in a total volume of 50 μL, consisting of 5 μL of 10x PCR buffer for KOD-Plus-Neo, 0.2 mM of dNTPs, 1.5 mM of MgSO4, 0.3 μM of each primer, 1 μL of the DNA solution, and 1 U/50 μL of KOD-Plus-Neo (Toyobo, Osaka, Japan).
We tried to detect ctDNA using one to three primer sets among patients. We initially performed PCR in a two-step cycle as recommended by the manufacturer’s instructions (KOD-Plus-Neo): initial denaturation at 94°C for 2 minutes, followed by 40 cycles of denaturation at 98°C for 10 seconds, then extension at 68°C for 30 seconds. In cases of amplification failure, we performed PCR in a three-step cycle according to the manufacturer’s instructions, as follows: initial denaturation at 94°C for 2 minutes, followed by 40 cycles of denaturation at 98°C for 10 seconds, annealing at the primer-specific melting temperature (shown in Supplementary Table 2) for 30 seconds, and extension at 68°C for 30 seconds. If the band was not observed after electrophoresis of the PCR product in positive controls, we set the annealing temperature lower. If smeared bands made judgment was difficult, we set the annealing temperature higher and/or set the extension time to 10 s/kb.
Then we evaluated whether the sample was positive or negative under conditions in which amplification was observed clearly in positive controls and smeared bands were not observed in negative controls or cell-free DNA after electrophoresis of the PCR product. The conditions we used for judgment are shown in Supplementary Table 2. We defined the result to be positive when ctDNA was amplified by one or more of the primer sets. We synthesized DNA oligos based on mutated cancer genomes (Integrated DNA Technologies, Coralville, IA) (Supplementary Table 3) and made a serial dilution. To confirm the robustness of the results, we performed PCR for each template using 13 primer sets.
Quantification of ctDNA in Sera
Real-time PCR analysis was performed on samples that tested positive in the detection assay and for which serial serum samples were available. PCR was performed using the Mx300P System (Applied Biosystems, Foster City, CA) according to the instructions provided by the manufacturer. We prepared 10 μL of EXPRESS SYBR GreenER qPCR SuperMix Universal (Applied Biosystems), 200 nM of forward primer, 200 nM of reverse primer, 25 μM of ROX Reference Dye, 1 μL of DNA, and 7.8 μL of distilled water. The above custom-synthesized DNA oligos were diluted from 105 with distilled water, as shown in Supplementary Table 2, to produce a series of standard quantitative PCR preparations used to generate the standard curve (Figure 1). The optimal threshold in each assay was chosen automatically in MxPro QPCR Software Version 4.10 (Agilent Technologies, Santa Clara, CA). The lower threshold is indicated using a dotted line in Figure 5. Each sample was processed in a set of triplicate counterparts. The cycling programs are shown in Supplementary Table 2. In cycling program A, the sample was heated for 20 seconds at 95°C for denaturing, followed by a PCR cycling program consisting of 40 three-step cycles of 5 seconds each at 5°C, and 20 seconds at 60°C. In cycling program B, the sample was heated for 10 minutes at 95°C for denaturing, followed by a PCR cycling program consisting of 40 three-step cycles of 30 seconds each at 95°C, 60 seconds at 55°C, and 60 seconds at 72°C.
Figure 1.
Quantitative ranges. Quantitative ranges were from 105 copies to 5 copies in the most sensitive assay and 105 copies to 102 copies in the least sensitive assay, as shown in the upper and lower panels, respectively.
Figure 5.
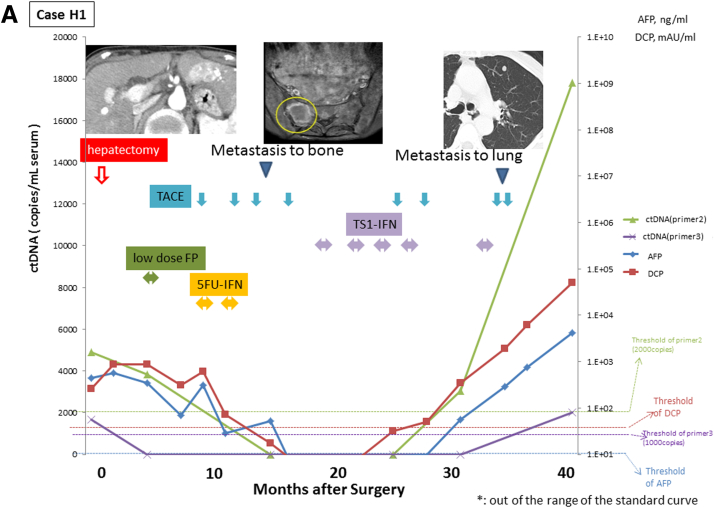
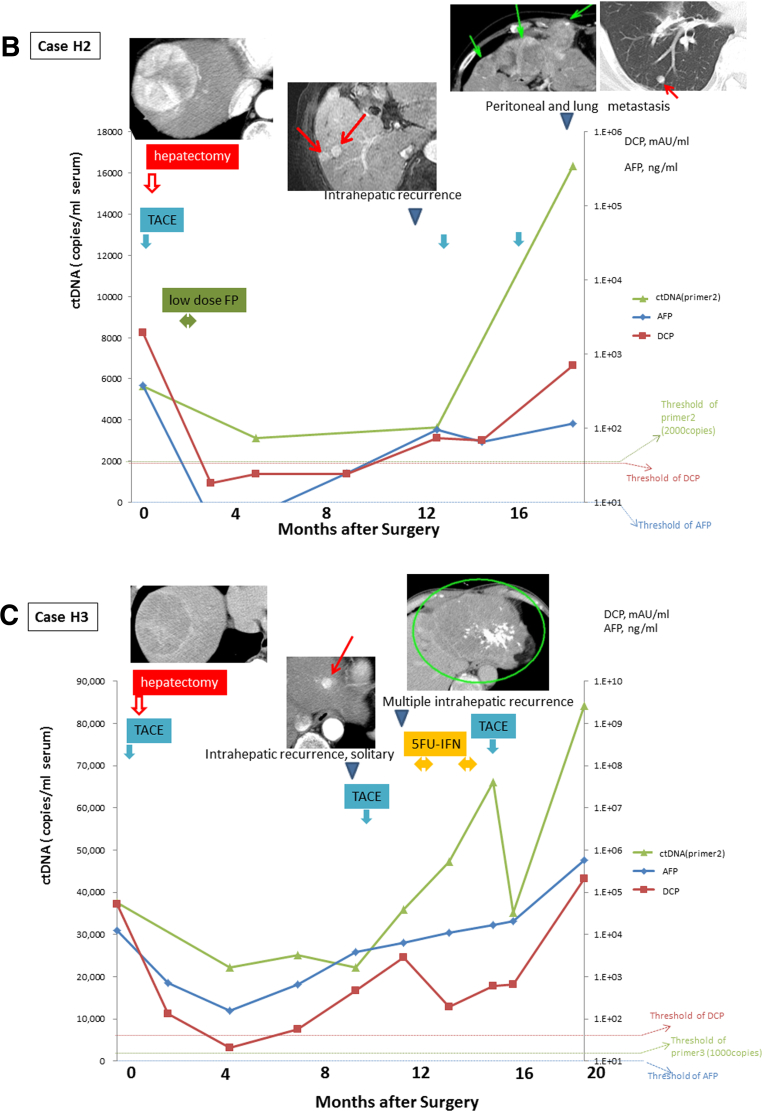
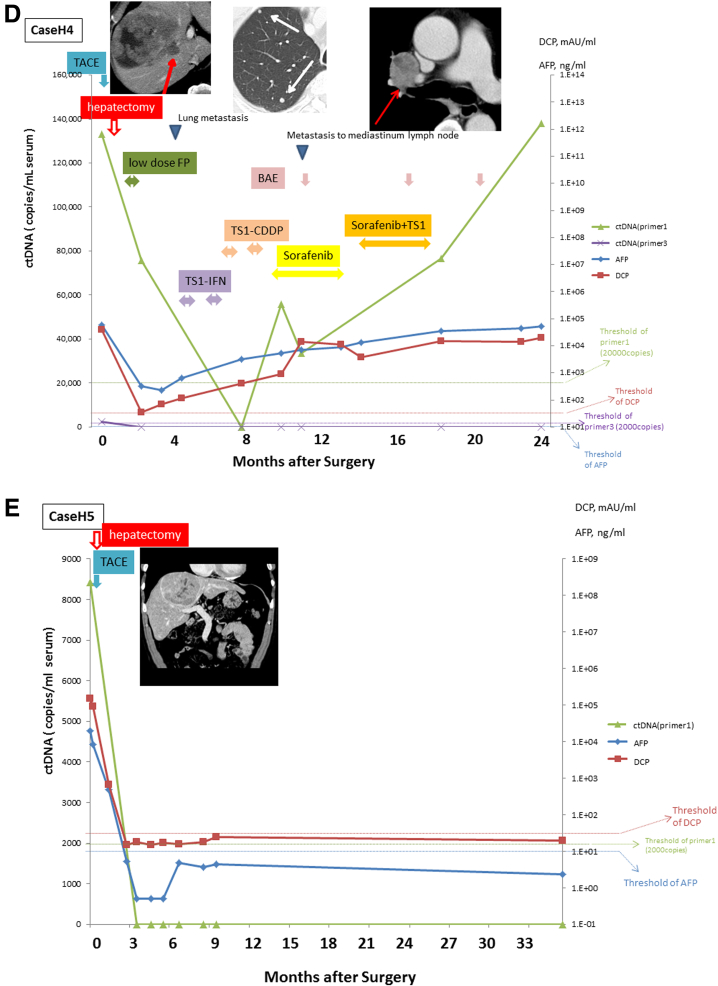
Monitoring of serial circulating tumor DNA (ctDNA) levels. The ctDNA was quantified by real-time quantitative polymerase chain reaction in sera serially sampled before and after surgery from the four patients with positive ctDNA (cases H1–H5). The figure shows the time course of serum levels of ctDNA, α-fetoprotein (AFP), and des-γ-carboxy prothrombin (DCP) with their clinical events and treatments. Levels of ctDNA are expressed as a ratio relative to levels of those obtained using DNA extracted from tumor tissue.
Exome Sequencing of Plasma Cell-Free DNA
Plasma cell-free DNA was extracted from 1 mL of plasma from one patient with metastasis (case C1) using the QIAamp circulating nucleic acid kit (Qiagen, Valencia, CA) according to the manufacturer’s instructions. The DNA was eluted into 50 μL of buffer AVE (RNasa-free water containing 0.04% sodium azide), eluted twice through each column, and stored at −20 °C. The quantity of the extracted DNA was analyzed by the Qubit fluorometer (Invitrogen/Life Technologies, Carlsbad, CA). We subjected 50 ng of plasma cell-free DNA, primary tumor DNA, and lymphocyte DNA to Illumina Nextera library generation, and targeted enrichment was performed using the Nextera Rapid Capture Exome kit (Illumina) according to the manufacturer’s instructions. The enrichment system included 37 Mega-base pairs of protein-coding exons from the human genome, amounting to 214,405 exons. Sequencing was performed with HiSeq2500 (Illumina) with paired-end 101-bp reads. The coverage in targeted regions after the removal of PCR duplicates is shown in Table 1.
Table 1.
Coverage in Targeted Regions
| Target Regions | Lymphocyte | Tissue | cfDNA |
|---|---|---|---|
| Number | 212,158 | 212,158 | 212,158 |
| Total length | 37,105,383 | 37,105,383 | 37,105,383 |
| Average coverage | 106.9 | 100.4 | 94.1 |
| No. with coverage <30 | 69,030 | 100,139 | 76,914 |
| Total length with coverage <30 | 20,405,685 | 25,663,716 | 22,051,522 |
| Minimum coverage (%) | |||
| 1 x | 99.71 | 98.38 | 99.50 |
| 5 x | 98.74 | 96.01 | 98.26 |
| 10 x | 97.03 | 93.23 | 96.40 |
| 20 x | 92.60 | 87.79 | 92.07 |
| 40 x | 81.16 | 76.12 | 80.82 |
| 80 x | 53.46 | 51.91 | 50.80 |
| 100 x | 41.27 | 41.13 | 37.51 |
Variant Detection
Sequencing reads were aligned to the U.S. National Center for Biotechnology Information (NCBI) reference genome (hg19 Build 37) and analyzed using CLC Genomics Workbench 6.5.1 and 7.5 software (CLC Bio, Aarhus, Denmark). We analyzed our sequencing data derived from cell-free DNA, primary tumor, and control lymphocytes using the Probabilistic Variant Detection Tool and Low Frequency Variant Detection Tool included in the Genomics Workbench.
Probabilistic Variant Detection Tool
The algorithm of Probabilistic Variant Detection combines a Bayesian model with a maximum likelihood approach to calculate prior and error probabilities for the Bayesian model. Parameters: Minimum coverage = 40; Maximum expected variant = 3 in cancer, 2 in control; Ignore nonspecific matches = Yes; Require presence in both forward and reverse reads = Yes; Ignore variants in nonspecific match = Yes; variant probability = 90.0; Required variant count = 15 in indels.
Low Frequency Variant Detection Tool
The Low Frequency Variant Detection Tool performs a statistical test at each site to determine whether the nucleotides observed in the reads at that site could be due simply to sequencing errors, or whether they would be significantly better explained by the presence of one or more different alleles present in the sample at unknown frequency. In the latter case, a variant corresponding to the significant allele is called and the frequency is estimated. Parameters: Required significance (%) = 1.0; Ignore broken pairs = Yes; Ignore nonspecific matches = Reads; Minimum coverage = 20; Minimum count = 2; Minimum frequency (%) = 1.0; Base quality filter = Yes; Neighborhood radius = 5; Minimum central quality = 20; Minimum neighborhood quality = 15; Read direction filter = Yes; Direction frequency (%) = 5.0; Read position filter = No; Relative read direction filter = Yes; Significance (%).
Variants called in the lymphocytes or found in the dbSNP 137 database, the HapMap database, or the 1000 Genomes Project were considered to be germline mutations. The remaining mutations were considered somatic mutations.
Somatic Mutation Validation by Sanger Sequencing
In cell-free DNA, primary tumor and matched lymphocytes, Sanger sequencing of nonsynonymous variants identified in both ctDNA and primary tumor was performed to confirm the presence of the somatic mutations identified by the variant detection analysis. Primers were designed using CLC Genomics Workbench 6.5.1 (Supplementary Table 4). PCR was performed in a total volume of 50 μL, consisting of 5 μL of 10x PCR buffer for KOD-Plus-Neo, 0.2 mM of dNTPs, 1.5 mM of MgSO4, 0.3 μM of each primer, 1 μL of the DNA solution, and 1 U/50 μL of KOD-Plus-Neo (Toyobo). The amplification conditions included initial denaturation at 94°C for 2 minutes, followed by 40 cycles of denaturation at 98°C for 10 seconds, annealing at 64°C for 30 seconds, extension at 68 °C for 10 seconds, followed by 5 minutes of final extension at 68°C. The amplified DNA fragments were separated onto a 2% agarose gel and purified using the FastGene Gel/PCR Extraction kit (Nippon Genetics, Tokyo, Japan). Nucleotide sequences were determined using BigDye Terminator v3.1 cycle sequencing kit (Applied Biosystems). Sanger chromatograms were analyzed using CLC Genomics Workbench 6.5.1.
Statistical Analysis
The cumulative incidence of recurrence and extrahepatic metastasis within 2 years and cumulative survival rate after surgery were calculated using the Kaplan-Meier technique, and differences in the curves were tested using the log-rank test. Differences among groups were examined for statistical significance using the Fisher exact test or Pearson chi-square test, as appropriate. The Mann-Whitney U test was used for comparison of AFP levels, DCP levels, tumor size, and tumor numbers. Independent risk factors predicting microscopic vascular invasion of the portal vein (VP) were analyzed using stepwise Cox regression analysis. These analyses were performed using Statistical Package for Social Sciences version 11.0.1J (SPSS/IBM, Chicago, IL). P < .05 was considered statistically significant.
Results
Detection of ctDNA by Polymerase Chain Reaction Immediately Before the Initial Surgery
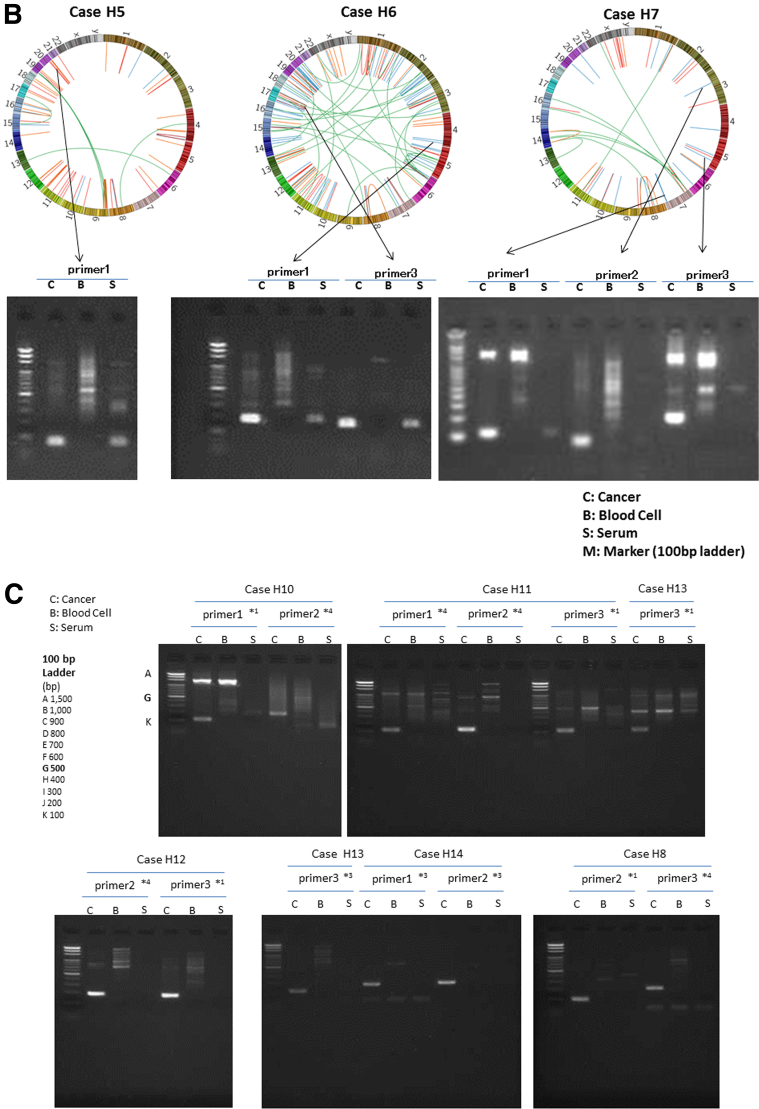
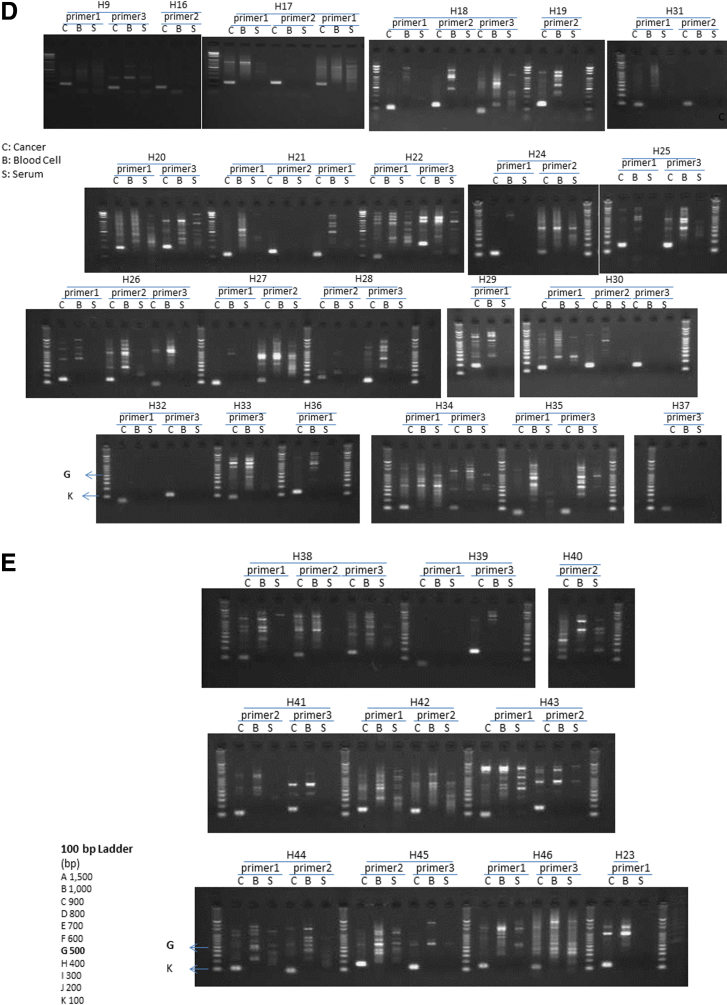
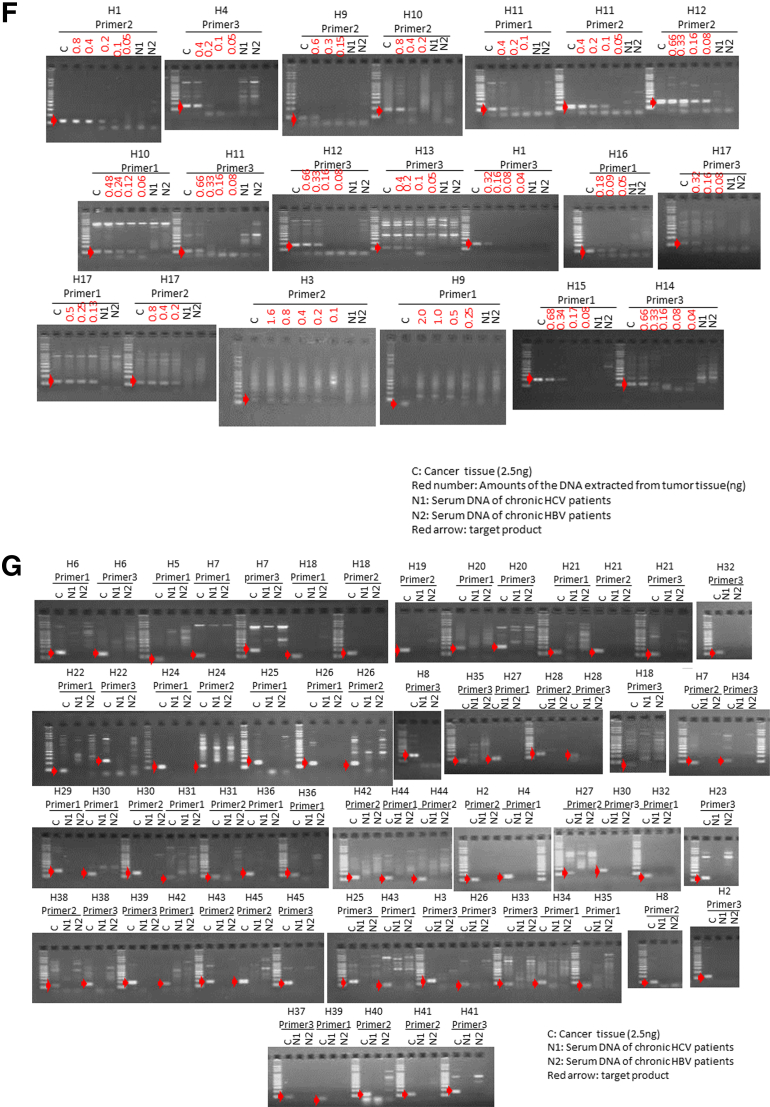
For each of the liver cancer genomes, we selected three somatic rearrangements and designed primers spanning their breakpoints to detect cancer-specific sequences in blood, based on their whole-genome sequencing data. Figure 2 shows the PCR detection of ctDNA in serum cell-free DNA, cancer tissue DNA, and blood-cell DNA as a negative control. We also confirmed that DNA extracted from serum of chronic HCV and HBV patients without HCC was not be amplified by PCR using these primers (see Figure 2F and G). Among 46 patients with somatic rearrangements, ctDNA was detected in seven patients (cases H1, H2, H3, H4, H5, H6, and H7) before the surgery (see Figure 2A and B). The patient baseline characteristics and detection of preoperative ctDNA by PCR are shown in Table 2.
Figure 2.
Detection of circulating tumor DNA (ctDNA) by polymerase chain reaction (PCR) targeting for somatic rearrangements. Gel electrophoresis of PCR products. The ctDNA extracted from preoperative serum samples (S) was amplified by PCR with the use of primers designed to detect breakpoints of somatic rearrangements in each of the tumors (see Supplementary Table 1). DNA extracted from cancer tissue samples was used as a positive control (C), and DNA extracted from blood cells was used as a negative control (B). (A, B) Patients with positive ctDNA. Upper panel: Circos plots of the hepatocellular carcinomas (HCCs) in cases H1–H4 (A) and H5–H7 (B) who tested positive preoperatively for serum ctDNA. Each circle plot represents validated somatic rearrangements in each of the HCCs. Lines show chromosomal translocations (green), deletions (blue), inversions (red), and tandem duplications/translocations (orange). (C–E) Patients with negative ctDNA. (F, G) DNA extracted from serum of chronic hepatitis C (HCV) (N1) and hepatitis B (HBV) (N2) patients without HCC were confirmed not to be amplified by PCR using these primer. Red numbers show the amounts of DNA extracted from tumor tissue. The red arrow shows the target product.
Table 2.
Summary of Clinical Characteristics of Patients
| Characteristic | Status of ctDNA Before Surgery | ctDNA Positive | ctDNA Negative | P Value |
|---|---|---|---|---|
| No. of patients | 46 | 7 | 39 | |
| Age at diagnosis (y) | 67 (32–89) | 68 (51–86) | 67 (32–89) | .426 |
| Gender (M/F) | 35/11 | 5/2 | 30/9 | .541a |
| Etiology (HBV/HCV(SVR)/NBNC) | 11/25 (6)/10 | 1/4(2)/2 | 10/21 (4)/8 | .775b |
| AFP (ng/mL) before surgery | 60.5 (<0.5–57,410) | 10,100 (12.7–57,410) | 15.8 (<5–35330) | .004c |
| DCP (mAU/mL) before surgery | 57.5 (2.6–135,640) | 23,156 (866–135,640) | 37 (2.6–16123) | <.001c |
| Tumor size (mm) | 25.5 (10–140) | 73 (35–140) | 23 (10–125) | <.001c |
| T (1/2/3/4) | 11/18/15/2 | 0/3/3/1 | 11/15/12/1 | |
| T1 T2/T3 T4 | ¾ | 26/13 | .216a | |
| M (0/1/2) | 46/0/0 | 7/0/0 | 39/0/0 | |
| N (0/1/2) | 46/0/0 | 7/0/0 | 39/0/0 | |
| Edmondson grading (I/II/III) | 5/36/5 | 0/6/1 | 5/30/4 | |
| I, II/III | 6/1 | 35/4 | .580a | |
| VP (0/1/2/3); VP (0/1/2/3) | 35/9/1/1 | 3/4/0/0 | 32/5/1/1 | |
| VP 0/1,2,3 | 3/4 | 32/7 | .046a | |
| VV (0/1) | 38/8 | 4/3 | 34/5 | .089a |
| VA (0/1) | 45/1 | 6/1 | 39/0 | .152a |
Note: AFP, α-fetoprotein; DCP, des-γ-carboxy prothrombin; HBV, hepatitis B virus; HCV (SVR), hepatitis C virus sustained virologic response; NBNC, neither HBsAg (+) nor anti-HCV (+); VA, hepatic artery; VP, microscopic vascular invasion to portal vein; VV, hepatic vein.
Fisher exact test.
Pearson chi-square test.
Mann-Whitney U test.
Circos plots20 in Figure 2A and B demonstrate genomewide views of somatic rearrangements in the seven HCC patients who were positive for serum ctDNA. Somatic rearrangements targeted in ctDNA PCR are indicated by arrows. In seven ctDNA-positive patients, the main tumor sizes were statistically significantly larger and the AFP and DCP levels and the rate of VP were statistically significantly higher than in the remaining 39 patients (P = <.001, .004, <.001, and .046, respectively) (see Table 2). The result of the lowest limit of detection assay (Figure 3) suggests that detection is possible if there are at least 10–100 copies of DNA.
Figure 3.
Lowest limit of detection. To confirm the lowest limit of detection, custom synthesized DNA oligos that were diluted from 105 copies to 10 copies with distilled water were amplified by polymerase chain reaction. They remained detectable in any condition when at least 10–100 copies of DNA were present.
Cumulative Incidence of Recurrence, Extrahepatic Metastasis, and Survival Rate
The cumulative incidence of recurrence and extrahepatic metastasis within 2 years after hepatic resection in the ctDNA-positive group and the ctDNA-negative group are illustrated in Figure 4. The cumulative incidence of recurrence and extrahepatic metastasis in the ctDNA-positive group was statistically significantly worse than in the ctDNA-negative group (P = .0102 and .0386, respectively). Although the ctDNA-positive group was expected to have poorer survival than the ctDNA-negative group, there was no statistically significant difference in the cumulative survival rate between the two groups (P = .0730).
Figure 4.
The cumulative incidence of recurrence and extrahepatic metastasis within 2 years after hepatic resection. The cumulative incidence of recurrence (left) and extrahepatic metastasis (right) of the circulating tumor DNA (ctDNA)-positive group (green line) were statistically significantly worse than that of the ctDNA-negative group (red line) (P = .0102 and .0386, respectively).
Independent Risk Factors Predicting Microscopic Vascular Invasion to Portal Vein
Of 46 patients, 11 patients had HCC with VP. Univariate analysis identified the following factors associated with VP before surgery: ctDNA (positive, P = .046), AFP (>100 ng/μL; P = .042), and DCP (>100 IU/mL; P = .042) (Table 3). Of these, multivariate analysis identified the presence of ctDNA (positive: OR 6.10; 95% CI, 1.11–33.33; P = .038) as an independent factor (see Table 3).
Table 3.
Univariate and Multivariate Analyses of Factors Associated With Microscopic Vascular Invasion to Portal Vein
| Status of ctDNA Before Surgery | Univariate analysis |
Multivariate analysis |
||
|---|---|---|---|---|
| OR (95% CI) | P Value | OR (95% CI) | P Value | |
| ctDNA before surgery: positive | 6.10 (1.11–33.33) | .046a | 6.10 (1.11–33.33) | .038b |
| AFP (ng/mL) before surgery: >100 | 4.51 (1.01–20.1) | .042c | ||
| DCP (mAU/mL) before surgery: >100 | 4.51 (1.01–20.1) | .042c | ||
| Tumor size: >50 mm | 2.76 (0.61–12.51) | .175a | ||
Note: AFP, α-fetoprotein; CI, confidence interval; ctDNA, circulating tumor DNA; DCP, des-γ-carboxy prothrombin; OR, odds ratio.
Pearson chi-square test.
Stepwise Cox regression analysis.
Fisher exact test.
Quantification of Circulating Tumor DNA in Serum
The ctDNA was quantified by real-time quantitative PCR in serial serum samples before and after the surgery from the five ctDNA-positive patients. The time courses of ctDNA levels and serum levels of AFP and DCP for these patients are shown in Figure 5 along with treatment information. Overall, the levels of serum ctDNA increased with disease progression and responded to the treatments.
Case H1 (see Figure 5A) had multiple tumor lesions that were resected for down-staging. The patient underwent HAIC (hepatic arterial infusion chemotherapy) with low-dose FP (5-fluorouracil + platinum) therapy, TACE (transcatheter arterial chemoembolization), and 5FU-IFN (5-fluorouracil + interferon) treatment. The patient showed stable disease for 1 year after surgery but developed bone metastasis 13 months after surgery. It is notable that ctDNA quantified using primer 2 in sera were still positive at this time point even though both serum AFP and DCP were negative after the tumor resection. The patient then underwent a combination of systemic chemotherapy and TACE, which suppressed tumor progression until 25 months after the surgery. The patient had progressive disease thereafter and died 40 months after surgery. The ctDNA levels decreased during the period of stable disease but were detectable throughout the observation period and increased during the period of progressive disease.
Case H2 (see Figure 5B) had multiple tumor lesions in the right lobe that were removed by curative resection. The patient underwent TACE 1 month before surgery, and underwent HAIC with low-dose FP (5-fluorouracil + platinum) as adjuvant therapy, showing no recurrence until imaging detected multiple intrahepatic recurrences 11 months after surgery. Even though serum AFP and DCP levels had became negative 3 and 5 months after the curative resection, ctDNA was detected throughout the observation. Although the patient underwent TACE, intrahepatic, lung, and peritoneal metastases appeared. The serum ctDNA increased with the AFP and DCP, along with the disease progression.
Case H3 (see Figure 5C) had multiple tumor lesions in the right lobe that were curatively resected. The patient underwent TACE 1 week before surgery. Serum ctDNA levels decreased along with AFP and DCP after surgery. Although the DCP level became negative, AFP and ctDNA were detected throughout the observation period. After the appearance of multiple intrahepatic recurrences, TACE failed to suppress the progression. Interestingly, DCP decreased after subsequent 5FU-IFN (5-fluorouracil + interferon) treatment and TACE along with ctDNA, but AFP did not. All three markers increased at final worsening.
Case H4 (see Figure 5D) had one HCC lesion that was treated with TACE 1 month before surgery. The patient underwent HAIC as adjuvant therapy. Metastasis to the lung was detected by imaging 4 months after surgery. Accordingly, HAIC was switched to systemic chemotherapy and bronchial arterial embolization. Although the ctDNA quantified using primer 1 decreased after surgery but never became negative and rebounded with disease progression, the ctDNA quantified using primer 3 decreased after surgery and maintained a negative result even during the period of progressive disease.
Case H5 (see Figure 5E) had a 10-cm HCC in the right lobe that was removed by partial hepatectomy. The patient underwent TACE 2 weeks before surgery. The HCC was the poorly > moderately differentiated type with microscopic vascular invasion. This patient had not developed a recurrence more than 3 years after surgery.
Serum ctDNA Dynamics After TACE
Of the seven patients who tested positive for ctDNA, six received TACE before surgery. Serial serum samples at 1, 4, and 6 days after TACE were available in cases H2 and H3. Figure 6A shows the ctDNA dynamics of ctDNA quantitation after TACE in these two patients. The ctDNA levels of cases H2 and H3 increased 5- and 10-fold compared with pre-TACE levels and peaked 4 days after TACE. We investigated whether ctDNA after TACE could be detected in three patients (cases H8, H9, and H15) 4 days after TACE, and we were able to detect it in two patients, cases H8 and H9 (see Figure 6B).
Figure 6.
Circulating tumor DNA (ctDNA) dynamics after undergoing transcatheter arterial chemoembolization (TACE). (A) Serum ctDNA levels at 1, 4, and 6 days after TACE are shown as a solid line, and serum aminotransferase (AST) and alanine aminotransferase (ALT) levels are shown as dotted lines. The x-axis shows the number of days after TACE. The y-axis on the left indicates the fold change of serum ctDNA levels compared with that before TACE, and the y-axis on the right indicates serum AST, ALT, AFP (α-fetoprotein), and des-γ-carboxy prothrombin (DCP) levels. The ctDNA levels of cases 2 and 3 increased 5- and 10-fold compared with before TACE, respectively. The ctDNA levels peaked 4 days after TACE was performed. (B) The ctDNA became detectable 4 days after TACE (S2) in two of three patients (cases H8 and H9) who were negative for ctDNA before TACE (S1). DNA extracted from cancer tissue samples was used as a positive control (C), and DNA extracted from blood cells were used as a negative control (B).
Exome Sequencing of Cell-Free DNA as a Liquid Biopsy
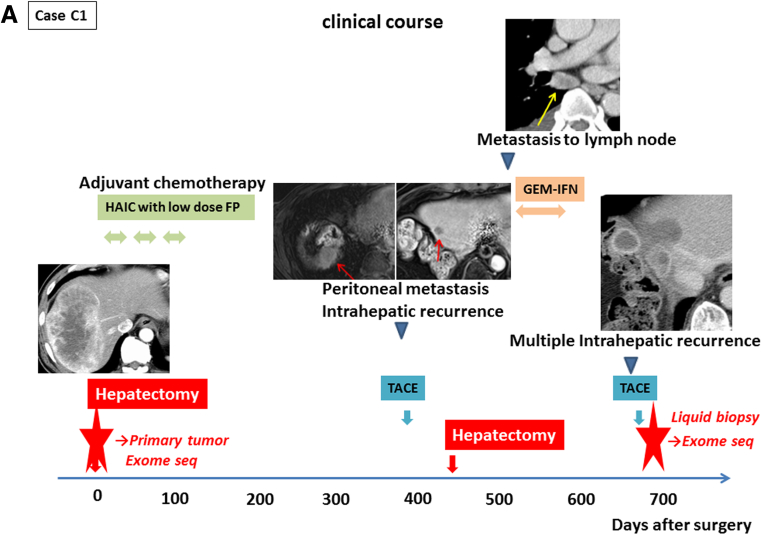
To explore the potential of cell-free DNA sequencing as a diagnostic tool, we performed exome sequencing of primary tumor tissue DNA, leukocyte DNA, and cell-free DNA from one patient (case C1) who was treated with TACE for intrahepatic metastasis of cHCC/CC. The clinical course of case C1 is shown in Figure 7A. One cHCC/CC lesion was resected in the right lobe, and the patient underwent HAIC as adjuvant therapy, but peritoneal metastasis and intrahepatic recurrence appeared 13 months after the surgery. Although the patient underwent TACE, partial hepatectomy with diaphragm resection, and systemic GEM-IFN (gemcitabine + interferon) treatment, multiple intrahepatic recurrences appeared 2 years after the first surgery. Pathologic review indicated that the resected tumors were a recurrence of the previously resected cHCC/CC. TACE was performed for those intrahepatic recurrent lesions, and we obtained blood serially on the time course after TACE and extracted cell-free DNA from these plasma samples.
Figure 7.
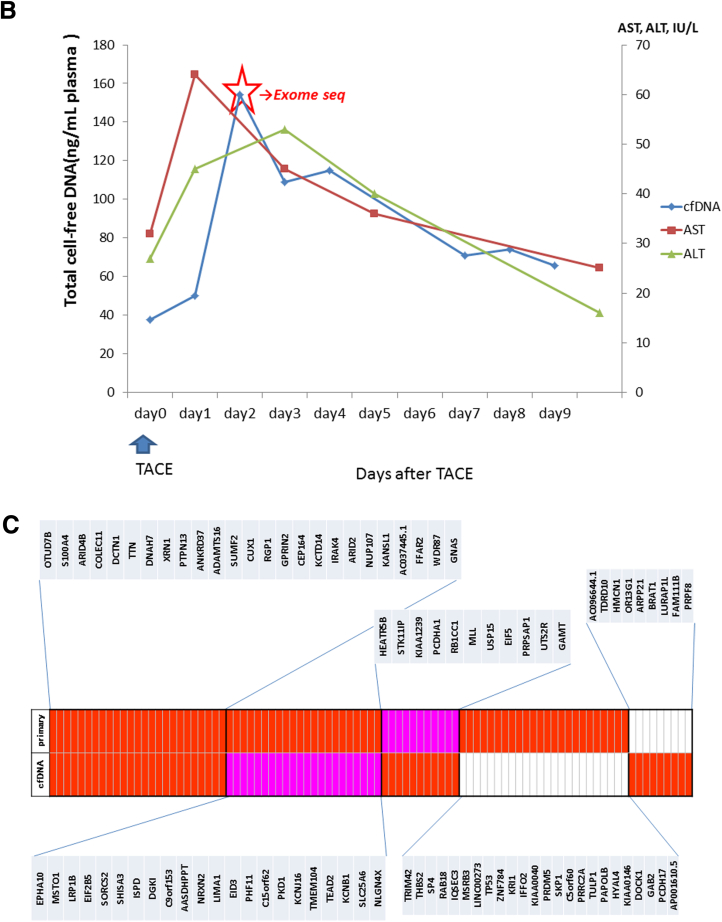
Exome sequencing of primary tumor and cell-free DNA. (A) The clinical course of case C1. Case C1 had one combined hepatocellular and cholangiocarcinoma (cHCC/CC) lesion in the right lobe that was removed by curative resection. Transcatheter arterial chemoembolization (TACE) was performed for intrahepatic recurrent lesions 2 years after the first surgery. We performed exome sequencing of cell-free DNA after the TACE and the primary tumor (red star). (B) The amount of total cell-free DNA extracted from the plasma samples serially obtained after TACE. Cell-free DNA was most abundant in plasma 2 days after TACE, and was therefore used for exome sequencing analysis. (C) Common mutations in cell-free DNA and primary tumor. Somatic mutations detected by probabilistic variant detection and low frequency variant detection are indicated by the red and pink boxes, respectively.
The amount of the total cell-free DNA obtained at each time point for case C1 is shown in Figure 7B. The cell-free DNA was most abundant in plasma on day 2 after TACE, and this sample was analyzed by exome sequencing to identify somatic mutation candidates in the tumor. We also performed exome sequencing of the primary resected tissue sample of this patient and compared the somatic mutational profiles. Comparing with exome sequencing data of the leukocyte DNA, we identified 45 nonsynonymous somatic mutations in the cell-free DNA and 71 nonsynonymous somatic mutations in the primary tumor tissue using the Probabilistic Variant Detection Tool. Among them, 25 mutations were detected in both the cell-free DNA and the primary resected sample (Supplementary Table 5).
Subsequently we reanalyzed the mutations that were detected either in primary tumor tissue or cell-free DNA using the Low Frequency Variant Detection Tool. We found that 22 of 46 variants that had not been detected in cell-free DNA but had been detected in primary tumor tissue using the Probabilistic Variant Detection Tool were detected by the Low Frequency Variant Detection Tool (see Figure 5C). Combining these results, 58 of 91 somatic mutations (64%) were commonly detected in both cell-free DNA and primary tumor tissue.
Discussion
In this study we successfully quantified ctDNA using 100-μL serum samples. The levels of ctDNA reflected the effect of therapy and the progression of the cancer, as previously reported elsewhere.5, 6, 13, 14, 15 Measurement of ctDNA provided important clinical information. Of the seven patients who tested positive for ctDNA before surgical resection, six patients developed recurrence, and four developed extrahepatic metastases (see Figure 4). Furthermore, in one patient (case H1) ctDNA was still positive even when both AFP and DCP became negative or fell below the threshold after curative resection (see Figure 5A). This suggests that, in some patients, ctDNA might be a better and more sensitive biomarker for HCC than the conventional tumor markers AFP and DCP in predicting recurrence and determining the necessity of further chemotherapy.
We also showed that the TACE procedure actually increased or enriched ctDNA levels in cell-free DNA in blood. This increase might result from a large release of tumor DNA from cancer tissue damaged by TACE. Thus, when we routinely perform TAE or TACE during diagnostic angiography for HCC, we can obtain a larger amount of tumor-derived DNA from blood and analyze mutational profiles of liver cancers as a liquid biopsy.
In this study we also demonstrated the potential usefulness of exome sequencing of cell-free DNA. We used plasma samples for exome sequencing instead of serum samples because serum is likely to contain a higher concentration of normal cell-free nucleic acids, produced from normal nucleated cells during clotting,21 which would reduce the relative frequency of tumor-derived mutant alleles and make them more difficult to detect. We detected 25 common somatic mutations identified in cell-free DNA and primary tissue that had been resected 2 years previously (see Figure 7C). Fujimoto et al19 indicated that no common somatic mutations were identified in whole genomic regions of the two pairs of multicentric tumors. Our results suggest that the patients had recurrence but not multicentric tumors.
The Low Frequency Variant Detection Tool detected 22 of 46 variants in primary tumor tissue that had not been detected in cell-free DNA. This finding suggests that it might be better to perform deeper sequencing and to detect low frequency variants when analyzing cell-free DNA. The allele frequency ratio (cell-free DNA/primary tumor tissue) was calculated to estimate the proportion of ctDNA to total cell-free DNA. The median allele frequency ratio was 0.79, and the average mutant allele frequency in cell-free DNA was 22% in this study.
Recent studies of cell-free DNA using ultra-deep sequencing have found that mutant reads of cell-free DNA varied between <0.1% to 38.4% but were mostly less than 5%.22, 23 These results support the hypothesis that the proportion of ctDNA to the total cell-free DNA can be enriched by the TACE procedure.
A potential reason for the remaining discrepancy is tumor heterogeneity. When tumor tissue sampling was performed, it is unlikely that the majority of dominant clones were captured. Another explanation might be molecular evolution from the primary tumor to recurrent tumors due to selection pressure over the course of several therapies.
Although further work is required to improve the analysis pipeline, we conclude that genome sequencing analysis of cell-free DNA in plasma after TACE and other embolic procedures are performed is a promising method of genome scanning. In particular, analyzing cell-free DNA after TACE in unresectable and recurrent cases as a liquid biopsy to establish cancer genome profiles might be useful in the future to guide selection of an individualized therapeutic regimen without requiring percutaneous biopsy. For example, in case C1 we detected a GNAS E130G mutation by cell-free sequence analysis, suggesting that the recurrent tumors might respond to a mitogen-activated protein kinase kinase inhibitor.24
Two phase III randomized clinical trials have shown that sorafenib, a multitargeted tyrosine kinase inhibitor, improves the overall survival of patients with advanced HCC.25, 26 Many other targeted agents that specifically block tumor-associated signaling pathways using either small molecular compounds or humanized monoclonal antibodies to inhibit angiogenesis and tumor growth are being developed and tested in HCC.27, 28, 29, 30, 31, 32, 33, 34, 35, 36, 37 However, resistance is also likely to become a problem with these drugs. Analysis of ctDNA/cell-free DNA could be a useful tool in selecting the best targeted agents in individual cases and as a guide to switching targeted agents when resistance develops.
Interestingly, in case H4 the ctDNA dynamics varied greatly depending on the primer set, each of which targeted a different somatic rearrangement. This result suggests that monitoring mutation profiles may be a useful method to reveal the mechanism of the resistance.
In summary, we detected ctDNA in serum samples of patients with advanced HCC and showed the usefulness of ctDNA as a biomarker. We also demonstrated the potential usefulness of exome sequencing of the cell-free DNA from plasma after TACE. As we were only able to analyze a relatively small number of cases due to the difficulty of obtaining samples, additional validation should be performed. We also concede that some cases remain undetected due to low sensitivity because the lower limit of detection assays were not identical among all primer sets. Further study is necessary to develop more sensitive, simple, and cost effective measures and more robust analysis pipelines to improve the efficacy of therapy against advanced HCC.
Footnotes
Conflicts of interest The authors disclose no conflicts.
Funding This study was funded by grants-in-aid for scientific research and development from the Ministry of Health, Labor and Welfare and Ministry of Education Culture Sports Science and Technology, Government of Japan. This work was also supported partially by RIKEN President’s Fund 2011, the Princess Takamatsu Cancer Research Fund, and Takeda Science Foundation. The supercomputing resource “SHIROKANE” was provided by Human Genome Center, University of Tokyo (http://sc.hgc.jp/shirokane.html). The funders had no role in study design, data collection and analysis, decision to publish, or preparation of the manuscript. No additional external funding was received for this study.
Contributor Information
Hidewaki Nakagawa, Email: hidewaki@ims.u-tokyo.ac.jp.
Kazuaki Chayama, Email: chayama@hiroshima-u.ac.jp.
Supplementary Material
References
- 1.Paez J.G., Janne P.A., Lee J.C. EGFR mutations in lung cancer: correlation with clinical response to gefitinib therapy. Science. 2004;304:1497–1500. doi: 10.1126/science.1099314. [DOI] [PubMed] [Google Scholar]
- 2.Lynch T.J., Bell D.W., Sordella R. Activating mutations in the epidermal growth factor receptor underlying responsiveness of non-small-cell lung cancer to gefitinib. N Engl J Med. 2004;350:2129–2139. doi: 10.1056/NEJMoa040938. [DOI] [PubMed] [Google Scholar]
- 3.Karapetis C.S., Khambata-Ford S., Jonker D.J. K-ras mutations and benefit from cetuximab in advanced colorectal cancer. N Engl J Med. 2008;359:1757–1765. doi: 10.1056/NEJMoa0804385. [DOI] [PubMed] [Google Scholar]
- 4.Heinrich M.C., Corless C.L., Demetri G.D. Kinase mutations and imatinib response in patients with metastatic gastrointestinal stromal tumor. J Clin Oncol. 2003;21:4342–4349. doi: 10.1200/JCO.2003.04.190. [DOI] [PubMed] [Google Scholar]
- 5.Dawson S.J., Tsui D.W., Murtaza M. Analysis of circulating tumor DNA to monitor metastatic breast cancer. N Engl J Med. 2013;368:1199–1209. doi: 10.1056/NEJMoa1213261. [DOI] [PubMed] [Google Scholar]
- 6.Murtaza M., Dawson S.J., Tsui D.W. Non-invasive analysis of acquired resistance to cancer therapy by sequencing of plasma DNA. Nature. 2013;497:108–112. doi: 10.1038/nature12065. [DOI] [PubMed] [Google Scholar]
- 7.Bruix J., Sherman M. American Association for the Study of Liver D. Management of hepatocellular carcinoma: an update. Hepatology. 2011;53:1020–1022. doi: 10.1002/hep.24199. [DOI] [PMC free article] [PubMed] [Google Scholar]
- 8.Bruix J., Sherman M. Practice Guidelines Committee AAftSoLD. Management of hepatocellular carcinoma. Hepatology. 2005;42:1208–1236. doi: 10.1002/hep.20933. [DOI] [PubMed] [Google Scholar]
- 9.Schwarzenbach H., Hoon D.S., Pantel K. Cell-free nucleic acids as biomarkers in cancer patients. Nat Rev Cancer. 2011;11:426–437. doi: 10.1038/nrc3066. [DOI] [PubMed] [Google Scholar]
- 10.Gormally E., Caboux E., Vineis P. Circulating free DNA in plasma or serum as biomarker of carcinogenesis: practical aspects and biological significance. Mutat Res. 2007;635:105–117. doi: 10.1016/j.mrrev.2006.11.002. [DOI] [PubMed] [Google Scholar]
- 11.Castells A., Puig P., Mora J. K-ras mutations in DNA extracted from the plasma of patients with pancreatic carcinoma: diagnostic utility and prognostic significance. J Clin Oncol. 1999;17:578–584. doi: 10.1200/JCO.1999.17.2.578. [DOI] [PubMed] [Google Scholar]
- 12.Sorenson G.D. Detection of mutated KRAS2 sequences as tumor markers in plasma/serum of patients with gastrointestinal cancer. Clin Cancer Res. 2000;6:2129–2137. [PubMed] [Google Scholar]
- 13.Diaz L.A., Jr., Williams R.T., Wu J. The molecular evolution of acquired resistance to targeted EGFR blockade in colorectal cancers. Nature. 2012;486:537–540. doi: 10.1038/nature11219. [DOI] [PMC free article] [PubMed] [Google Scholar]
- 14.Diehl F., Schmidt K., Choti M.A. Circulating mutant DNA to assess tumor dynamics. Nat Med. 2008;14:985–990. doi: 10.1038/nm.1789. [DOI] [PMC free article] [PubMed] [Google Scholar]
- 15.Yung T.K., Chan K.C., Mok T.S. Single-molecule detection of epidermal growth factor receptor mutations in plasma by microfluidics digital PCR in non-small cell lung cancer patients. Clin Cancer Res. 2009;15:2076–2084. doi: 10.1158/1078-0432.CCR-08-2622. [DOI] [PubMed] [Google Scholar]
- 16.Chan K.C., Jiang P., Zheng Y.W. Cancer genome scanning in plasma: detection of tumor-associated copy number aberrations, single-nucleotide variants, and tumoral heterogeneity by massively parallel sequencing. Clin Chem. 2013;59:211–224. doi: 10.1373/clinchem.2012.196014. [DOI] [PubMed] [Google Scholar]
- 17.Leary R.J., Sausen M., Kinde I. Detection of chromosomal alterations in the circulation of cancer patients with whole-genome sequencing. Sci Transl Med. 2012;4:162ra154. doi: 10.1126/scitranslmed.3004742. [DOI] [PMC free article] [PubMed] [Google Scholar]
- 18.Li H., Durbin R. Fast and accurate short read alignment with Burrows-Wheeler transform. Bioinformatics. 2009;25:1754–1760. doi: 10.1093/bioinformatics/btp324. [DOI] [PMC free article] [PubMed] [Google Scholar]
- 19.Fujimoto A., Totoki Y., Abe T. Whole-genome sequencing of liver cancers identifies etiological influences on mutation patterns and recurrent mutations in chromatin regulators. Nat Genet. 2012;44:760–764. doi: 10.1038/ng.2291. [DOI] [PubMed] [Google Scholar]
- 20.Krzywinski M., Schein J., Birol I. Circos: an information aesthetic for comparative genomics. Genome Res. 2009;19:1639–1645. doi: 10.1101/gr.092759.109. [DOI] [PMC free article] [PubMed] [Google Scholar]
- 21.Vallee A., Marcq M., Bizieux A. Plasma is a better source of tumor-derived circulating cell-free DNA than serum for the detection of EGFR alterations in lung tumor patients. Lung Cancer. 2013;82:373–374. doi: 10.1016/j.lungcan.2013.08.014. [DOI] [PubMed] [Google Scholar]
- 22.Metz C.H., Scheulen M., Bornfeld N. Ultradeep sequencing detects GNAQ and GNA11 mutations in cell-free DNA from plasma of patients with uveal melanoma. Cancer Med. 2013;2:208–215. doi: 10.1002/cam4.61. [DOI] [PMC free article] [PubMed] [Google Scholar]
- 23.Newman A.M., Bratman S.V., To J. An ultrasensitive method for quantitating circulating tumor DNA with broad patient coverage. Nat Med. 2014;20:548–554. doi: 10.1038/nm.3519. [DOI] [PMC free article] [PubMed] [Google Scholar]
- 24.Wilson C.H., McIntyre R.E., Arends M.J. The activating mutation R201C in GNAS promotes intestinal tumourigenesis in ApcMin/+ mice through activation of Wnt and ERK1/2 MAPK pathways. Oncogene. 2010;29:4567–4575. doi: 10.1038/onc.2010.202. [DOI] [PMC free article] [PubMed] [Google Scholar]
- 25.Cheng A.L., Kang Y.K., Chen Z. Efficacy and safety of sorafenib in patients in the Asia-Pacific region with advanced hepatocellular carcinoma: a phase III randomised, double-blind, placebo-controlled trial. Lancet Oncol. 2009;10:25–34. doi: 10.1016/S1470-2045(08)70285-7. [DOI] [PubMed] [Google Scholar]
- 26.Llovet J.M., Ricci S., Mazzaferro V. Sorafenib in advanced hepatocellular carcinoma. N Engl J Med. 2008;359:378–390. doi: 10.1056/NEJMoa0708857. [DOI] [PubMed] [Google Scholar]
- 27.Chan S.L., Yeo W. Targeted therapy of hepatocellular carcinoma: present and future. J Gastroenterol Hepatol. 2012;27:862–872. doi: 10.1111/j.1440-1746.2012.07096.x. [DOI] [PubMed] [Google Scholar]
- 28.Wei Z., Doria C., Liu Y. Targeted therapies in the treatment of advanced hepatocellular carcinoma. Clin Med Insights Oncol. 2013;7:87–102. doi: 10.4137/CMO.S7633. [DOI] [PMC free article] [PubMed] [Google Scholar]
- 29.Santoro A., Rimassa L., Borbath I. Tivantinib for second-line treatment of advanced hepatocellular carcinoma: a randomised, placebo-controlled phase 2 study. Lancet Oncol. 2013;14:55–63. doi: 10.1016/S1470-2045(12)70490-4. [DOI] [PubMed] [Google Scholar]
- 30.Faivre S., Raymond E., Boucher E. Safety and efficacy of sunitinib in patients with advanced hepatocellular carcinoma: an open-label, multicentre, phase II study. Lancet Oncol. 2009;10:794–800. doi: 10.1016/S1470-2045(09)70171-8. [DOI] [PubMed] [Google Scholar]
- 31.Thomas M.B., Morris J.S., Chadha R. Phase II trial of the combination of bevacizumab and erlotinib in patients who have advanced hepatocellular carcinoma. J Clin Oncol. 2009;27:843–850. doi: 10.1200/JCO.2008.18.3301. [DOI] [PubMed] [Google Scholar]
- 32.Siegel A.B., Cohen E.I., Ocean A. Phase II trial evaluating the clinical and biologic effects of bevacizumab in unresectable hepatocellular carcinoma. J Clin Oncol. 2008;26:2992–2998. doi: 10.1200/JCO.2007.15.9947. [DOI] [PMC free article] [PubMed] [Google Scholar]
- 33.Zhu A.X., Blaszkowsky L.S., Ryan D.P. Phase II study of gemcitabine and oxaliplatin in combination with bevacizumab in patients with advanced hepatocellular carcinoma. J Clin Oncol. 2006;24:1898–1903. doi: 10.1200/JCO.2005.04.9130. [DOI] [PubMed] [Google Scholar]
- 34.Kanai F., Yoshida H., Tateishi R. A phase I/II trial of the oral antiangiogenic agent TSU-68 in patients with advanced hepatocellular carcinoma. Cancer Chemother Pharmacol. 2011;67:315–324. doi: 10.1007/s00280-010-1320-2. [DOI] [PubMed] [Google Scholar]
- 35.Philip P.A., Mahoney M.R., Holen K.D. Phase 2 study of bevacizumab plus erlotinib in patients with advanced hepatocellular cancer. Cancer. 2012;118:2424–2430. doi: 10.1002/cncr.26556. [DOI] [PMC free article] [PubMed] [Google Scholar]
- 36.Zhu A.X., Sahani D.V., Duda D.G. Efficacy, safety, and potential biomarkers of sunitinib monotherapy in advanced hepatocellular carcinoma: a phase II study. J Clin Oncol. 2009;27:3027–3035. doi: 10.1200/JCO.2008.20.9908. [DOI] [PMC free article] [PubMed] [Google Scholar]
- 37.Hsu C.H., Yang T.S., Hsu C. Efficacy and tolerability of bevacizumab plus capecitabine as first-line therapy in patients with advanced hepatocellular carcinoma. Br J Cancer. 2010;102:981–986. doi: 10.1038/sj.bjc.6605580. [DOI] [PMC free article] [PubMed] [Google Scholar]
Associated Data
This section collects any data citations, data availability statements, or supplementary materials included in this article.


