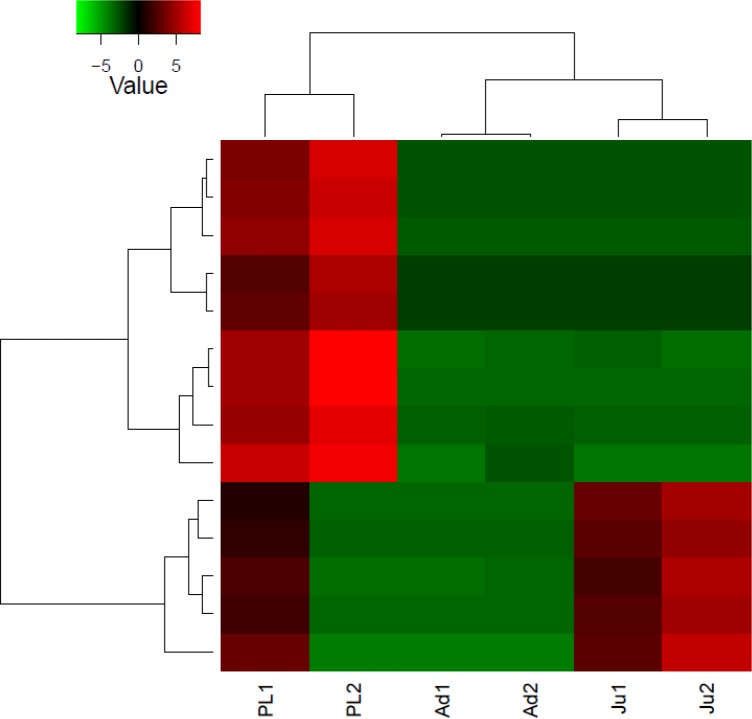
Figure 3. Heatmap showing hierarchical clustering of differentially expressed transcripts (rows) in each sample (column).
The red colored transcripts are upregulated while the green colored are the downregulated transcripts. PL1, post larvae 1; PL2, post larvae 2; Ju1, juvenile 1; Ju2, juvenile 2; Ad1, adult 1 and Ad2, adult 2.

