Abstract
Aided by advances in optical engineering, two-dimensional infrared spectroscopy (2D IR) has developed into a promising method for probing structural dynamics in biophysics and material science. We report two new advances for 2D IR spectrometers. First, we report a fully reflective and totally horizontal pulse shaper, which significantly simplifies alignment. Second, we demonstrate the applicability of mid-IR focal plane arrays (FPAs) as suitable detectors in 2D IR experiments. FPAs have more pixels than conventional linear arrays and can be used to multiplex optical detection. We simultaneously measure the spectra of a reference beam, which improves the signal-to-noise by a factor of 4; and two additional beams that are orthogonally polarized probe pulses for 2D IR anisotropy experiments.
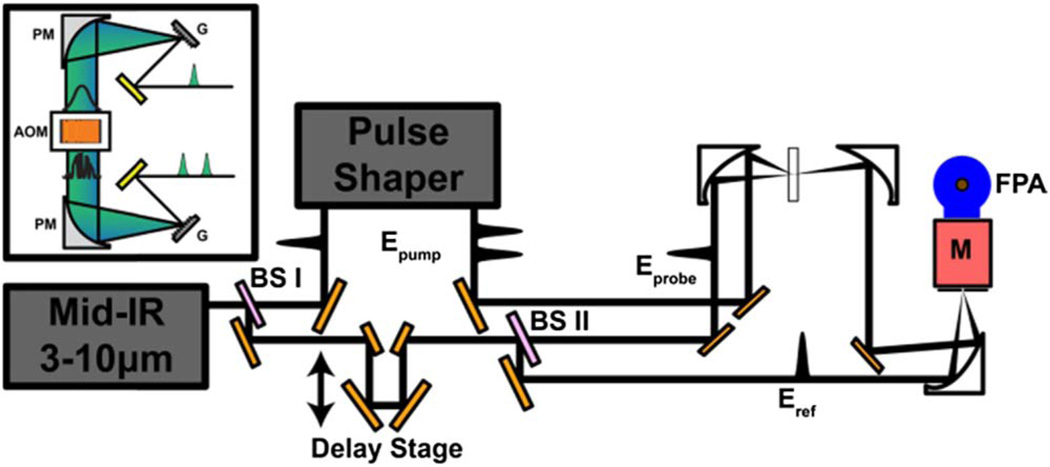
2D IR spectroscopy has successfully addressed a myriad of challenges in biophysics and materials sciences, from measuring the conformations and dynamics of proteins [1–6] and amyloid fibrils [7] to revealing excitonic structures of dye monolayers that have implications in solar cell design [8]. There are many optical designs of 2D IR spectrometers, but all require three interactions between the laser pulses and the molecules. A convenient spectrometer design uses a pump–probe beam geometry, as shown in Fig. 1, with two laser pulses collinearly aligned to serve as the “pump” pulses and a third pulse that “probes” the system by both generating the third order electric field and heterodyning the signal [9,10]. The pulse pairs needed in the pump–probe geometry are well suited for pulse shaper technology, which has been used to collect both 2D IR and 2D visible spectra [11–13]. Pulse shapers eliminate the need for slow and inaccurate mechanical stages [14]; allow removal of scattered light [15,16] and shot-to-shot modulation of time delays; and offer extremely good phase stability with the ability to computer design custom pulse sequences [14,17,18]. The spectrum of the probe pulse is typically measured on a linear mercury cadmium telluride (MCT) array.
Fig. 1.
Schematic layout of the pulse shaper (inset) and optical setup for reference detection. PM, parabolic mirror; G, grating; BS, beamsplitter; M, monochromator.
Because mid-IR light is invisible to the naked eye, it is important that the design of mid-IR pulse shapers allows simple optical alignment and easy frequency tunability. The first mid-IR pulse shaper used a standard 4f design from visible pulse shapers with cylindrical mirrors and a change in beam height [19]. All reflective optics is a good choice for mid-IR light because the focal lengths are wavelength independent, but changing beam heights is difficult with invisible light. A second-generation shaper replaced the cylindrical mirrors with lenses to have a horizontal layout, which was an improvement on alignment, but changing wavelengths required reoptimizing the 4f distances. Herein we report our third-generation shaper that has both a horizontal design and completely reflective optics, made possible by using 1D parabolic mirrors in the 4f geometry. To the best of our knowledge, a 4f design using parabolic focusing optics has not been previously reported. We initially tried using 2D parabolic mirrors, but it was difficult to obtain a properly focused beam after the shaper. The cylindrical parabolic mirrors used are easy to align for proper focusing. The shaper is easy to align and the focal lengths are independent of wavelength. Because this design is fully reflective, it can be readily extended to visible pulse shapers as well.
Detecting the probe pulse is also a crucial step in spectrometer design. Probe pulses can be upconverted and measured in the visible [20], measured in the time-domain with a single pixel MCT detector [21], or its spectrum can be measured with a linear 32- or 64-element MCT array, which is the most common choice. In this Letter, we report data collection using a focal plane array (FPA) detector, which operates like a charge-coupled device camera but for mid-IR light. FPA detectors are often used in Fourier transform IR (FTIR) microscopes for imaging [22]. Over the past few years, FPA detectors that have become commercially available have a large number of pixels (128 × 128) with fast readout times that should also make them compatible with pulsed lasers used in ultrafast spectroscopy. We show that the signal-to-noise of 2D IR spectra collected with an FPA detector is as good as data collection with a linear array, but the larger number of pixels produces better data, reference detection is easy to implement, and multiple probe beams can be simultaneously monitored for faster data collection.
A schematic layout of our experimental apparatus is shown in Fig. 1. The general procedure for generating shaped mid-IR pulses for 2D IR has been described before in detail [14]. For the experiments reported here, the output of a regeneratively amplified Ti:sapphire laser is used to pump an optical parametric amplifier followed by AgGaS2 difference frequency generation module to produce ~20 µJ/pulse of mid-IR light centered at 5 µm. A ZnSe beamsplitter is used to split the mid-IR pulse into pump and probe paths; about 90% of the light is sent through the mid-IR pulse shaper, which generates the pump pulse pair. The pulse shaper consists of 5 optics: two gratings, two 1D parabolic mirrors, and a Ge acoustooptic modulator (see Fig. 1). The output efficiency is still mainly limited by the efficiency of the acousto-optic modulator and gratings, which is about 30%. The frequency resolution of the shaper and all other characteristics is the same as that previously reported because the focal lengths are the same. We see no degradation in mode quality from the parabolic mirrors. Regarding the probe light, the remaining 10% is further split into two with a 50–50 ZnSe beamsplitter to generate the probe and reference beams. The pump and probe beams are focused onto the sample using off-axis parabolic mirrors, and the self-heterodyned signal is re-collimated using a second matched parabolic mirror. The signal and the reference beams are focused onto the entrance slit of a homebuilt astigmatism-corrected Czerny–Turner monochromator [23] with an off-axis parabolic mirror so that they are vertically offset by ~2 mm. When multiple polarized probe pulses are measured, additional optics are added as described below. The dispersed signal and reference beams from the monochromator are detected with a 128 × 128 MCT mid-IR FPA (Teledyne Novasensors). The 40 µm pixel size of the FPA required a diffraction grating groove density of 30 grooves/mm so as to optimally fit the bandwidth of the mid-IR light, yielding a resolution of Δν̄ = 3 cm−1 at 5 µm. Experiments were carried out with a probe intensity at about half the saturation level, which is the same laser power to within a factor of 2 on the FPA and linear arrays. The FPA does have some dead pixels; for the experiments reported here, the beams were aligned and the vertical positioning of FPA was chosen such that the dead pixels were avoided. The FPA was read out at the repetition rate of the laser (1 kHz), using a frame-grabber (Teledyne Dalsa Xcelera-CL LX1 Base). Several models of FPA and frame grabbers are commercially available. For the experiments reported here, the frame grabber has a resolution of 16 bits/pixel and the FPA analog-to-digital converter has a bit resolution of 14 bits/pixel (16 bits/pixel will be available soon). For the model used to collect the data reported here, this resolution implies a nominal minimum delta-OD of −log10[(214 − 1)/214], which is ~2.6e − 5OD or 26 µOD. A 4-frame phase cycling scheme was implemented during data acquisition, where the phases of the two pump pulses are switched between 0 and π to subtract scattered light [24]. The signal is then given by
| (1) |
where φ1 and φ2 are the phases of the two pump pulses, controlled by the pulse shaper; t1 is the delay between the pump pulses, called the coherence time; and T is the delay between pump and probe pulses, called the waiting time [24]. The frame grabber was triggered by the pulse shaper for an N frame acquisition, where N = 4 × Number of t1-times × Number of shots per t1-time. The size of one raw frame is ~33 KB, so the number of frames that can be acquired per trigger is limited only by the available memory buffer size. The N frames were written directly to memory buffer, averaged, and saved, after which the frame-grabber triggered again. This procedure resulted in a loss of less than 5% of laser shots during the processing of the frames and allowed for indefinite data acquisition without filling up the memory buffer. For comparison purposes, measurements were also performed using an MCT line array (1 × 32, Infrared Associates) after dispersing through a monochromator (Princeton Instruments, 75 grooves/mm, Δν̄ = 6 cm−1). The coherence time, t1, was scanned from 0 to 4 ps in steps of 50 fs. Data was acquired in a partially rotating frame, with the rotating frame frequency set to 1940 cm−1 [24]. To quantitatively evaluate the signal to noise enhancements from referencing, two samples were used: NaN3 in D2O, and W(CO)6 in n-hexane. The concentration of both samples was chosen such that the pump–probe ΔOD was ~15 × 10−3. For reference corrected spectra, the signal for every laser shot was normalized as
| (2) |
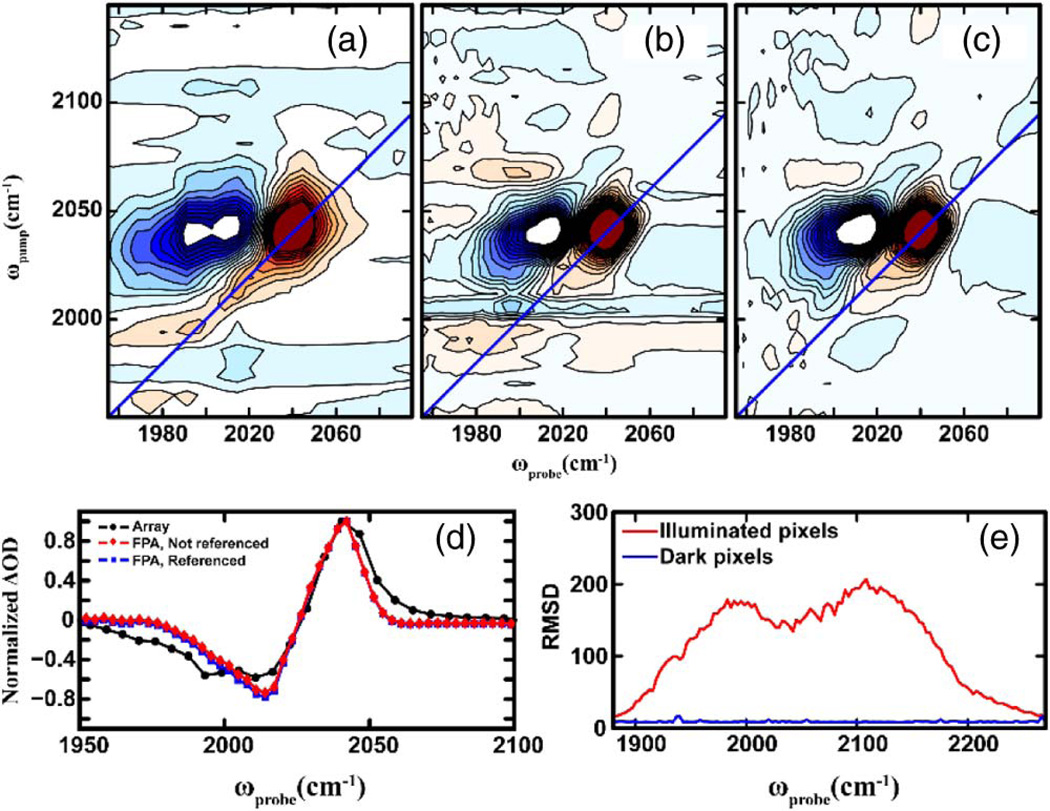
Figure 2 shows a comparison of 2D IR spectra of NaN3 in D2O, collected with a (a) regular line array, (b) without, and (c) with reference correction on the FPA. All spectra were collected at waiting time T = 0. For each spectrum, 400 laser shots were averaged for each t1 time-point. Horizontal slices parallel to the probe frequency axis of the 2D spectra are shown in Fig. 2(d). The comparison of the spectra collected with a linear array and the FPA [Figs. 2(a) and 2(b)] clearly illustrates that the FPA can serve as an effective detector for 2D IR. The number of pixels affects the quality and possibly the scientific interpretation of the data; for a given spectral range, the FPA allows for better sampling of the spectrum by having more than twice the number of pixels.
Fig. 2.
(a)–(c) Comparison of 2D IR spectra of NaN3 in D2O collected using a linear 1 × 32 array (a) and the 128 × 128 FPA, without and with referencing [(b) and (c)]. (d) Slices across the 2D spectra taken parallel to the probe axis at ωpump equal to the 2D peak maximum. (e) Comparison of the RMSD of illuminated and dark pixels of the FPA, calculated over a million laser shots.
With referencing [Fig. 2(c)], the signal to noise of the 2D spectra shows distinct improvement (~4 ×), as quantified below. To quantify this improvement, the percent relative standard deviation (RSD, defined as: σ̃ = 100 × σ/μ, where σ is the standard deviation, and μ is the mean) of the 2D peak signal was calculated over the 400 scans acquired. The results are listed in Table 1. Referencing increases the signal to noise by a factor of ~4, which is about what is expected [25,26]. Interestingly, the RSD values of the line array and the FPA are very similar. The noise in 2D IR experiments is primarily from two sources, the laser shot noise and pixel noise. The similarity of the RSD values for the array and the FPA suggest that the noise in our measurements is dominated by laser shot noise. To further quantify the pixel noise of the FPA, we compared the root-mean-square deviation (RMSD) over a million laser shots of a strip of the dark pixels to that of a strip that had light incident on them. The results, shown in Fig. 2(e), clearly indicate that the pixel noise is negligible compared to the laser noise. The dynamic range was estimated to be ~65 dB from these measurements. We also note that the FPA does not have a highpass filter that is common with commercial line arrays. With a highpass or cold filter, the residual dark noise in Fig. 2(e) should be reduced even further. Moreover, the phase cycling scheme used here subtracts off dark noise (see Eq. 1). Thus, we conclude that the FPA detector is a viable alternative to linear arrays for these measurements, and might be useful in other 2D IR spectrometer designs that do not incorporate a pulse shaper [27,28].
Table 1.
Relative Standard Deviations of the 2D Peak Signal Measured with Linear Array, the FPA, and FPA with Referencing
| Linear Array |
FPA, without Referencing |
FPA, with Referencing |
|
|---|---|---|---|
| % RSD | 29.5 | 25.7 | 7.6 |
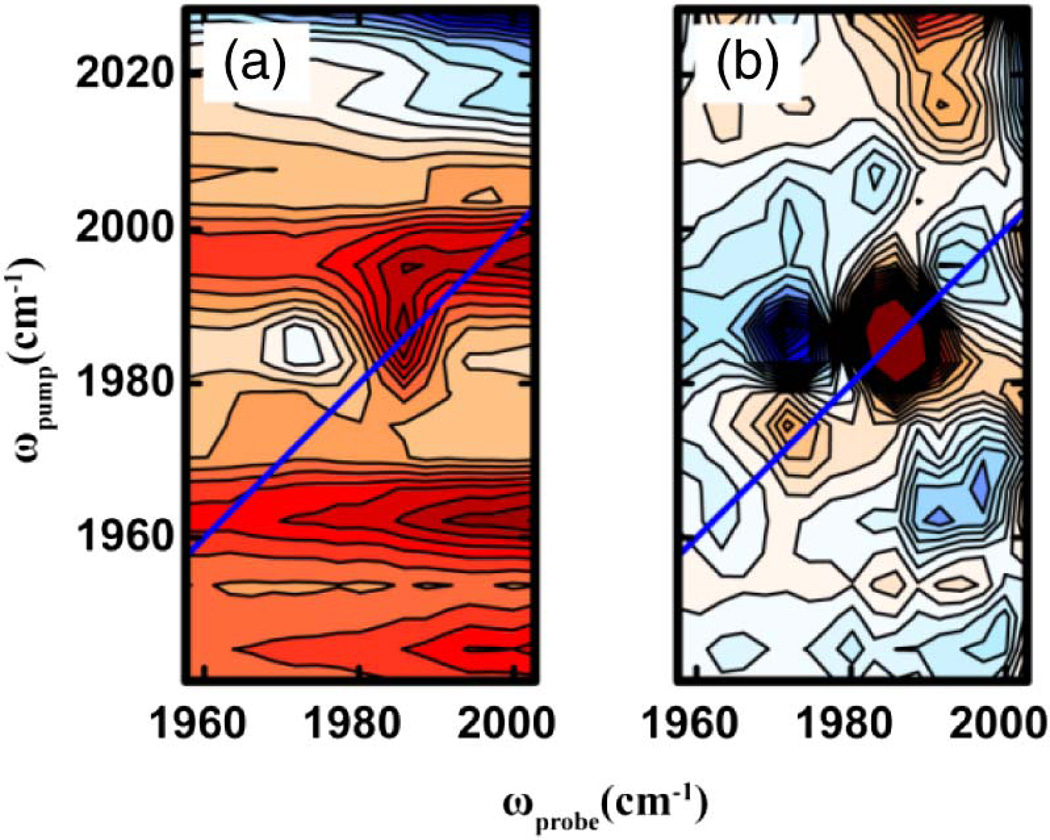
The limitations of experimental signal to noise can be most severe when 2D IR spectroscopy is used to investigate real-time dynamics, where it is imperative to acquire spectra in small fraction of the timescale of the kinetic process involved. To further test the improvements that can be gained through having higher pixel density and reference detection, 2D IR spectra of W(CO)2 in n-hexane were collected without any averaging, i.e., only a single laser shot was acquired for each coherence time-point. The resulting 2D IR spectra, shown in Fig. 3, illustrate improvement made possible with referencing. The 2D contours are barely discernable above the background noise without referencing [Fig. 3(a)]. With reference correction, the 2D peaks are clearly visible [Fig. 3(b)]. These results demonstrate that referencing with an FPA can enable experimental designs where 2D IR spectra are acquired in as little as a few hundred milliseconds. Compressed sensing might be further used to shorten data collection times [29].
Fig. 3.
Comparison of single shot 2D IR spectra of W(CO)6 in n-hexane collected (a) without and (b) with referencing using the FPA.
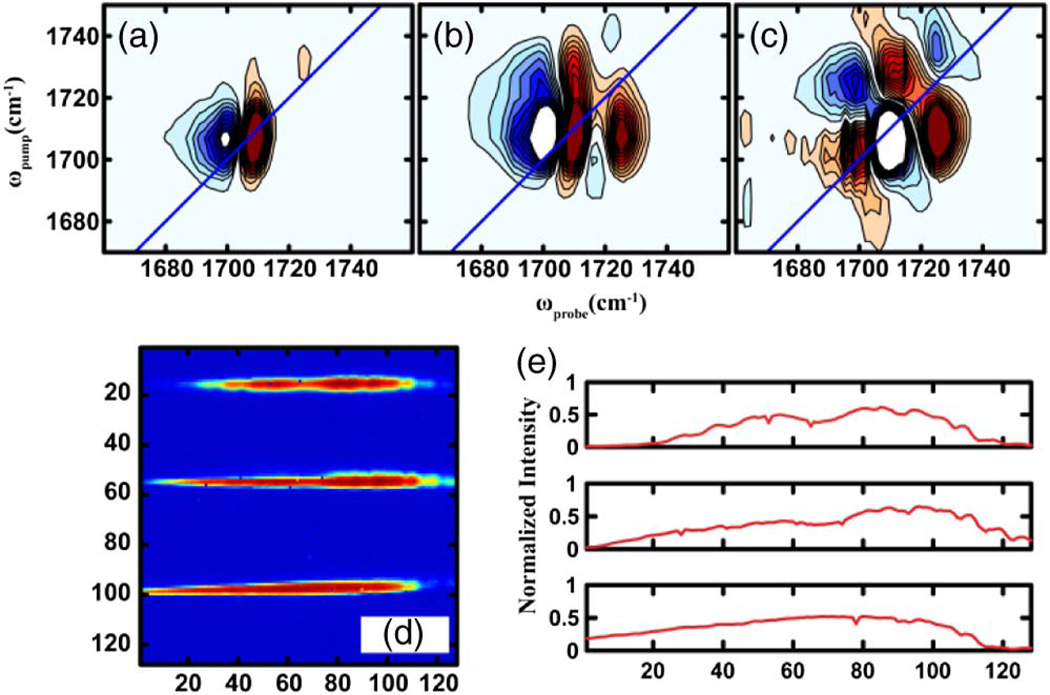
In addition to referencing, the FPA also opens up possibilities of experiments that require multiple beam detection. The polarization dependence of the 2D IR signal can be exploited to selectively enhance cross peaks, or to investigate the orientational relaxation of vibrational modes. All such experiments typically require measurement of the third order infrared response in orthogonal polarization conditions, namely ZZZZ and ZZYY [24,30]. The data is typically acquired through two separate experiments, one for each of the above polarization schemes. Measuring both spectra simultaneously is preferable so that the two are directly comparable and the results less susceptible to long time drift of laser sources. Simultaneous measurements of ZZZZ and ZZYY signals have been performed by Ramasesha et al. using a 2 × 64 double array, and more recently by Bakulin et al. using a 3 × 32 array that also incorporates a reference beam [31,32]. With an FPA, implementation of such anisotropy experimental schemes is simpler because multiple beams can be easily measured on its vertical axis, as shown in Fig. 4. The image in Fig. 4 was collected by setting the probe beam polarization to 45° with respect to the pump. Waveplates followed by wire grid polarizers were used to set the polarization of the pump and probe pulses. After the sample, the ZZZZ and ZZYY components of the signal were split using a wire grid polarizer that was set to transmit parallel polarized light and reflect perpendicularly polarized light. The two components were then dispersed through a monochromator (described before) and detected on the FPA. 1,3-cyclohexadione (CHD) contains two carbonyl groups that are strongly coupled and has been previously shown to exhibit prominent cross peaks between the two diagonal features [33]. 2D IR spectra of CHD in CHCl3 at T = 0 collected using this experimental scheme for the two polarization conditions are shown in Figs. 4(a) and 4(b). The ZZYY spectra clearly indicate exhibit enhanced cross peaks compared to ZZZZ, similar to previously reported measurements. The 3*ZZYY-ZZZZ difference spectra are shown in Fig. 4(c), which highlights the cross peaks. Unlike previous difference measurements, the difference was computed in the time domain for every laser shot. Simultaneously measuring both ZZZZ and ZZYY signals cuts the data acquisition time in half and improves their comparison and subtraction.
Fig. 4.
(a)–(c) 2D IR spectra of CHD in CHCl3 at T = 0 for (a) ZZZZ, (b) ZZYY, and (c) 3*ZZYY-ZZZZ polarization schemes. (d) Image of ZZYY and ZZZZ signal components and a reference beam (from top to bottom) on the FPA. (e) Corresponding spectra of (d).
In summary, we have reported a new design for a mid-IR pulse shaper that offers significant ease of implementation over existing designs. It has been previously demonstrated that the technology of mid-IR pulse shaping can be readily extended to a visible pulse shaper [12]. The advantages of our new all reflective pulse shaper design can be similarly utilized for visible pulse shaping to simply the experimental challenges of 2D-electronic spectroscopies, which should serve to encourage more research groups to employ such techniques. Furthermore, we have demonstrated the applicability of mid-IR focal plane arrays as suitable detectors in 2D IR experiments. The FPAs offer larger pixel density, allowing detection of infrared transition over a larger bandwidth and facile implementation of reference detection scheme along with simultaneous measurements of multiple polarization experiments. An FPA in combination with a mid-IR pulse shaper can also be used to do benchtop FTIR imaging, as we have recently demonstrated [34]. FPA detectors appear to be a viable alternative to linear arrays and set the stage for more sophisticated 2D IR microscopy experiments.
Acknowledgments
Funding. National Science Foundation (NSF) (CHE-1266422); National Institutes of Health (NIH) (R01GM102387).
A. L. S. was supported by a Diversity Supplement to NIH NIDDK 79895. T. A. O. was supported by the NSF Graduate Research Fellowship Program (DGE-1256259). M. T. Z. is the co-owner of PhaseTech Spectroscopy which manufactures mid-IR pulse shapers and markets FPA detectors.
REFERENCES
- 1.Thielges MC, Fayer MD. Acc. Chem. Res. 2012;45:1866. doi: 10.1021/ar200275k. [DOI] [PMC free article] [PubMed] [Google Scholar]
- 2.Stevenson P, Tokmakoff A. J. Chem. Phys. 2015;142:212424. doi: 10.1063/1.4917321. [DOI] [PMC free article] [PubMed] [Google Scholar]
- 3.Bredenbeck J, Helbing J, Nienhaus K, Nienhaus GU, Hamm P. Proc. Natl. Acad. Sci. USA. 2007;104:14243. doi: 10.1073/pnas.0607758104. [DOI] [PMC free article] [PubMed] [Google Scholar]
- 4.King JT, Kubarych KJ. J. Am. Chem. Soc. 2012;134:18705. doi: 10.1021/ja307401r. [DOI] [PubMed] [Google Scholar]
- 5.Meister K, Strazdaite S, DeVries AL, Lotze S, Olijve LLC, Voets IK, Bakker HJ. Proc. Natl. Acad. Sci. USA. 2014;111:17732. doi: 10.1073/pnas.1414188111. [DOI] [PMC free article] [PubMed] [Google Scholar]
- 6.Ghosh A, Wang J, Moroz YS, Korendovych IV, Zanni M, DeGrado WF, Gai F, Hochstrasser RM. J. Chem. Phys. 2014;140:235105. doi: 10.1063/1.4881188. [DOI] [PMC free article] [PubMed] [Google Scholar]
- 7.Middleton CT, Marek P, Cao P, Chiu CC, Singh S, Woys AM, de Pablo JJ, Raleigh DP, Zanni MT. Nat. Chem. 2012;4:355. doi: 10.1038/nchem.1293. [DOI] [PMC free article] [PubMed] [Google Scholar]
- 8.Oudenhoven TA, Joo Y, Laaser JE, Gopalan P, Zanni MT. J. Chem. Phys. 2015;142:212449. doi: 10.1063/1.4921649. [DOI] [PubMed] [Google Scholar]
- 9.DeFlores LP, Nicodemus RA, Tokmakoff A. Opt. Lett. 2007;32:2966. doi: 10.1364/ol.32.002966. [DOI] [PubMed] [Google Scholar]
- 10.Shim S-H, Strasfeld DB, Ling YL, Zanni MT. Proc. Natl. Acad. Sci. USA. 2007;104:14197. doi: 10.1073/pnas.0700804104. [DOI] [PMC free article] [PubMed] [Google Scholar]
- 11.Tian PF, Keusters D, Suzaki Y, Warren WS. Science. 2003;300:1553. doi: 10.1126/science.1083433. [DOI] [PubMed] [Google Scholar]
- 12.Grumstrup EM, Shim S-H, Montgomery MA, Damrauer NH, Zanni MT. Opt. Express. 2007;15:16681. doi: 10.1364/oe.15.016681. [DOI] [PubMed] [Google Scholar]
- 13.Myers JA, Lewis KLM, Tekavec PF, Ogilvie JP. Opt. Express. 2008;16:17420. doi: 10.1364/oe.16.017420. [DOI] [PubMed] [Google Scholar]
- 14.Shim SH, Zanni MT. Phys. Chem. Chem. Phys. 2009;11:748. doi: 10.1039/b813817f. [DOI] [PMC free article] [PubMed] [Google Scholar]
- 15.Strasfeld DB, Ling YL, Shim S-H, Zanni MT. J. Am. Chem. Soc. 2008;130:6698. doi: 10.1021/ja801483n. [DOI] [PMC free article] [PubMed] [Google Scholar]
- 16.Nishida J, Tamimi A, Fei HH, Pullen S, Ott S, Cohen SM, Fayer MD. Proc. Natl. Acad. Sci. USA. 2014;111:18442. doi: 10.1073/pnas.1422194112. [DOI] [PMC free article] [PubMed] [Google Scholar]
- 17.Kumar SKK, Tamimi A, Fayer MD. J. Chem. Phys. 2012;137:184201. doi: 10.1063/1.4764470. [DOI] [PubMed] [Google Scholar]
- 18.Rock W, Li Y-L, Pagano P, Cheatum CM. J. Phys. Chem. A. 2013;117:6073. doi: 10.1021/jp312817t. [DOI] [PMC free article] [PubMed] [Google Scholar]
- 19.Shim S-H, Strasfeld DB, Fulmer EC, Zanni MT. Opt. Lett. 2006;31:838. doi: 10.1364/ol.31.000838. [DOI] [PubMed] [Google Scholar]
- 20.Anna JM, Nee MJ, Baiz CR, McCanne R, Kubarych KJ. J. Opt. Soc. Am. B. 2010;27:382. [Google Scholar]
- 21.Fulmer EC, Ding F, Mukherjee P, Zanni MT. Phys. Rev. Lett. 2005;94:067402. doi: 10.1103/PhysRevLett.94.067402. [DOI] [PubMed] [Google Scholar]
- 22.Kidder LH, Levin IW, Lewis EN, Kleiman VD, Heilweil EJ. Opt. Lett. 1997;22:742. doi: 10.1364/ol.22.000742. [DOI] [PubMed] [Google Scholar]
- 23.Lee KS, Thompson KP, Rolland JP. Opt. Express. 2010;18:23378. doi: 10.1364/OE.18.023378. [DOI] [PubMed] [Google Scholar]
- 24.Hamm P, Zanni M. Concepts and Methods of 2D Infrared Spectroscopy. Cambridge University; 2011. [Google Scholar]
- 25.Hamm P, Wiemann S, Zurek M, Zinth W. Opt. Lett. 1994;19:1642. doi: 10.1364/ol.19.001642. [DOI] [PubMed] [Google Scholar]
- 26.Ghosh HN, Asbury JB, Lian T. J. Phys. Chem. B. 1998;102:6482. [Google Scholar]
- 27.Helbing J, Hamm P. J. Opt. Soc. Am. B. 2011;28:171. [Google Scholar]
- 28.Leger JD, Nyby CM, Varner C, Tang J, Rubtsova NI, Yue Y, Kireev VV, Burtsev VD, Qasim LN, Rubtsov GI, Rubtsov IV. Rev. Sci. Instrum. 2014;85:083109. doi: 10.1063/1.4892480. [DOI] [PubMed] [Google Scholar]
- 29.Dunbar JA, Osborne DG, Anna JM, Kubarych KJ. J. Phys. Chem. Lett. 2013;4:2489. [Google Scholar]
- 30.Woutersen S, Hamm P. J. Phys. Chem. B. 2000;104:11316. [Google Scholar]
- 31.Ramasesha K, Roberts ST, Nicodemus RA, Mandal A, Tokmakoff A. J. Chem. Phys. 2011;135:054509. doi: 10.1063/1.3623008. [DOI] [PubMed] [Google Scholar]
- 32.Bakulin AA, Selig O, Bakker HJ, Rezus YLA, Müller C, Glaser T, Lovrincic R, Sun Z, Chen Z, Walsh A, Frost JM, Jansen TLC. J. Phys. Chem. Lett. 2015;6:3663. doi: 10.1021/acs.jpclett.5b01555. [DOI] [PubMed] [Google Scholar]
- 33.Zanni MT, Ge NH, Kim YS, Hochstrasser RM. Proc. Natl. Acad. Sci. USA. 2001;98:11265. doi: 10.1073/pnas.201412998. [DOI] [PMC free article] [PubMed] [Google Scholar]
- 34.Serrano AL, Ghosh A, Ostrander JS, Zanni MT. Opt. Express. 2015;23:17815. doi: 10.1364/OE.23.017815. [DOI] [PMC free article] [PubMed] [Google Scholar]


