

Abstract
The synthesis and photophysical properties of a tetra-PEG-modified and freely water-soluble quinoline-annulated porphyrin are described. We previously demonstrated the ability of quinoline-annulated porphyrins to act as an in vitro NIR photoacoustic imaging (PAI) contrast agent. The solubility of the quinoline-annulated porphyrin derivative in serum now allowed the assessment of the efficacy of the PEGylated derivative as an in vivo NIR contrast agent for the PAI of an implanted tumor in a mouse model. A multi-fold contrast enhancement when compared to the benchmark dye ICG could be shown, a finding that could be traced to its photophysical properties (short triplet lifetimes, low fluorescence and singlet oxygen sensitization quantum yields). A NIR excitation wavelength of 790 nm could be used, fully taking advantage of the optical window of tissue. Rapid renal clearance of the dye was observed. Its straight-forward synthesis, optical properties with the possibility for further optical fine-tuning, nontoxicity, favorable elimination rates, and contrast enhancement make this a promising PAI contrast agent. The ability to conjugate the PAI chromophore with a fluorescent tag using a facile and general conjugation strategy was also demonstrated.
Introduction
The development of new—or the refinement of existing—imaging techniques of biological processes and tissue is arguably one of the leading driving forces in contemporary biomedical chemistry.1 Photoacoustic imaging (PAI) is a rapid and non-invasive imaging modality that combines optical and ultrasound imaging.2 Photoacoustic signals are optically generated and ultrasonically detected. It thus can take advantage of the optical window of tissue and provides the deep probing depth (multiple cm) and spatial resolution (sub-mm) of ultrasound.
PAI is the consequence of a number of physical effects:2c The absorption of a light pulse by a chromophore causes it to enter an excited state. Good PAI chromophores relax rapidly primarily along non-radiative pathways, causing a transient rise in temperature (in the mK regime) around the closest vicinity of the absorbing dye, leading to a localized thermal-elastic expansion. Thus, if the light source is a pulsed laser, light absorption generates a wideband ultrasonic wave. This signal can be acquired with standard ultrasonic transducers known from traditional ultrasound imaging. Furthermore, using wavelengths within the optical window of tissue (~700–1100 nm; the wavelength of maximum penetration of breast tissue is ~725 nm; whole blood has an absorption minimum at ~710 nm),3 dyes many centimeters deep within tissue can be probed. If such a NIR laser beam is scanned across an object, the photoacoustic data can be used to reconstruct 2D or 3D photoacoustic maps. The laser light energy used for in vivo imaging experiments is generally well below the standard thresholds above which tissue damages can be expected. Variants of PAI are photoacoustic tomography (PAT)2a for large-scale imaging and photoacoustic microscopy (PAM)4 for small scale, high-resolution image generation.
Endogenous chromophores, primarily hemoglobin, can be used as PAI dyes.5 This allowed for the imaging of the blood content of the vascular network in rodent brains4 or cancer in breast6 and ovary tissues,7 the mapping of mesoscopic biological objects or whole animals.2a However, particularly cancers in their early stages, cannot be detected by their intrinsic vascular contrast. Therefore, the use of exogenous contrast agents is required to achieve a suitable signal to noise ratio and to allow the PAI of deeply-seated organs or lesions.5
A number of nano- or micro-scale agents have been introduced as PAI or multimodal contrast agents in recent years, with some showing good in vivo imaging results.8 Among them are metal-based nanoparticles, combined with and without organic dyes, and nanotubes. However, the use of nanoparticles is not without problems with respect to biodistribution, toxicity, or homogeneity.9 Alternative approaches have been the use of molecular dyes assembled into vesicles, most prominent among them porphysomes made from chlorins or bacteriochlorins, such as pyropheophyrin derivative 1,8b, 10 microbubbles,8c, d or nanodroplets.8e Also developed were photoacoustic probes that are generated in tissue.11 Conspicuously rare in the contemporary literature are small molecular contrast agents designed for PAI.5 One example is 2, shown to be a suitable contrast agent for imaging dissolved oxygen using photoacoustic lifetime imaging.12 One of the oldest and best studied PAI contrast agents is the FDA-approved ocular angiographic dye indocyanine green (ICG, 3), and related derivatives.13 ICG possesses NIR absorption (λmax ~ 800 nm) properties but is otherwise far from ideal. For instance, ICG is fluorescent. Thus, a portion of the absorbed light is not translated into a photoacoustic signal, diminishing its effectiveness as a PAI contrast agent. ICG is confined to the vasculature space and it clears rapidly (t1/2 < 4 min),14 complicating longitudinal in vivo studies. Irrespective of these shortcomings, the broad utilization of ICG suggests its use as a benchmark dye. The absence of the development of many molecular contrast agents highlights the fact that reliable structure-function relationships that might guide the rational development of photoacoustic dyes suitable for their use in biological contexts has not been derived.
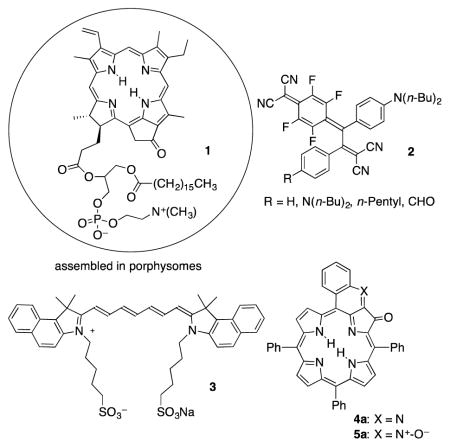
We recently reported the synthesis of meso-tetraphenylporphyrin-derived quinoline-annulated porphyrins, such as 4a or 5a.15 As a consequence of the extended π-conjugation and their annulation-induced non-planarity of the porphyrinic chromophore, the photophysical properties of quinoline-annulated porphyrins are significantly altered when compared to those of the parent porphyrin. While regular porphyrins generally do not absorb much past 650 nm, quinoline-annulated porphyrins possess λmax bands in the 750 nm range. We have further shown that the bis-annulated systems and quinoline-annulated chlorins (in which another pyrrole was modified by a non-pyrrole heterocycle) are accessible by step-wise conversion of 5a, further manipulating the optical properties of this family of porphyrinoids.15 Complementary syntheses of some of these derivatives and related chromophores are also known.16
Crucially, quinoline-annulated porphyrins 4a and 5a were shown to be primarily relaxing rapidly non-radiatively, making them very good photoacoustic dyes.17 We demonstrated a ~ 2.5-fold PAI contrast enhancement for 4a over pure blood or ICG in phantom tissue experiments. The realization of the combination of a NIR-absorbing chromophores showing good photoacoustic signal generation efficiency is difficult, as the direct comparison of a number of NIR dyes absorbing in the same wavelength range has shown.17 Despite the promise of 4a or 5a as PAI contrast agents, however, their insolubility in aqueous solutions (in the absence of a formulation vehicle like Cremophore EL®) prevented their in vivo assessment.
We report here firstly the development of a quinoline-annulated porphyrin-based single-molecule, serum-soluble PAI contrast agent and the evaluation of its efficacy as an in vivo PAI contrast agent for the detection of implanted tumors in a mouse model. A multi-fold contrast enhancement when compared to ICG was found, a finding that could be traced to its photophysical properties. Its nontoxicity and renal clearance rates will be demonstrated. We also prepared a water-soluble quinoline-annulated derivative of the quinoline annulated porphyrin carrying a small fluorescent tag designed to facilitate the biodistribution studies of this intrinsically non-fluorescent chromophore. Alas, it was not fluorescent enough to be of utility. Nonetheless, the experiment demonstrated a facile and general conjugation strategy for these chromophores.
Results and Discussion
Synthesis of a freely water-soluble quinoline-annulated porphyrin
A number of strategies were established to render meso-arylporphyrins water-soluble.18 Among them are their functionalization with anionic (carboxylate, sulfonate, phosphonate) or cationic (pyridinium) groups or their decoration with (multiple) polyethylene glycol (PEG) chains. We chose the PEG-strategy for the charge neutrality of the final products and previous reports indicating their suitability for tumor targeting.18e, 19 We found that quinoline-annulated porphyrin 4a is chemically stable under the classic acidic methoxy deprotection conditions (BBr3) but not to, for example, classic basic saponification reaction conditions (NaOH, wet THF). We thus chose the phenol-protected meso-tetrakis(p-methoxyphenyl)porphyrin 6b as the basis for the formation of the quinoline-annulated porphyrin chromophore,15a with the intent to deprotect and PEG-ylate the phenolic oxygens using standard Williamson alkylation strategies at the last stages of the dye synthesis pathway. This strategy was successful as demonstrated by the synthesis of the waters-soluble dyes 4d and 4e (Scheme 1).
Scheme 1.

Reaction conditions: (i) 1. 1 equiv. OsO4, 30% pyridine/CHCl3, r.t.; 2. H2S (ii) 4 equiv. DMP, CH2Cl2, r.t. (iii) 100 equiv. NH2OH·HCl, pyridine, N2 atmosphere, r.t. (iv) DDQ, CH2Cl2, r.t. (v) pyridine, Δ (vi) 1. BBr3, CH2Cl2 (vii) Me(OCH2CH2)nOMs, Cs2CO3, DMF, 90 °C.
p-Methoxy-derivatized quinoline-annulated porphyrin 4b was synthesized from meso-tetrakis(p-methoxyphenyl)porphyrin 6b using the dihydroxylation ® oxidation ® oximation ® annulation route established earlier for this chromophore class;15a all intermediates showed the expected spectroscopic and analytical properties (see ESI). However, some notable deviations from the established protocols were implemented. The oxidation of diolchlorin 7 required the use of Dess-Martin Periodinane (DMP) for its smooth conversion to the corresponding 2,3-dioxochlorin 8.20 The generally used oxidant DDQ failed to produce this dione;21 instead dehydration to the corresponding enol was observed (the reaction was not further investigated). Oxime 9 formed smoothly; its treatment with p-TSA under forcing conditions (toluene, reflux) produced the quinoline annulated porphyrin 4b in acceptable yields, but this product was contaminated with the corresponding N-oxide 5b. Because their separation was tedious, we treated oxime 9 with DDQ, thus forming N-oxide 5b as the exclusive product in near-quantitative yields. We attribute the electron-rich nature of the p-OMe-substituted oxime to the facile annulation and oxidation. N-Oxide 5b could be readily reduced to quinoline annulated porphyrin 4b by heating to reflux in pyridine. Similarly readily losses of the N-oxide were observed previously.15a Quinoline-annulated porphyrin N-oxide 5b was also susceptible to a BBr3-mediated deprotection of the methoxy groups and concomitant reduction of the N-oxide, without any noticeable degradation of the macrocycle, generating the phenolic quinoline-annulated porphyrin 4c in five linear steps from porphyrin 6b.
Phenol-derivatized quinoline-annulated porphyrin 4c could be PEG-ylated with a methoxy-capped PEG-mesylate using a short PEG chain (n = 4), forming 4d, as well as a longer chain (avg. MW 550, n ~ 12), forming 4e. ESI+ MS and 1H NMR spectra of 4d and 4e confirmed that all four non-equivalent phenolic OH-groups were PEG-ylated. The mass spectra of 4e reflect the chain length inhomogeneity of the longer PEG-chain (see ESI). Because of the homogeneity of the shorter PEG derivative, we used this derivative for the determination of the photophysical properties of the water-soluble quinoline-annulated porphyrins.
Photophysical properties and solubility of PEGylated quinoline-annulated porphyrins 4d and 4e
The presence of the four p-methoxy groups in 4b (or the four p-OH groups in its deprotected derivative 4c) is reflected in a slight red-shift of its optical spectrum (λmax = 762 nm for 4b, λmax = 748 nm for 4c) when compared to the spectrum of 4a (λmax = 728 nm), but the overall characteristics of the quinoline-annulated porphyrins are not altered (Figure 1A).17
Figure 1.

UV-vis spectra (A: CH2Cl2, B: H2O) of the compounds indicated.
The shorter PEG derivative 4d is highly soluble in CH2Cl2 as well as alcoholic solvents, but is only slightly soluble in pure water. The PEG-ylated quinoline-annulated porphyrin 4e is freely soluble in alcohols, water, serum, and PBS buffer. As expected, the PEGylated derivatives 4d and 4e possess a λmax value of 764 nm in CH2Cl2. Both compounds exhibit some modest degree of solvatochromism. The spectrum of 4e in water, for example is slightly blue-shifted and overall broadened (Figure 1B).
The dissolution of 100 mg 4e/mL PBS was readily possible, forming a 33.3 mM solution. The solubility is therefore ~ 2 orders of magnitude higher than the reported value for ICG in water.22 The Lambert-Beer law is maintained for aqueous concentrations up to 0.03 mM (the upper limit we could measure in a 1 mm path length cell) but the addition of the surfactant Triton™ X-100 to dilute solutions slightly blue-shifts and enhances the Soret band (see ESI), suggesting that 4e is somewhat aggregated in aqueous solution. The solutions are stable; no significant changes were observed in the UV-vis spectra of the solutions over many hours, and with only the onset of minor shifts after two weeks (in the dark at 4 °C).
The fluorescence quantum yield ϕ for 4e in CH2Cl2 as well as H2O were determined to be significantly below 0.1%. Transient absorption spectra (in the range from 450 to 900 nm) for 4e in both solvents with pump-probe delay times from 0 to 15000 ps delivered no reliable ISC-quantum yield or S1-lifetime data. Correspondingly, 4e in CH2Cl2, H2O, as well as H2O-Triton™ X-100 solutions showed no sign for the generation of singlet oxygen (1O2), as measured by the time-resolved NIR luminescence spectra of solutions of 4e (at O.D. = 0.1 at the excitation λ of 532 nm) at 1270 and 1210 nm.
Thus, PEGylated quinoline-annulated porphyrin 4e, like its parent compound,17 absorbs strongly within the spectroscopic window of tissue, is non-emissive, and not generating 1O2. These are excellent properties for a photoacoustic imaging agent.
Ex vivo Photoacoustic Signal Generation of Water-soluble Quinoline-annulated Porphyrin 4e
The strength of a photoacoustic (PA) signal generated by an irradiated sample is dependent upon the excitation source, absorption coefficient of the sample, solvent, and its Grüneisen parameter that represents the efficiency of the photoacoustic signal generation.3b We previously demonstrated in tissue phantom studies the 2.5-fold increase of the photoacoustic signal resulting from quinoline-annulated porphyrin 4a (dissolved in PBS–1% DMF–1% Cremophore EL®) over the signal resulting from blood at identical absorbance values.17 Water-soluble quinoline-annulated porphyrin 4e dissolved in water exhibits a similarly excellent performance. In detail, the relative ex vivo photoacoustic signal generation efficiency of the dye 4e placed in a translucent polyethylene tube submerged in a water bath was compared against that of day-old rat blood in the same setup and otherwise identical irradiation and detection conditions. The concentration of 4e was adjusted so as to possess the identical absorbance value of the blood sample at 790 nm, the wavelength of the laser used to excite the dye. The co-registered pulse-echo and photoacoustic tomography (PE-PAT) images clearly show that the tube filled with 4e generated a 4-fold stronger signal, thus generating a much higher contrast image than the blood sample (in water, 1 cm scan depth; Figure 2A and 2B).
Figure 2.
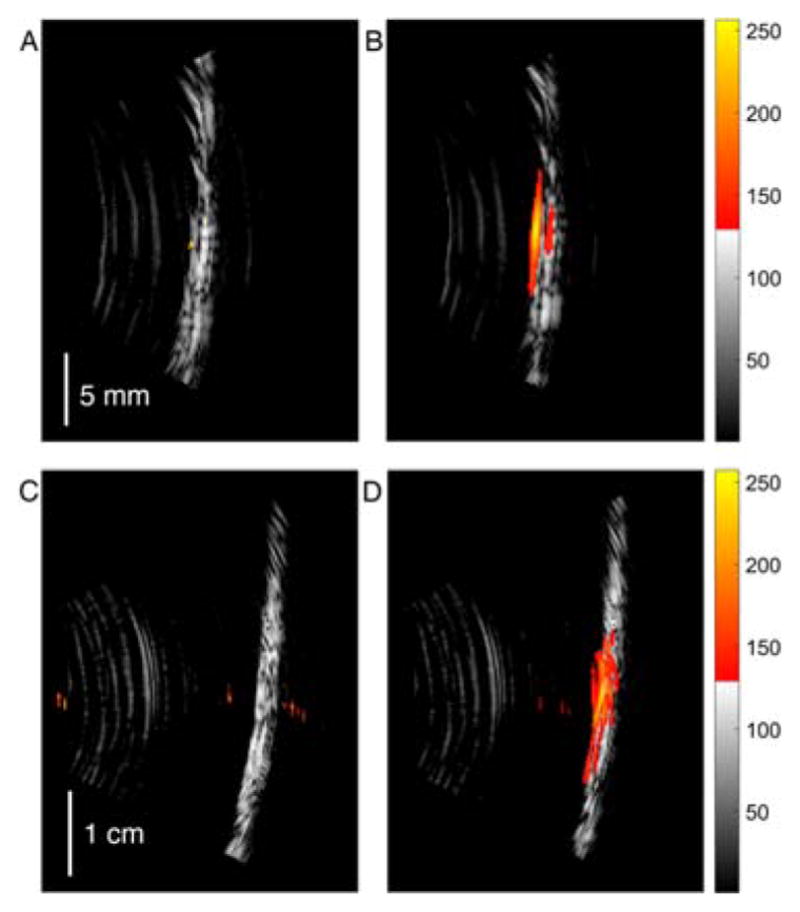
Co-registered PE-PAT images of polyethylene tubes (inner/outer Ø = 0.58/0.96 mm) filled with (A and C) one-day-old rat blood and (B and D) with a solution of PEG-ylated quinoline-annulated porphyrin 4e at a concentration in which the sample possessed the identical absolute absorbance value at 790 nm as the undiluted blood (see ESI). In each image pair (A-B and C-D) the PAT signal was normalized to the maximum value recorded from the tube filled with 4e. Samples immersed in water (A and B, PA signal dynamic range of −12 dB, the threshold is 25% of maximum) and Intralipid® (C and D, dynamic range of −15 dB, the threshold is 18% of maximum) at 1 cm (A and B) and 2.5 cm (C and D) scan depths, respectively. Vertical image axis is approximately parallel to the tube length and horizontal axis represents imaging depth.
In tissue, light is significantly scattered and absorbed. The fat emulsion Intralipid® provides a strongly scattering medium for light.23 Thus, at 2.5 cm depth, only a small fraction of the light energy is delivered to the targets.3b In fact, at the light level used in the experiment, the blood sample could not provide any PA signal higher than the noise level (Figure 2C), while the tube filled with 4e still delivered well-resolved and high-contrast images (Figure 2D), demonstrating its potential as a PAI contrast agent.
Toxicity of PEGylated quinoline-annulated porphyrin 4e
Anesthetized 6 week old BALB/c mice were treated with 100 μL of a 33.3 mM PBS solution of 4e via retro-orbital injection and their heart rates were monitored for 3 h after injection. No signs of distress of the mice were observed. They also lived for several weeks after the injection with normal weight gain, and showed no abnormal behavior. The majority of the dye is excreted via the renal pathway within the first hour after injection (see also below). These are all promising preliminary indications for the absence of any acute toxicity of the PEG-ylated quinoline-annulated porphyrin 4e.
The use of quinoline-annulated porphyrin 4e as an in vivo PAI contrast agent
As a result of the solubility, apparent non-toxicity, and high PA signal generation efficiency of the PEG-ylated dye 4e, we tested the efficacy of this dye as an in vivo PAT contrast agent in a mouse model. The dye 4e (100 μL of a 33.3 mM of 4e in PBS) was administered via retro-orbital injection24 to anesthetized BALB/c mice with tumors (7–10 mm) implanted in their flanks, and the PE and co-registered PE-PAT images were recorded, beginning 1 min after injection (Figure 3A–B). The PE image shows the outline of the tumor and serves as backdrop to the PA image. Before injection, only few pixels of the PA image possess high enough signal strength to exceed a threshold value (25% of the maximum PA signal after injection). Proximately after injection (1 min), a ~ 4-fold increase in the PAT signal strengths originating from the tumor site were recorded. The enhancement of the PA signal was monitored for 45 min after injection, seeing a gradual loss of the signal strength, but even after 45 min, an at least 2-fold PA signal enhancement was still achieved (Figure 4). The effect of PEG-ylation on increasing the blood circulation time of small molecules has been described.25
Figure 3.
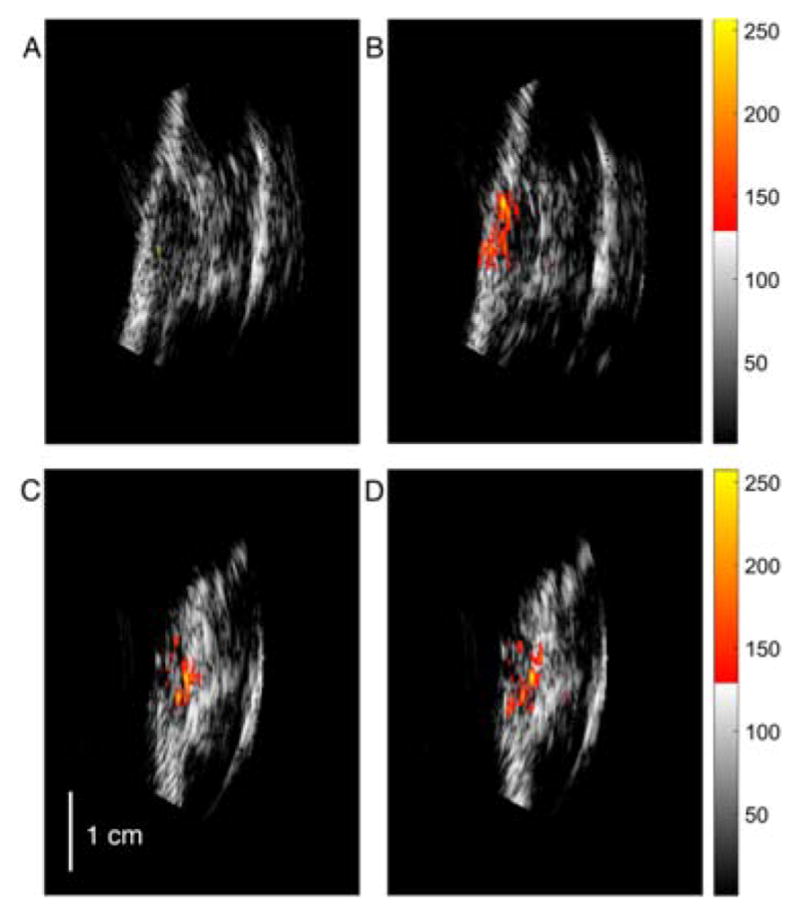
Co-registered PE-PAT images before injection of the contrast agent (A) and ICG (C) and after the systemic injection of 4e (B) and ICG (D). In each image pair (A-B and C-D) the PAT signals were normalized to the same maximum value recorded after the injection; a similar dynamic range of −12 dB is applied to all images (the threshold is 25% of the maximum value). The vertical axis is approximately parallel to the surface of the mouse body and the horizontal axis represents the depth inside the body.
Figure 4.
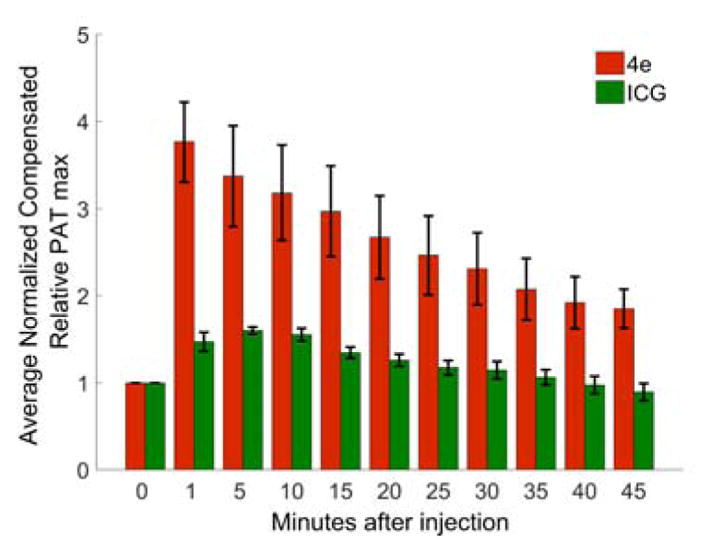
Time-dependence of the relative enhancement of the PAT max value following the injection of 100 μL of the dye 4e (~33.3 mM, λexcitation = 790 nm) and ICG (1.33 mM, λexcitation = 780 nm) at identical absorbance value.
In comparison, injection of 100 μL ICG solution of identical absorbance at 780 nm as 4e at 790 nm ([ICG] = 1.33 mM) provided a significantly lower PA signal strength enhancement (~1.6-fold) (Figures 3C–D), with no enhancement after less than 30 min (Figure 4). Thus, the rate at which dye 4e is excreted (via renal pathways, see below) is significantly slower than the rapid excretion rate of ICG.14
Renal filtration of quinoline-annulated porphyrin 4e
An early indication for the biodistribution of dye 4e was the observation of the color of the urine excreted by the mice immediately after the imaging experiments (after ~45 min) to the color of the dye (Figure 5). This suggested a very efficient renal filtration of the dye. Using UV-vis spectroscopic and HPLC-MS analyses of the urine extracts, we were able to show that 4e was excreted in unaltered form (see ESI).
Figure 5.
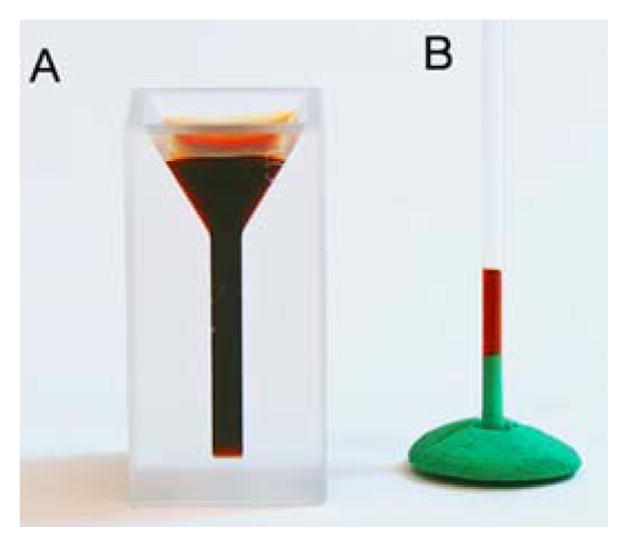
A. PEG-ylated quinoline-annulated dye 4e dissolved in PBS (~33.3 mM) in a microcuvette. B. Mouse urine collected after ~45 min after injection of 4e in a capillary tube.
Fluorescent-tagging of quinoline-annulated porphyrin 4e
Quinoline-annulated porphyrin 4e is non-fluorescent. However, the recording of fluorescent images of organs or the measurement of the dye-specific fluorescence of organ or biofluid extracts are convenient methodologies to track the biodistribution of any fluorophore. Thus, we opted to prepare a fluorophore-tagged derivative of quinoline-annulated porphyrin 4e. Recognizing that FRET processes might be operative that quench the fluorescence of the tag at the absorption maxima of quinoline-annulated porphyrins, we looked for fluorophores that emit in an area of relative minor absorption of these chromophores (Figure 1).
BODIPYs are well-established low molecular weight fluorophores of high brightness and multiple options to adjust their optical spectra.26 Furthermore, a recent report describing the reaction of meso-mercapto-BODIPY derivative 10 with phenols to generate the meso-phenoxy-BODIPY derivative 11 (Scheme 2)27 seemed most suitable for our task of tagging a tetra-phenol-derived quinoline-annulated porphyrin. Moreover, the emission λmax of 495 nm for 11 lies within the target range, and the attachment of the fluorophore at the most distal position to the porphyrinic chromophore would also reduce the chances for any FRET.
Scheme 2.
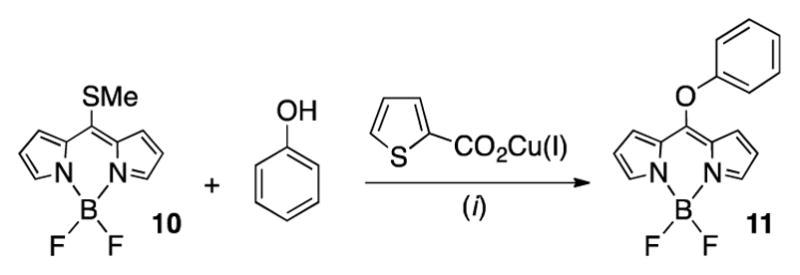
Reaction Conditions: (i) Na2CO3, MeCN, 55 °C.
Thus, we chose to attach a single BODIPY moiety to one of the four phenolic oxygens of tetraol 4c, followed by exhaustive PEG-ylation of the remaining three phenol functionalities (Scheme 3).
Scheme 3.
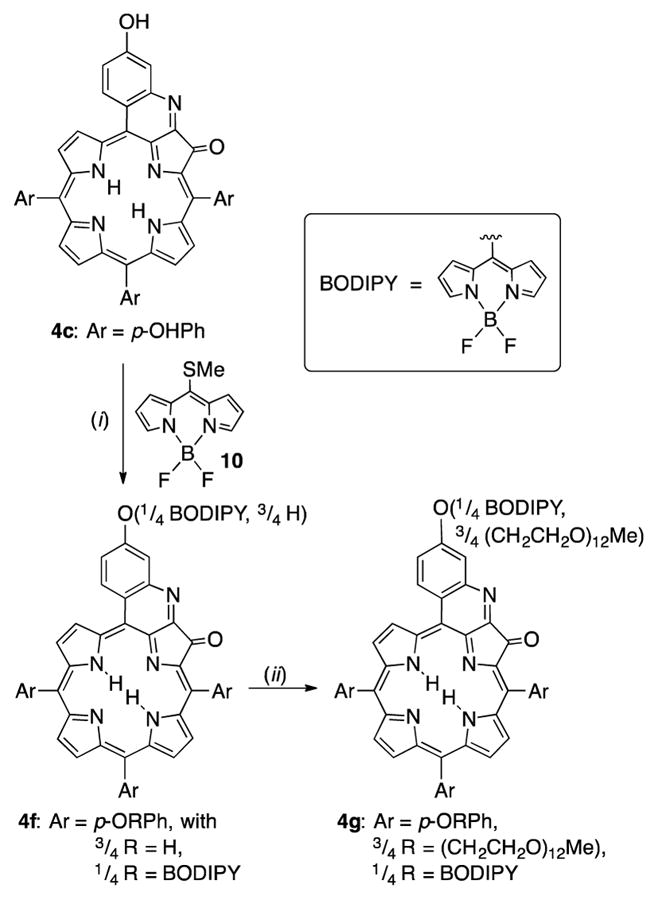
Reaction conditions: (i) 1. Zn(OAc)2·2H2O, CH2Cl2/MeOH, Δ; 2. 1 equiv 10, Na2CO3, CuTC, CH3CN, 50 °C; 3. aq. HCl. (ii) Me(OCH2CH2)12OMs, Cs2CO3, DMF, 90 °C
In anticipation of the copper-catalyzed reaction chosen for the conjugation of the fluorescent tag to quinoline-annulated porphyrin 4c, its central cavity was protected by insertion of zinc(II). A Cu(I) thiophene-carboxylate (CuTC)-mediated reaction of meso-mercapto-BODIPY 10,27 followed by an acid-mediated removal of the zinc protecting group using a mineral acid wash, generated quinoline-annulated porphyrin 4f in which one of the phenolic oxygens was derivatized with the BODIPY group, while the other three groups remained unmodified (as per ESI+ MS). The lack of regioselectivity of this reaction is reflected in the complex 1H NMR spectrum of this compound (see ESI). The three phenolic oxygens of 4f were then PEG-ylated using the long PEG mesylate as described above. Product 4g, a deep yellow oil, shows the expected composition (as per MALDI MS). It is freely water-soluble. The presence of the BODIPY is seen in the (complex) 1H NMR spectrum of 4g by the observation of the diagnostic peaks for the α- and β-protons of the BODIPY moiety (at δ = 6.5–7.0 ppm). Its 19F NMR spectrum indicates the presence of fluorine atoms at δ = −146.4 to −146.6 ppm, the typical range for BODIPY fluorine atoms.
The UV-vis spectrum of non-PEGylated derivative 4f is derived from a linear addition of the spectrum of tetraol 4c and BODIPY 11 (Figure 6A), with only some minor shifts and broadening likely derived from the presence of four regioisomers. Upon PEGylation of 4f, the UV-vis spectrum is further broadened, with retention of the overall character of the quinoline-annulated derivatives (Figure 6B).
Figure 6.
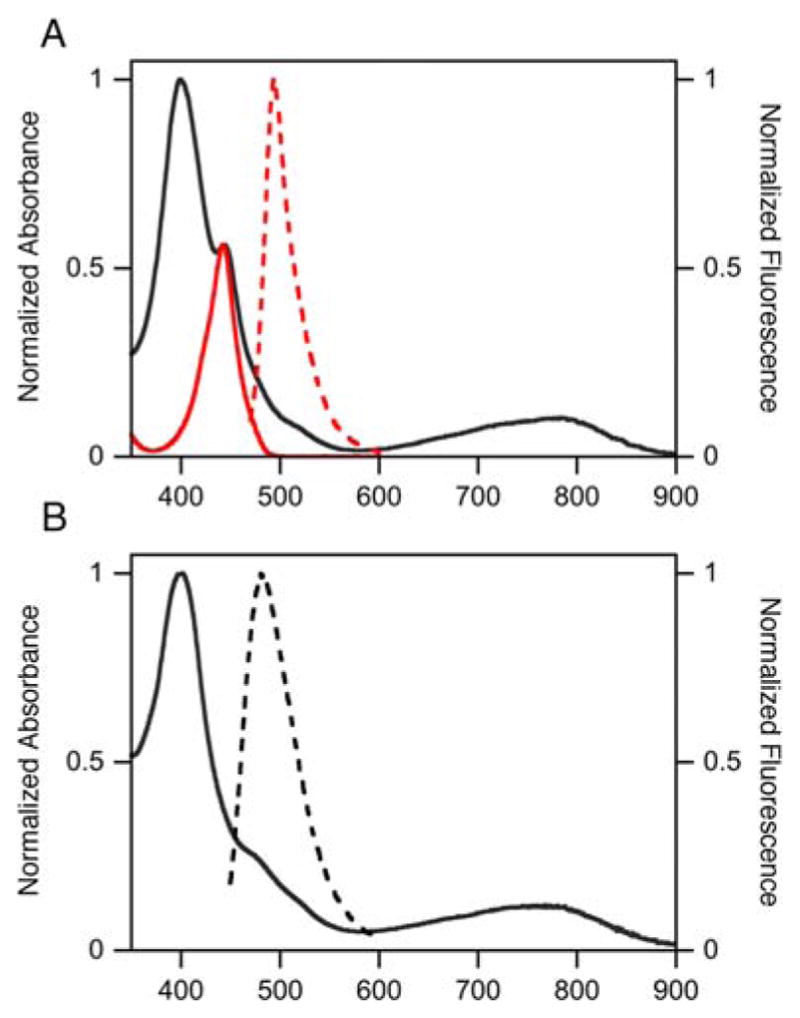
A. UV-vis spectra of 4f (black) and 11 (red) (solid lines), and fluorescence emission (red broken line; λexcitation = 441 nm) for phenoxy-BODIPY 11 (all MeOH). B. UV-vis (solid line) and fluorescence emission (broken line; λexcitation = 441 nm) spectra of quinoline-annulated porphyrin-BODIPY dyad 4g (MeOH)).
When dyad 4g is excited at the λmax value of the BODIPY moiety (at 441 nm), the molecule emits at 485 nm, this emission can be attributed to the BODIPY portion of 4g.27 However, the fluorescence yield ϕ for 4g is estimated to lie below 0.3%, i.e., much lower than the fluorescence yield ϕ for 11.27 This suggests that some FRET (or other quenching) mechanisms are operative in 4g, but that this quenching is not efficient enough to entirely switch off the fluorescence of the BODIPY moiety. The low fluorescence yield further questions the possibility of tracking dyad 4g in tissue using a fluorescence scanner.
Biodistribution study of BODIPY-tagged quinoline-annulated porphyrin 4g
The biodistribution of the BODIPY-labeled derivative 4g in the tumor and other organs was studied by ex vivo fluorescent imaging, following the injection of 4g into 4 BALB/c mice as described for 4e. The mice were sacrificed after 15 or 120 min after injection, the organs extracted, and their radiant efficiency fluorescent images recorded (λexc = 465 nm; GFP emission filter). Unfortunately, however, the high amount of tissue auto-fluorescence in that wavelength, did not allow the recording of high-contrast images. We note, however, that the tumor was yellow stained, suggesting an accumulation of the dye 4g in the tumor. Similarly, the tumor was visibly dark brown stained after the injection of 4e (see ESI).
Conclusions
In conclusion, we have demonstrated the in vivo efficacy of freely serum-soluble quinoline-annulated porphyrin derivative 4e as a molecular contrast agent for photoacoustic tomography. The solubilization of the quinoline-annulated porphyrin followed a straight-forward PEGylation strategy, with the lengths of the PEG chains determining the solubility of the final product. The product appeared to be low acute toxicity, accumulated in the tumor site, and was rapidly excreted in unaltered fashion via renal pathways. The solubilisation strategy is conceivably also suitable to other quinoline-annulated porphyrin derivatives. Conjugation of the non-fluorescent PEGylated quinoline-annulated porphyrin to a fluorophore was also demonstrated, but the hopes to utilize this derivative for the tracking of the biodistribution of the contrast agent using fluorescence imaging was not fulfilled. Nonetheless, the flexible derivatization strategy points the way toward the conjugation to other molecules.
Experimental section
Synthesis: Materials and instrumentation
All solvents (Aldrich, Acros) and reagents MeO-PEG4-OMs (Aldrich) and MeO-PEG12-OMs (Creative Peg Works), CuTC (Aldrich) were reagent grade, or better, and were used as received. meso-Tetrakis(p-methoxyphenyl)-2,3-dihydroxychlorin (7),28 and BODIPYs 10 and 11 were prepared as described previously.27
Analytical (aluminum backed, silica gel 60, 250 μm thickness) and preparative (20 × 20 cm, glass backed, silica gel 60, 500 μm thickness) TLC plates, and the flash column silica gel (standard grade, 60 Å, 32–63 μm) used were provided by Sorbent Technologies, Atlanta, GA.
1H and 13C NMR spectra were recorded on Bruker Avance II 400 and Bruker Avance I 500 instruments in the solvents indicated, and were referenced to residual solvent peaks. High and low resolution ESI mass spectra were provided by the Mass Spectrometry Facilities at the Department of Chemistry, University of Connecticut. MALDI MS Spectra were provided by the Mass Spectrometry & Proteomics Facility at the University of Notre Dame. UV-vis and fluorescence spectra were recorded on Cary 50 and Cary Eclipse photospectrometers, Varian Inc, respectively, and IR spectra on a Bruker Alpha-P FT-IR spectrometer using a diamond ATR unit.
meso-Tetrakis(p-methoxyphenyl)-2,3-dioxoporphyrin (8)
Diol 7 (270 mg, 3.51 × 10⁻⁴ mol) was dissolved in CH2Cl2 (60.0 mL) in a round-bottom flask equipped with a magnetic stir bar. To the stirring solution was added Dess-Martin periodinane (590 mg, 1.39 × 10⁻³ mol, 4 equiv) in portions at ambient temperature. When the starting material was consumed (reaction control by UV-vis and TLC), the reaction was quenched by addition of a sat’d aq NaHCO3 solution. The organic layer was isolated and washed with H2O (3 × 30 mL). The organic layer was dried over anhyd Na2SO4 and evaporated to dryness by rotary evaporation, and the residue purified by column chromatography (silica-CH2Cl2) to yield 8 as a dark blue powder in yields ranging from 65 to 90% (243 mg): Rf (CH2Cl2-silica) = 0.52; 1H NMR (400 MHz, CD2Cl2) δ 8.81 (d, 3J = 4.9 Hz, 1H), 8.65 (d, 3J = 4.9 Hz, 1H), 8.61 (s, 1H), 8.06 (d, 3J = 8.6 Hz, 2H), 7.84 (d, 3J = 8.6 Hz, 2H), 7.31-7.24 (m, 4H), 4.07 (two overlapping s, 6H), −1.90 (br s, 1H, exchangeable with D2O); 13C NMR (100 MHz, CD2Cl2): δ 188.2, 159.9, 159.6, 155.64, 155.62, 155.59, 140.9, 140.2, 138.4, 135.3, 134.1, 133.8, 133.4, 131.8, 128.4, 128.0, 123.9, 113.4, 112.65, 112.54, 112.47, 55.5, 55.4 ppm; UV-vis (CH2Cl2) λmax (log ε) 410 (5.26), 477 (4.26) nm; FT-IR (neat, diamond ATR) 1730 (nC=O) cm−1; HR-MS (ESI+, 100% CH3CN, TOF) m/z calcd for C48H37N4O6 ([M·H]+) 765.2713, found 765.2726.
meso-Tetrakis(p-methoxyphenyl)-2-hydroxyimino-3-oxoporphyrin (9)
Dione 8 (94 mg, 1.2 × 10⁻⁴ mol) was dissolved in pyridine (30.0 mL) in a round bottom flask equipped with a magnetic stir bar and N2 inlet. Hydroxylamine hydrochloride (NH2OH·HCl, 850 mg, ~100 equiv) was added, and the mixture was stirred at ambient temperature. When the starting material was consumed (after about 24 h; reaction control by TLC), the reaction mixture was evaporated to dryness by rotary evaporation. The residue was taken up in CH2Cl2 and filtered through a glass frit (M). The volume of the filtrate was reduced and submitted to column chromatography (silica-CH2Cl2/1% MeOH) to afford the olive-green product 9 in 60% yield, (58 mg): Rf (silica-CH2Cl2/1% MeOH) = 0.65; 1H NMR (400 MHz, CD2Cl2) δ 15.78 (br s, 1H, exchangeable with D2O), 8.81 (d, 3J = 5.7 Hz, 2H), 8.62 (t, 3J = 8.4 Hz, 4H), 8.03 (dd, 3J = 8.4, 4J = 2.0 Hz, 4H), 7.85 (dd, 3J = 8.4 Hz, 4H), 7.27-7.19 (m, 8H), 4.05 (s, 12H), −2.23 (br s, 1H exchangeable with D2O), −2.36 (br s, 1H exchangeable with D2O) ppm; 13C NMR (100 MHz, CD2Cl2) δ 188.2, 159.82, 159.75, 159.6, 156.4, 154.9, 151.9, 145.4, 141.1, 139.8, 138.9, 138.80, 137.98, 135.4, 134.4, 133.6, 133.50, 133.47, 132.1, 128.6, 128.4, 127.63, 127.57, 123.8, 121.8, 115.8, 113.0, 112.7, 112.4, 112.2, 55.5, 55.42, 55.39, 53.8 ppm; UV-vis (CH2Cl2) λmax (log ε) 410 (5.44), 465 (sh), 613 (4.04), 670 (sh) nm; FT-IR (neat, diamond ATR): 1732 (nC=O) cm−1; HR-MS (ESI+, 100% CH3CN, TOF) m/z calcd for C48H38N5O6 ([M·H]+) 780.2822, found 780.2801.
meso-Tris(p-methoxyphenyl)(p-methoxy)quinoline-annulated porphyrin N-Oxide (5b)
Oxime 9 (14.7 mg, 1.88 × 10⁻⁵ mol) was dissolved in CH2Cl2 (10.0 mL) in a round bottom flask equipped with a magnetic stir bar. To the stirring solution was added 2,3-dichloro-5,6-dicyano-1,4-benzoquinone (DDQ, 9 mg, 2 equiv) and the mixture was stirred at ambient temperature. When the starting material was consumed (after 0.5 h; reaction control by UV-vis and TLC), the reaction mixture was filtered through a plug of silica gel. The filtrate was washed with water (2 × 10 mL), dried over anhyd Na2SO4, and evaporated to dryness by rotary evaporation. The resulting residue was purified by column chromatography (silica-CH2Cl2/1% MeOH) to afford the brown product 5b in 97% yield (14 mg): Rf (silica-CH2Cl2/2% MeOH) = 0.22; 1H NMR (400 MHz, CDCl3) δ 8.54 (d, 3J = 4.2 Hz, 1H), 8.41 (d, 3J = 4.9 Hz, 1H), 8.35-8.28 (m, 3H), 8.19 (dd, 3J = 4.3 Hz, 2H), 8.03 (d, 3J = 2.0 Hz, 1H), 7.86-7.80 (m, 4H), 7.68-7.65 (m, 2H), 7.23-7.20 (m, 4H), 7.16-7.10 (m, 3H), 4.08-4.04 (m, 10H), 3.89 (s, 3H), −0.32 (br s, 2H, exchangeable with D2O) ppm; 13C NMR (100 MHz, CDCl3) δ 185.0, 159.9, 159.6, 159.3, 159.0, 155.9, 153.6, 145.9, 143.7, 143.5, 141.6, 138.2, 135.6, 135.5, 135.2, 134.9, 134.3, 133.7, 133.4, 133.3, 133.10, 132.98, 132.94, 131.0, 129.3, 127.7, 127.4, 127.3, 124.5, 123.8, 122.7, 120.9, 113.2, 113.1, 112.6, 112.5, 102.1, 101.9, 56.0, 55.6, 55.54, 55.47 ppm; UV-vis (CH2Cl2) λmax (log ε) 422 (5.02), 504 (4.27), 543 (4.16), 751 (4.09) nm; FT-IR (neat, diamond ATR): 1686 (nC=O) cm−1; HR-MS (ESI+, 100% CH3CN, TOF) m/z calcd for C48H36N5O6 ([M·H]+), 778.2666, found 778.2693.
meso-Tris(p-methoxyphenyl)(p-methoxy)quinoline-annulated porphyrin (4b)
Quinoline N-oxide 5b (23.7 mg, 3.05 × 10⁻⁵ mol) was dissolved in pyridine (25.0 mL) and heated to reflux. When the starting material was consumed (after 48 h; reaction control by TLC and UV-vis), the solvent was evaporated and the remaining residue was purified by preparative TLC (silica-CH2Cl2/2% MeOH) and solvent exchanged from CH2Cl2 to MeOH to afford the brown powder 4b in 44% yield (10 mg): Rf (silica-CH2Cl2/2% MeOH) = 0.54; 1H NMR (400 MHz, CD2Cl2): δ 8.97 (two overlapping d, 3J = 7.5 Hz, 2H), 8.37 (dd, 3J = 7.9, 4J = 4.9 Hz, 2H), 8.22 (d, 3J = 4.6 Hz, 1H), 8.16 (d, 3J = 4.4 Hz, 2H), 8.00-7.97 (m, 3H), 7.89 (d, 3J = 8.5 Hz, 2H), 7.73 (d, 3J = 8.4 Hz, 2H), 7.54 (dd, 3J = 9.1, 4J = 2.7 Hz, 1H), 7.28 (d, 3J = 8.5 Hz, 2H), 7.22 (dt, 3J = 5.3, 4J = 3.3 Hz, 4H), 4.09 (s, 3H), 4.06 (two overlapping singlets, 6H), 4.03 (s, 3H), 1.07 (s, 2H, exchangeable with D2O); 13C NMR (100 MHz, CD2Cl2): δ 202.2, 180.4, 160.2, 159.8, 159.4, 159.0, 148.96, 148.85, 148.29, 148.21, 146.8, 146.56, 146.54, 145.7, 135.5, 134.7, 134.3, 133.5, 133.2, 132.9, 132.3, 131.0, 129.9, 127.5, 127.2, 122.9, 120.5, 113.0, 112.9, 112.8, 112.7, 112.6, 112.3, 110.0, 55.8, 55.6, 55.5, 55.4 ppm; UV-vis (CH2Cl2) λmax (log ε) 418 (5.0), 490 (4.23), 529 (4.23), 701 (sh), 762 (4.12) nm; FT-IR (neat, diamond ATR): 1716 (nC=O) cm−1; HR-MS (ESI+, 100% CH3CN, TOF) m/z calcd for C48H36N5O5 ([M·H]+) 762.2716, found 762.2738.
meso-Tris(p-hydroxyphenyl)(p-hydroxy)quinoline-annulated porphyrin (4c)
Quinoline N-oxide 5b (26 mg, 3.3 × 10⁻⁵ mol) was dissolved in dry CH2Cl2 (5.5 mL) in a round bottom flask equipped with a magnetic stir bar and N2 inlet. A 1.0 M solution of BBr3 in CH2Cl2 (1.35 mL, ~40 equiv) was added drop-wise to the flask and the reaction mixture was stirred. When the starting material was consumed (after 24-48 h; reaction control by TLC), the excess BBr3 was quenched by the careful addition of the reaction mixture to distilled water (10 mL). The resulting mixture was extracted with EtOAc (3 × 20 mL), washed with sat’d sodium bicarbonate solution and water (2 × 20 mL). The organic layer was then dried over anhydrous Na2SO4. The resulting residue was adsorbed onto silica gel and dry-loaded onto a silica gel column and purified by chromatography (silica-CH2Cl2/10% MeOH) to afford 4c in 65% yield (18 mg): Rf (silica-CH2Cl2/10% MeOH) = 0.45; 1H NMR (400 MHz, DMSO-d6): δ 10.37 (s, 1H, exchangeable with D2O), 10.09 (s, 1H, exchangeable with D2O), 9.97 (s, 1H, exchangeable with D2O), 9.71 (s, 1H, exchangeable with D2O), 8.81 (s, 1H), 8.61 (s, 1H), 8.34 (s, 1H), 8.20 (s, 1H), 8.12 (d, 3J = 4.4 Hz, 1H), 8.03 (d, 3J = 5.8 Hz, 1H), 7.75 (d, 3J = 7.5, 3H), 7.58 (d, 3J = 7.8 Hz, 2H), 7.34 (d, 3J = 3.9 Hz, 1H), 7.16 (d, 3J = 7.9 Hz, 2H), 7.11 (d, 3J = 8.2 Hz, 2H), 7.04 (d, 3J = 8.4 Hz, 2H) ppm; 13C NMR (100 MHz, DMSO-d6): δ 194.6, 158.6, 158.1, 157.5, 157.4, 150.51, 150.49, 150.47, 146.12, 146.10, 142.03, 141.96, 138.92, 138.89, 136.1, 135.8, 135.43, 135.39, 135.2, 134.7, 134.6, 134.03, 133.94, 133.4, 132.5, 131.4, 131.1, 130.6, 130.3, 130.10, 130.09, 129.4, 127.86, 127.83, 127.80, 127.32, 127.30, 127.27, 127.26, 124.59, 124.57, 123.29, 123.26, 123.20, 123.19, 120.98, 120.96, 120.95, 120.26, 120.25, 115.44, 115.41, 114.95, 114.92, 114.82, 114.76, 114.68, 111.9, 109.4, 100.0 ppm; UV-vis (MeOH) λmax (log ε) 417 (5.15), 487 (sh), 531 (4.31), 748 (4.24) nm; FT-IR (neat, diamond ATR): 1705 (nC=O) cm−1; HR-MS (ESI+, 100% CH3CN, TOF) m/z calcd for C44H28N5O5 ([M·H]+) 706.2090, found 706.2061.
meso-Tris(p-MeOPEG4Ophenyl)(p-MeOPEG4O)quinoline-annulated porphyrin (4d)
Following a literature protocol for the PEGylation of a meso-(p-OH-phenyl)porphyrin,29 quinoline-annulated porphyrin 4c (10 mg, 1.4 × 10⁻⁵ mol) was dissolved in dry DMF (4.0 mL) in a two-neck round bottom flask equipped with a magnetic stir bar. MeO-PEG4-OMs (25.0 mg, 8.9 × 10⁻⁵ mol, 6 equiv.) and Cs2CO3 (24.2 mg, 7.4 × 10⁻⁵ mol, 5.2 equiv.) were added and the reaction mixture was immersed in a preheated oil bath at ~100 °C. After consumption of the starting material after ~3 h (reaction control by TLC) the solvent was evaporated and the residue was partitioned between EtOAc (10 mL) and H2O (10 mL). The organic layer was washed with H2O (3 × 10 mL) and dried over Na2SO4. The brown residue was purified by column chromatography (silica-CH2Cl2/5% MeOH) to afford the tetra-PEGylated product 4d as a yellow-brown oil in 56% yield (12 mg): Rf (silica-CH2Cl2/10% MeOH) = 0.56; 1H NMR (500 MHz, CD2Cl2): δ 9.06-9.04 (m, 2H), 8.40 (d, 3J = 4.5 Hz, 1H), 8.36 (d, 3J = 5.0 Hz, 1H), 8.23 (d, 3J = 4.5 Hz, 1H), 8.16 (d, 3J = 4.5 Hz, 2H), 7.99 (d, 3J = 8.5 Hz, 3H), 7.89 (d, 3J = 8.5 Hz, 2H), 7.71 (d, 3J = 8.5 Hz, 2H), 7.63 (dd, 3J = 9.1, 4J = 2.5 Hz, 1H), 7.30 (d, 3J = 8.6 Hz, 2H), 7.23 (dd, 3J = 8.5, 4J = 1.8 Hz, 4H), 4.44 (t, 3J = 4.5 Hz, 2H), 4.38 (two overlapping t, 3J = 4.7 Hz, 4H), 4.35 (t, 3J = 4.6 Hz, 2H), 3.99 (dd, 3J = 8.8, 4J = 4.7 Hz, 6H), 3.82-3.77, (m, 8H), 3.72-3.57 (m, 34H), 3.55-3.50 (m, 8H), 3.35 (s, 3H), 3.34 (s, 3H), 3.33 (s, 3H), 3.31 (s, 3H) ppm; UV-vis (CH2Cl2) λmax (log ε) 419 (5.2), 491 (4.5), 531 (4.4), 764 (4.3) nm; HR-MS (ESI+, 100% CH3CN, TOF) m/z calcd for C80H100N5O21 ([M·H]+), 1466.6911, found 1466.6891.
meso-Tris(p-MeOPEG12Ophenyl)(p-MeOPEG12O)quinoline-annulated porphyrin (4e)
Prepared from 4c (22 mg, 3.1 × 10⁻⁵ mol) in dry DMF (10.0 mL), Cs2CO3 (80 mg, 1.6 × 10⁻⁴ mol, 5.2 equiv.), and MeO-PEG12-OMs (80 mg, 1.2 × 10⁻⁴ mol, 4 equiv.) as described for the preparation of 4d. Reaction time at 90 °C ~3 h. Purified by column chromatography (silica-CH2Cl2/10% MeOH) to afford the tetra-PEGylated porphyrin 4e as a brown oil in 90-99 % yield (81 mg–89 mg): 1H NMR (400 MHz, CD2Cl2): δ 9.04 (s, 1H), 8.38 (two overlapping d, 2H), 8.19 (d, 3H), 7.98 (t, 3J = 6.6 Hz, 3H), 7.89 (d, 3J = 8.3 Hz, 3H), 7.72 (d, 3J = 8.4 Hz, 2H), 7.63 (d, 3J = 8.3 Hz, 1H), 7.31 (d, 3J = 8.5 Hz, 3H), 7.24 (dd, 3J = 8.6, 4J = 2.2 Hz, 4H), 3.34 (four overlapping s, 12H) ppm; UV-vis (CH2Cl2) λmax (rel I.) 422 (1.0) 529 (0.20) 763 (0.09) nm; HR-MS (ESI+, 100% CH3CN, TOF) cluster of peaks corresponding to addition of four PEG groups, see ESI.
[meso-Tris(p-hydroxyphenyl)(p-hydroxy)quinoline-annulated porphyrinato]Zinc(II) (4cZn)
Quinoline-annulated porphyrin 4c (19 mg, 2.7 × 10⁻⁵ mol) was dissolved in CH2Cl2/10% MeOH (7.0 mL) in a round bottom flask equipped with a magnetic stir bar. Zn(OAc)2·2H2O (18 mg, 8.1 × 10⁻⁵ mol, 3 equiv.) was added and the reaction was gently warmed. When the starting material was consumed (after 10 min; reaction control by TLC and UV-vis), the solvents were evaporated, and the residue was taken up in EtOAc and washed with water (3 × 20 mL). The organic layer was dried over anhydrous Na2SO4 and evaporated to dryness by rotary evaporation to afford 4cZn as an orange solid in near-quantitative yield (21 mg): Rf (silica-CH2Cl2/10% MeOH) = 0.39; 1H NMR (400 MHz, DMSO-d6): δ 10.23 (s, 1H, exchangeable with D2O), 9.94 (s, 1H, exchangeable with D2O), 9.85 (s, 1H, exchangeable with D2O), 9.57 (s, 1H, exchangeable with D2O), 8.90 (t, 3J = 7.9 Hz, 2H), 8.19 (d, 3J = 4.5 Hz, 1H), 8.05 (d, 3J = 4.6 Hz, 1H), 7.99 (dd, 3J = 12.1, 4J = 4.4 Hz, 2H), 7.76 (t, 3J = 6.4 Hz, 4H), 7.70 (d, 3J = 8.2 Hz, 2H), 7.56 (dd, 3J = 9.0, 4J = 2.4 Hz, 1H), 7.47 (d, 3J = 8.2 Hz, 2H), 7.13 (d, 3J = 8.3 Hz, 2H), 7.07 (d, 3J = 8.3 Hz, 2H), 7.00 (d, 3J = 8.2 Hz, 2H) ppm; 13C NMR (100 MHz CD2Cl2/10% MeOD): δ 195.7, 159.8, 158.1, 157.8, 157.0, 156.6, 152.7, 152.1, 150.9, 150.5, 150.1, 148.0, 146.3, 143.3, 142.7, 135.6, 135.4, 134.8, 134.6, 133.8, 133.7, 133.6, 133.52, 133.47, 133.2, 132.0, 131.2, 131.06, 130.13, 130.0, 126.7, 123.7, 121.0, 115.6, 115.0, 114.7, 114.5, 111.9 ppm; UV-vis (MeOH) λmax (log ε) 420 (5.13), 484 (sh), 518 (sh), 737 (sh), 816 (4.25) nm; FT-IR (neat, diamond ATR): ~1750 (nC=O) cm−1; HR-MS (ESI+, 100% CH3CN, TOF) m/z calcd for C44H26N5O5Zn ([M·H]+) 768.1225, found 768.1222.
p-(BODIPY)-tris-p-(OH)-quinoline-annulated porphyrin, mixture of regioisomers (4f)
meso-thiomethyl-4,4,-difluoro-4-bora-3a,4a-diaza-s-indacene 10 (6 mg, 2.7 × 10⁻⁵ mol) was dissolved in dry CH3CN (3.0 mL) in a round bottom flask equipped with a magnetic stir bar under N2 atmosphere. Tetraol 4cZn (21 mg, 2.7 × 10⁻⁵ mol, 1 equiv) was added and the mixture was stirred for 5 min under N2. Copper(I) thiophene-2-carboxylate (CuTC) (5 mg, 2.7 × 10⁻⁵ mol, 1 equiv.) and Na2CO3 (3 mg, 2.7 × 10⁻⁵ mol, 1 equiv.) were added and the reaction mixture was immersed in a pre-heated oil bath at 50 °C and stirred.27 After 48 h, a saturated aqueous NH4Cl solution was added and the reaction mixture was stirred for several hours. The resulting biphasic mixture was extracted with EtOAc (3 × 10 mL), washed with H2O (2 × 10 mL), and dried over Na2SO4. The remaining residue was purified by column chromatography (silica-CH2Cl2/10% MeOH) to afford recovered 4cZn (6 mg) and the mono-BODIPY-tagged product 4f as a series of closely running yellow fractions. The combined yellow fractions were dissolved in EtOAc (5.0 mL) and treated with 3 M HCl (5.0 mL) until the UV-vis spectrum of a neutralized aliquot indicated full demetallation. The organic layer was then washed with a sat’d aq NaHCO3 solution and H2O, and was dried over anhyd. Na2SO4 to provide 4f as a yellow film in 30% yield (7 mg): Rf (silica-CH2Cl2/10% MeOH) = 0.21; 1H-NMR (500 MHz, DMSO-d6): δ 10.09-10.07 (m, 1H, exchangeable with D2O), 9.95-9.93 (m, 1H, exchangeable with D2O), 9.69-9.64 (m, 1H, exchangeable with D2O), 9.10 (br s, 1H), 8.45 (d, 3J = 4.4 Hz, 1H), 8.4-8.37 (m, 1H), 8.18 (d, 3J = 5.2 Hz, 2H), 8.13-8.10 (m, 2H) 8.08-7.95 (m, 3H), 7.92-7.88 (m, 3H), 7.80-7.77 (m, 4H), 7.60-7.59 (m, 1H), 7.31 (s, 1H), 7.19 (d, J = 6.0 Hz, 2H), 7.12 (two overlapping d, 3J = 7.8 Hz, 2H), 7.05-7.03 (m, 2H), 6.81 (d, J = 6.1 Hz, 2H), 6.76-6.72 (m, 1H) ppm; 19F NMR (470 MHz, DMSO-d6): δ −142.1 to −142.2, (m) ppm; UV-vis (MeOH) λmax (rel I.) 400 (1.0), 443 (0.56), 510 (sh), 784 (0.1) nm; Fl (MeOH, λexcitation = 441 nm) λmax 488 nm, φ (EtOAc) = 0.01; HR-MS (ESI+, 100% CH3CN, TOF) m/z calcd for C53H33BF2N7O5 ([M·H]+) 896.2613, found 896.2613.
p-(BODIPY)-tris-p-(OPEG12)-quinoline-annulated porphyrin, mixture of regioisomers (4g)
Prepared according to the procedure for 4e from 4d (10 mg, 1.1 × 10⁻⁵ mol), MeO-PEG550-OMs (22 mg, 3.4 × 10⁻⁵ mol, 3 equiv.), 14 mg of Cs2CO3 (4.4 × 10⁻⁵ mol, 3.9 equiv.) in DMF (2.0 mL) to afford 4g as a yellow oil in 56% yield (16 mg): 1H NMR (400 MHz, CD2Cl2): δ 9.14 (s, 1H), 8.45 (s, 1H), 8.38 (d, 3J = 4.6 Hz, 1H), 8.21 (d, 4H), 8.01 (d, 3J = 6.8 Hz, 3H), 7.91 (d, 3J = 7.6 Hz, 2H), 7.73 (d, 3J = 7.2 Hz, 3H), 7.52 (s, 1H), 7.31 (d, 3J = 8.0 Hz, 4H), 7.25 (d, 3J = 5.0 Hz, 5H), 7.13-7.11 (m, 2H), 6.82 (d, 3J = 5.7 Hz, 1H), 6.46 (s, 1H), 3.35-3.3 (three overlapping s, 9H) ppm; 19F NMR (470 MHz, CD2Cl2): δ −142.1 to −142.2, (m) ppm; UV-vis (MeOH) λmax (rel I.) 402 (1.0), 473 (sh), 510, (sh), 769 (0.12) nm; Fl (MeOH, λexcitation = 441 nm) λmax 485 nm, φ (EtOAc) < 0.003; HR-MS (MALDI, 100% DHBA) cluster of peaks corresponding to addition of three PEG groups, see ESI.
Co-registered pulse-echo-photoacoustic tomography
The details to the 64 channel co-registered ultrasound pulse echo-photoacoustic tomography (PE-PAT) system is described elsewhere.30 Briefly, the system utilizes a unique field-programmable gate array (FPGA) technology that allows for real-time acquisition of ultrasound and photoacoustic signals. The photoacoustic signal is generated by a 15 Hz, 12 ns pulse width light of a tunable Ti-Sapphire laser (LT-2211, Symphotics TII Corp, Camarillo, CA) pumped by a second harmonic Nd:YAG laser (LS-2134, Symphotics TII Corp). Free space illumination is used for light delivery. The laser light is expanded by a combination of concave and convex lenses and shone on the sample using mirrors. A small portion of the beam is separated by a beam splitter (BSN11, Thorlabs) and is focused on a single element ultrasound transducer for monitoring the fluctuations in laser energy during the experiment.31 The pulse-echo (PE) ultrasound signal is generated and received by the system in synchrony with the laser pulses. The PE and PAT images are formed by a beamforming algorithm. The data sampling is performed at 40 MHz. A 64 channel ultrasound transducer with a center frequency of 3.5 MHz, a bandwidth of 80%, and a sector scan type is utilized for acquiring the co-registered PE-PAT images. Ultrasound and PAT images are overlapped to form the co-registered images. The effects of laser energy fluctuations are compensated for in the data analysis.
The setup was also used for the phantom photoacoustic signal generation efficiency evaluation of the dyes, as described previously.17
Animal protocols
All experiments involving mice were performed as approved by the Institutional Animal Care and Use Committee (IACUC) of the University of Connecticut under license #A15-047. The purity of contrast agents 4e and 4g was assessed by HPLC (see ESI). Solutions of 4e and 4g were also filtered through a syringe filter (nylon membrane, pore size 0.22 μm) prior to injection.
Toxicity test
100 μL of PBS based solution of 4e with 33.3 mM concentration was injected into anesthetized 6 week old BALB/c mice (n = 2). The heart rates of the mice were monitored by a pulse oximeter (MouseStat, Kent Scientific) before injection and during a 3 h period after injection.
Tumor model
Tumor cell preparation was adopted from the literature.32 Briefly, 4T1 Luc cells were cultured at 37 °C with 5% CO2 in a T75 flask (BD Biosciences, Bedford, MA); DMEM (Dulbecco’s Modified Eagle’s medium, Gibco, USA) medium supplemented with 10% FBS and 50 U/mL penicillin/streptomycin. After 3 passes, the cells were suspended in the DMEM and 1 × 10⁵ cells were injected subcutaneously on top of the right leg of female BALB/c mice (6–8 weeks old, body weight ~20 g). The mice were monitored for approximately two weeks post-inoculation until the tumor size was between 7–10 mm.
In vivo PAT of murine tumor
Prior to the in vivo imaging, the mice were anaesthetized (1.5 L/min oxygen with 1.5% isoflurane) and the tumor area depilated. The position of the mouse was fixed. Ultrasound gel was applied on the tumor area and a bag of water was placed on top of the tumor for acoustic wave coupling. The pulsed laser at 790 nm of the pulse-echo-photoacoustic tomography (PE-PAT) setup described above (780 nm for ICG) was shone on the tumor through the water bag; surface optical fluence on the tissue was always maintained below the maximum permissible exposure according to the ANSI safety standard.33 The transducer position was adjusted by a three-dimensional mechanical stage to reach a suitable imaging condition. The pre-injection PAT image of the tumor was acquired. Then 100 μL of the PBS based solution of the dye 4e (~33.3 mM concentration) or ICG was injected via retro-orbital injection.24 Care was taken to avoid any changes in the position of the mouse, transducer, and light beam as a result of the injection. The PAT images of the tumor were acquired during the 45 min period following injection. The PAT images and the maximum PA signal levels were compared before and after the injection. The p-values in a student t-test between the results obtained for the dye and ICG are less than 0.005 for all instances, indicating statistical significance. The schematic of the in vivo experiment setup is illustrated in Figure 7.
Figure 7.
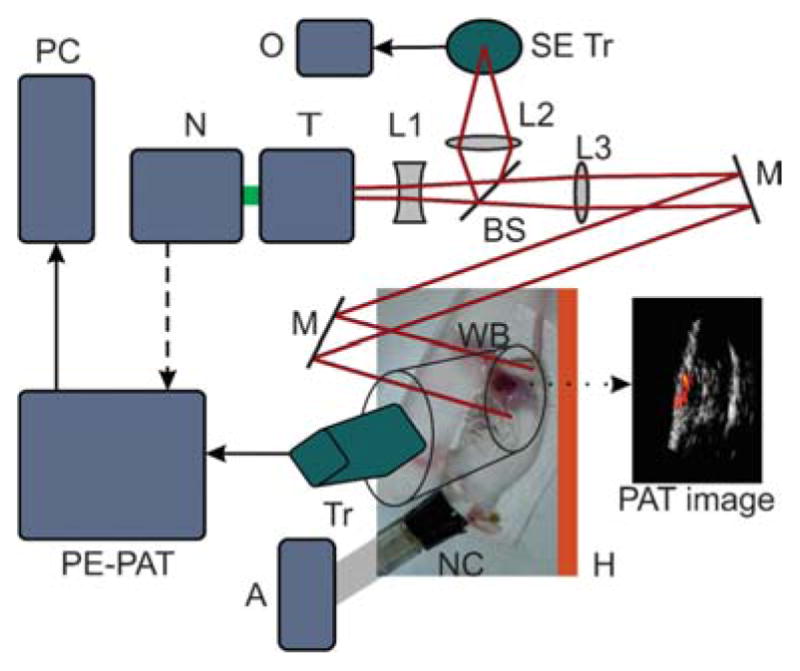
In vivo PAT experiment setup. N: Nd:YAG second harmonic laser, T: tunable Ti:sapphire laser, L1, L2, L3: lenses, BS: beam splitter, SE Tr: single element transducer for monitoring laser fluctuations, O: oscilloscope, M: mirror, WB: water bag, Tr: transducer, H: heater, NC: nose cone, A: anesthesia compound (1.5 L/min oxygen with 1.5 % isoflurane), PE-PAT: the co-registered PE-PAT system, PC: computer.
Ex vivo fluorescent imaging
100 μL of 4g (3 mM in PBS) was injected to three BALB/c mice of similar weight and similar tumor size. The mice were sacrificed 15 and 120 min after the injection. Tumor, liver, kidneys, heart, lung, and spleen were harvested, washed twice in PBS, and imaged using an IVIS® Lumina II fluorescent imaging system (Caliper Life Sciences, Hopkinton, MA); λexcitation = 465 nm, GFP emission filter.
Photophysical measurements
The photophysical measurements were performed as described previously.17
Supplementary Material
Acknowledgments
Support through NSF grant CHE-1465133 (to CB), NIH grant R01CA151570 (to QZ), and the University of Connecticut through a Research Excellence Grant, administered through the office of the VPR (to CB and QZ), is gratefully acknowledged.
Footnotes
Electronic Supplementary Information (ESI) available: Reproductions of the spectroscopic and analytical data of the novel compounds prepared. See DOI: 10.1039/x0xx00000x
References
- 1.a) Weissleder R, Pittet MJ. Nature. 2008;452:580–589. doi: 10.1038/nature06917. [DOI] [PMC free article] [PubMed] [Google Scholar]; b) Ethirajan M, Chen Y, Joshi P, Pandey RK. Chem Soc Rev. 2011;40:340–362. doi: 10.1039/b915149b. [DOI] [PubMed] [Google Scholar]; c) Schäferling M. Angew Chem Int Ed. 2012;51:3532–3554. doi: 10.1002/anie.201105459. [DOI] [PubMed] [Google Scholar]; d) Stender AS, Marchuk K, Liu C, Sander S, Meyer MW, Smith EA, Neupane B, Wang G, Li J, Cheng JX, Huang B, Fang N. Chem Rev. 2013;113:2469–2527. doi: 10.1021/cr300336e. [DOI] [PMC free article] [PubMed] [Google Scholar]; e) Huang H, Song W, Rieffel J, Lovell JF. Frontiers Phys. 2015;3 doi: 10.3389/fphy.2015.00023. Article #23. [DOI] [PMC free article] [PubMed] [Google Scholar]; f) Chang CJ, Gunnlaugsson T, James TD. Chem Soc Rev. 2015;44:4484–4486. doi: 10.1039/c5cs90065d. [DOI] [PubMed] [Google Scholar]
- 2.a) Wang LV, Hu S. Science. 2012;335:1458–1462. doi: 10.1126/science.1216210. [DOI] [PMC free article] [PubMed] [Google Scholar]; b) Beard P. Interface Focus. 2011;1:602–631. doi: 10.1098/rsfs.2011.0028. [DOI] [PMC free article] [PubMed] [Google Scholar]; c) Zhou Y, Yao J, Wang LV. J Biomed Opt. 2016;21 doi: 10.1117/1.JBO.21.6.061007. Article # 061007. [DOI] [PMC free article] [PubMed] [Google Scholar]
- 3.a) Cerussi AE, Berger AJ, Bevilacqua F, Shah N, Jakubowski D, Butler J, Holcombe RF, Tromberg BJ. Acad Radiol. 2001;8:211–218. doi: 10.1016/S1076-6332(03)80529-9. [DOI] [PubMed] [Google Scholar]; b) Wang LV, Wu H-i. Biomedical Optics: Principles and Imaging. John Wiley & Sons; Hoboken, NJ: 2012. [Google Scholar]
- 4.Yao J, Wang L, Yang JM, Maslov KI, Wong TT, Li L, Huang CH, Zou J, Wang LV. Nat Methods. 2015;12:407–410. doi: 10.1038/nmeth.3336. [DOI] [PMC free article] [PubMed] [Google Scholar]
- 5.Weber J, Beard PC, Bohndiek SE. Nat Methods. 2016;13:639–650. doi: 10.1038/nmeth.3929. [DOI] [PubMed] [Google Scholar]
- 6.Heijblom M, Piras D, Xia W, van Hespen JCG, Klaase JM, van den Engh FM, van Leeuwen TG, Steenbergen W, Manohar S. Opt Express. 2012;20:11582–11597. doi: 10.1364/OE.20.011582. [DOI] [PubMed] [Google Scholar]
- 7.a) Salehi HS, Li H, Merkulov A, Kumavor PD, Vavadi H, Sanders M, Kueck A, Brewer MA, Zhu Q. J Biomed Opt. 2016;21 doi: 10.1117/1.JBO.21.4.046006. Article # 046006. [DOI] [PMC free article] [PubMed] [Google Scholar]; b) Wang T, Yang Y, Alqasemi U, Kumavor PD, Wang X, Sanders M, Brewer M, Zhu Q. Biomed Opt Express. 2013;4:2763–2768. doi: 10.1364/BOE.4.002763. [DOI] [PMC free article] [PubMed] [Google Scholar]
- 8.a) Peer D, Karp JM, Hong S, Farokhzad OC, Margalit R, Langer R. Nat Nanotechnol. 2007;2:751–760. doi: 10.1038/nnano.2007.387. [DOI] [PubMed] [Google Scholar]; b) Wang L, Yang PP, Zhao XX, Wang H. Nanoscale. 2016;8:2488–2509. doi: 10.1039/c5nr07437a. [DOI] [PubMed] [Google Scholar]; c) Huynh E, Lovell JF, Helfield BL, Jeon M, Kim C, Goertz DE, Wilson BC, Zheng G. J Am Chem Soc. 2012;134:16464–16467. doi: 10.1021/ja305988f. [DOI] [PubMed] [Google Scholar]; d) Huynh E, Jin CS, Wilson BC, Zheng G. Bioconjugate Chem. 2014;25:796–801. doi: 10.1021/bc5000725. [DOI] [PubMed] [Google Scholar]; e) Paproski RJ, Forbrich A, Huynh E, Chen J, Lewis JD, Zheng G, Zemp RJ. Small. 2016;12:371–380. doi: 10.1002/smll.201502450. [DOI] [PubMed] [Google Scholar]; f) Ho CJH, Balasundaram G, Driessen W, McLaren R, Wong CL, Dinish US, Attia ABE, Ntziachristos V, Olivo M. Sci Rep. 2014;4 doi: 10.1038/srep05342. Article # 5342. [DOI] [PMC free article] [PubMed] [Google Scholar]
- 9.a) Lewinski N, Colvin V, Drezek R. Small. 2008;4:26–49. doi: 10.1002/smll.200700595. [DOI] [PubMed] [Google Scholar]; b) Gnach A, Lipinski T, Bednarkiewicz A, Rybka J, Capobianco JA. Chem Soc Rev. 2015;44:1561–1584. doi: 10.1039/c4cs00177j. [DOI] [PubMed] [Google Scholar]; c) Srivastava V, Gusain D, Sharma YC. Ind Eng Chem Res. 2015;54:6209–6233. [Google Scholar]
- 10.Lovell JF, Jin CS, Huynh E, Jin H, Kim C, Rubinstein JL, Chan WCW, Cao W, Wang LV, Zheng G. Nat Mater. 2011;10:324–332. doi: 10.1038/nmat2986. [DOI] [PubMed] [Google Scholar]
- 11.a) Filonov GS, Krumholz A, Xia J, Yao J, Wang LV, Verkhusha VV. Angew Chem Int Ed. 2011;51:1448–1451. doi: 10.1002/anie.201107026. [DOI] [PMC free article] [PubMed] [Google Scholar]; b) Zhang Y, Cai X, Wang Y, Zhang C, Li L, Choi SW, Wang LV, Xia Y. Angew Chem Int Ed. 2011;50:7359–7363. doi: 10.1002/anie.201101659. [DOI] [PMC free article] [PubMed] [Google Scholar]
- 12.Ashkenazi S. J Biomed Optics. 2010;15 Article # 040501. [Google Scholar]
- 13.a) Zanganeh S, Li H, Kumavor PD, Alqasemi U, Aguirre A, Mohammad I, Stanford C, Smith MB, Zhu Q. J Biomed Opt. 2013;18 doi: 10.1117/1.JBO.18.9.096006. Article # 096006; [DOI] [PMC free article] [PubMed] [Google Scholar]; b) Abuteen A, Zanganeh S, Akhigbe J, Samankumara LP, Aguirre A, Biswal N, Braune M, Vollertsen A, Röder B, Brückner C, Zhu Q. Phys Chem Chem Phys. 2013;15:18502–18509. doi: 10.1039/c3cp52193a. [DOI] [PMC free article] [PubMed] [Google Scholar]
- 14.a) Klibanov AL, Maruyama K, Torchilin VP, Huang L. FEBS Lett. 1990;268:235–237. doi: 10.1016/0014-5793(90)81016-h. [DOI] [PubMed] [Google Scholar]; b) Desmettre T, Devoisselle J, Mordon S. Surv Ophthalmol. 2000;45:15–27. doi: 10.1016/s0039-6257(00)00123-5. [DOI] [PubMed] [Google Scholar]
- 15.a) Akhigbe J, Luciano M, Zeller M, Brückner C. J Org Chem. 2015;80:499–511. doi: 10.1021/jo502511j. [DOI] [PubMed] [Google Scholar]; b) Akhigbe J, Yang M, Luciano M, Brückner C. J Porphyrins Phthalocyanines. 2016;20:265–273. [Google Scholar]; c) Akhigbe J, Zeller M, Brückner C. Org Lett. 2011;13:1322–1325. doi: 10.1021/ol1031848. [DOI] [PubMed] [Google Scholar]
- 16.a) Richeter S, Christophe J, Jean-Paul G, Romain R. In: Handbook of Porphyrin Science. Kadish KM, Smith KM, Guilard R, editors. Vol. 3. World Scientific Publishing Company; Hackensack, New Jersey: 2010. pp. 429–483. [Google Scholar]; b) Jeandon C, Ruppert R. Eur J Org Chem. 2011:4098–4102. [Google Scholar]
- 17.Abuteen A, Zanganeh S, Akhigbe J, Samankumara LP, Aguirre A, Biswal N, Braune M, Vollertsen A, Röder B, Brückner C, Zhu Q. Phys Chem Chem Phys. 2013;15:18502–18509. doi: 10.1039/c3cp52193a. [DOI] [PMC free article] [PubMed] [Google Scholar]
- 18.a) Hambright P. In: The Porphyrin Handbook. Kadish KM, Smith KM, Guilard R, editors. Vol. 3. Academic Press; San Diego: 2000. pp. 129–210. [Google Scholar]; b) Brandis A, Mazor O, Neumark E, Rosenbach-Belkin V, Salomon Y, Scherz A. Photochem Photobiol. 2005;81:983–993. doi: 10.1562/2004-12-01-RA-389. [DOI] [PubMed] [Google Scholar]; c) Borbas KE, Mroz P, Hamblin MR, Lindsey JS. Bioconjugate Chem. 2006;17:638–653. doi: 10.1021/bc050337w. [DOI] [PMC free article] [PubMed] [Google Scholar]; d) Borbas KE, Chandrashaker V, Muthiah C, Kee HL, Holten D, Lindsey JS. J Org Chem. 2008;73:3145–3158. doi: 10.1021/jo7026728. [DOI] [PMC free article] [PubMed] [Google Scholar]; e) Li Y, Wang J, Zhang X, Guo W, Li F, Yu M, Kong X, Wu W, Hong Z. Org Biomol Chem. 2015;13:7681–7694. doi: 10.1039/c5ob01035g. [DOI] [PubMed] [Google Scholar]; f) Mandal AK, Sahin T, Liu M, Lindsey JS, Bocian DF, Holten D. New J Chem. 2016;40:9648–9656. [Google Scholar]
- 19.Veronese FM, Pasut G. Drug Discovery Today. 2005;10:1451–1458. doi: 10.1016/S1359-6446(05)03575-0. [DOI] [PubMed] [Google Scholar]
- 20.Starnes SD, Rudkevich DM, Rebek J., Jr J Am Chem Soc. 2001;123:4659–4669. doi: 10.1021/ja010038r. [DOI] [PubMed] [Google Scholar]
- 21.Daniell HW, Williams SC, Jenkins HA, Brückner C. Tetrahedron Lett. 2003;44:4045–4049. [Google Scholar]
- 22.Aldrich S. Product Information, Cardiogreen. http://www.sigmaaldrich.com/content/dam/sigma-aldrich/docs/Sigma/Product_Information_Sheet/2/i2633pis.pdf.
- 23.Flock ST, Jacques SL, Wilson BC, Star WM, van Gemert MJC. Lasers Surg Med. 1992;12:510–519. doi: 10.1002/lsm.1900120510. [DOI] [PubMed] [Google Scholar]
- 24.Steel CD, Stephens AL, Hahto SM, Singletary SJ, Ciavarra RP. Lab Animal. 2008;37:26–32. doi: 10.1038/laban0108-26. [DOI] [PubMed] [Google Scholar]
- 25.a) Veronese FM, Pasut G. Drug Discovery Today. 2005;10:1451–1458. doi: 10.1016/S1359-6446(05)03575-0. [DOI] [PubMed] [Google Scholar]; b) Huang H, Wang D, Zhang Y, Zhou Y, Geng J, Chitgupi U, Cook TR, Xia J, Lovell JF. Bioconjugate Chem. 2016;27:1574–1578. doi: 10.1021/acs.bioconjchem.6b00280. [DOI] [PMC free article] [PubMed] [Google Scholar]
- 26.Boens N, Leen V, Dehaen W. Chem Soc Rev. 2012;41:1130–1172. doi: 10.1039/c1cs15132k. [DOI] [PubMed] [Google Scholar]
- 27.Flores-Rizo JO, Esnal I, Osorio-Martinez CA, Gomez-Duran CF, Banuelos J, Lopez Arbeloa I, Pannell KH, Metta-Magana AJ, Pena-Cabrera E. J Org Chem. 2013;78:5867–5877. doi: 10.1021/jo400417h. [DOI] [PubMed] [Google Scholar]
- 28.a) MacAlpine JK, Boch R, Dolphin D. J Porphyrins Phthalocyanines. 2002;6:146–155. [Google Scholar]; b) Brückner C, Ogikubo J, McCarthy JR, Akhigbe J, Hyland MA, Daddario P, Worlinsky JL, Zeller M, Engle JT, Ziegler CJ, Ranaghan MJ, Sandberg MN, Birge RR. J Org Chem. 2012;77:6480–6494. doi: 10.1021/jo300963m. [DOI] [PMC free article] [PubMed] [Google Scholar]
- 29.Benaglia M, Danelli T, Fabris F, Sperandio D, Pozzi G. Org Lett. 2002;4:4229–4232. doi: 10.1021/ol0267230. [DOI] [PubMed] [Google Scholar]
- 30.Alqasemi U, Li H, Aguirre A, Zhu Q. IEEE Trans Sonics Ultrason. 2012;59:1344–1353. doi: 10.1109/TUFFC.2012.2335. [DOI] [PMC free article] [PubMed] [Google Scholar]
- 31.Salehi HS, Wang T, Kumavor PD, Li H, Zhu Q. Biomed Opt Express. 2014;5 doi: 10.1364/BOE.5.003074. Article # 3074. [DOI] [PMC free article] [PubMed] [Google Scholar]
- 32.a) Xu Y, Zanganeh S, Mohammad I, Aguirre A, Wang T, Yang Y, Kuhn L, Smith MB, Zhu Q. J Biomed Opt. 2013;18 doi: 10.1117/1.JBO.18.6.066009. Article # 066009. [DOI] [PMC free article] [PubMed] [Google Scholar]; b) Zhou F, Zanganeh S, Mohammad I, Dietz C, Abuteen A, Smith MB, Zhu Q. Org Biomol Chem. 2015;13:11220–11227. doi: 10.1039/c5ob01460c. [DOI] [PMC free article] [PubMed] [Google Scholar]
- 33.ANSI Z136.1-2007. American National Standard for Safe Use of Lasers. American National Standards Institute Inc; 2007. [Google Scholar]
Associated Data
This section collects any data citations, data availability statements, or supplementary materials included in this article.