SUMMARY
MicroRNAs (miRNAs) perform critical functions in normal physiology and disease by associating with Argonaute proteins and downregulating partially complementary messenger RNAs (mRNAs). To identify new regulators of the miRNA pathway, we employed CRISPR-Cas9 genome-wide loss-of-function screening coupled with a fluorescent reporter of miRNA activity in human cells. Iterative rounds of screening revealed a novel mechanism whereby target engagement by Argonaute 2 (AGO2) triggers its hierarchical, multi-site phosphorylation by CSNK1A1 on a set of highly conserved residues (S824-S834), followed by rapid dephosphorylation by the ANKRD52-PPP6C phosphatase complex. Although genetic and biochemical studies demonstrated that AGO2 phosphorylation on these residues inhibits target mRNA binding, inactivation of this phosphorylation cycle globally impairs miRNA-mediated silencing. Analysis of the transcriptome-wide binding profile of non-phosphorylatable AGO2 revealed a dramatic expansion of the target repertoire bound at steady-state, effectively reducing the active pool of AGO2 on a per target basis. These findings support a model in which an AGO2 phosphorylation cycle stimulated by target engagement regulates miRNA:target interactions to maintain the global efficiency of miRNA-mediated silencing.
INTRODUCTION
The microRNA (miRNA) pathway is essential for development and homeostasis in diverse species1,2. miRNAs associate with Argonaute (AGO) proteins, which they guide to partially-complementary sites in messenger RNAs (mRNAs)3, leading to reduced stability and translation of targeted messages4. miRNAs select targets primarily through base pairing of their seed regions, nucleotides 2-7. Consequently, the potential target repertoire for a given miRNA is vast. Multiple sequence features of bona fide target sites distinguish them from non-functional sites with seed complementarity5. Nevertheless, recent experiments have demonstrated that the functional pool of targets greatly exceeds the quantity of miRNAs in mammalian cells6,7. While the intrinsic sequence characteristics of miRNA binding sites strongly influence the kinetics of AGO:target interactions8,9, it is presently unknown whether additional, active mechanisms exist that influence mRNA binding to facilitate navigation of the extensive target landscape.
RNA interference (RNAi) screens have been used to dissect the miRNA pathway in invertebrates10,11. Analogous experiments in human cells, however, have been hindered by the fact that the RNAi and miRNA pathways share common molecular machinery. This limitation may be circumvented by recent advances in CRISPR-mediated genome editing, which offers a robust alternative for genetic loss-of-function screens in human cells12,13. Here we describe the application of CRISPR-Cas9 screening to identify novel regulators of miRNA-mediated silencing. These experiments revealed that the ANKRD52-PPP6C phosphatase complex performs a critical function in the miRNA pathway by dephosphorylating a set of highly conserved amino acids in AGO2. A secondary genome-wide screen revealed CSNK1A1 as the kinase that phosphorylates AGO2 on these sites. This AGO2 phosphorylation cycle is triggered by target engagement and negatively regulates target association, yet is essential to maintain the global efficiency of miRNA-mediated silencing. Transcriptome-wide AGO2 binding studies revealed that S824-S834 phosphorylation remodels the target pool bound by AGO2 at steady-state. These data reveal a previously unrecognized mechanism that regulates AGO:target interactions to promote miRNA-mediated repression.
RESULTS
CRISPR-Cas9 screen for miRNA regulators
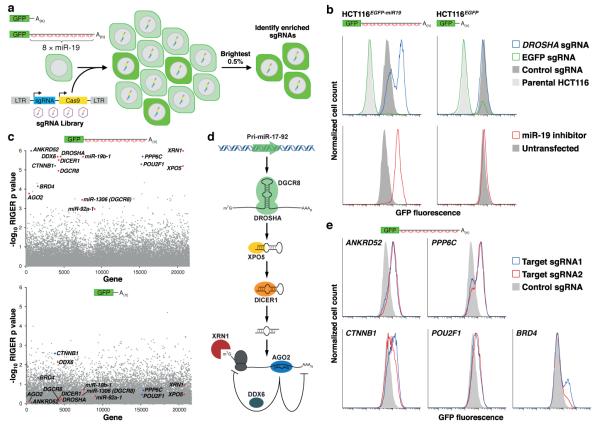
To apply CRISPR-Cas9 screening to interrogate the miRNA pathway, we first generated a cell line expressing a fluorescent reporter of miRNA activity. Enhanced green fluorescent protein (EGFP) transcripts with or without a 3' untranslated region (UTR) harboring eight imperfectly complementary binding sites for miR-19, an abundant miRNA, were expressed in the stably diploid cell line HCT11614 (Fig. 1a). The miR-19 reporter line (HCT116EGFP-miR19) but not the control line lacking miR-19 sites (HCT116EGFP), exhibited robust de-repression of EGFP upon infection with a CRISPR lentivirus targeting the essential miRNA biogenesis factor DROSHA or after transfection with an antisense miR-19 inhibitor (Fig. 1b).
Fig. 1. A genome-wide CRISPR-Cas9 screen reveals known and novel regulators of the miRNA pathway.
a, Design of CRISPR-Cas9 screen. b, Validation of reporter cell lines. EGFP fluorescence after introduction of lentiCRISPR vectors (top) or antisense miR-19 inhibitors (bottom). c, RIGER analysis of screening results in HCT116EGFP-miR19 (top) or HCT116EGFP cells (bottom). Red dots, known components of the miRNA pathway; blue dots, putative novel regulators. d, Components of the miRNA pathway identified as significant hits. e, EGFP expression in HCT116EGFP-miR19 cells after transduction with lentiCRISPR vectors.
A genome-wide CRISPR-Cas9 screen was carried out by infecting HCT116EGFP-miR19 and HCT116EGFP cells with a lentiviral library targeting over 19,000 human genes and 1864 miRNAs12,15. After 14 days of growth, the brightest 0.5% of cells, representing those with deficient miRNA-mediated silencing, were collected (Fig. 1a). Simulations demonstrated that collection of cells in this gate could theoretically yield >150-fold enrichment of highly effective sgRNAs that target essential genes in the miRNA pathway while still allowing significant enrichment of partially effective guides that incompletely impair miRNA-mediated silencing (Supplementary Table 1). sgRNA representation in the sorted and unsorted cells was enumerated by high-throughput sequencing and the RNAi Gene Enrichment Ranking (RIGER) algorithm16 was used to identify genes targeted by multiple enriched sgRNAs, representing high-confidence hits (Supplementary Tables 2-3). A large number of established components of the miRNA pathway and miR-19 itself were identified as significant hits in HCT116EGFP-miR19 but not HCT116EGFP cells (Fig. 1c,d), establishing the sensitivity of this approach.
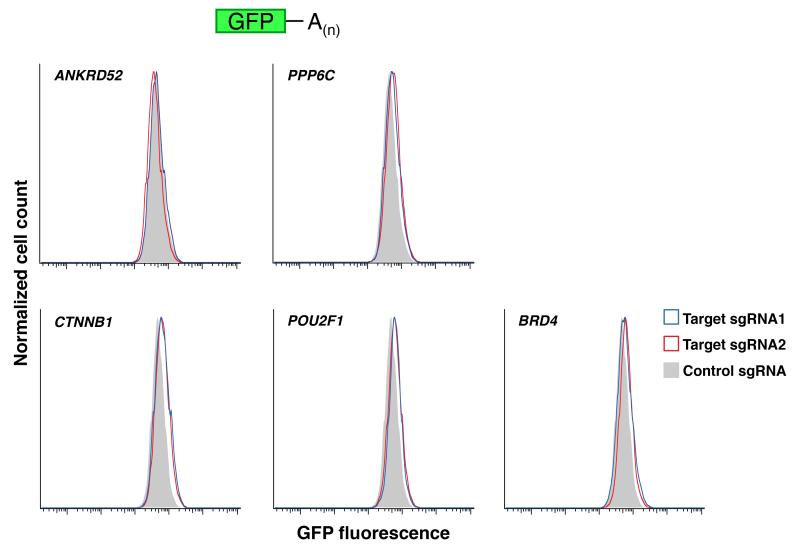
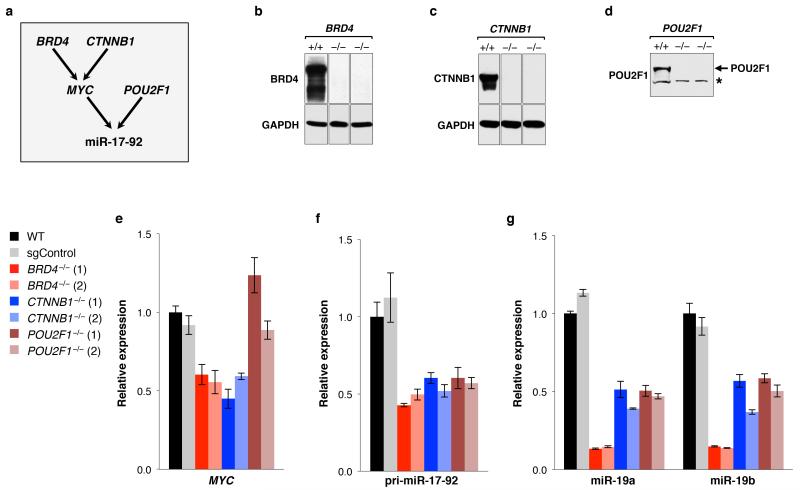
We noted two classes of highly ranked hits without a previously defined role in the miRNA pathway: transcriptional regulators (BRD4, CTNNB1, and POU2F1) and interacting components of the serine/threonine protein phosphatase 6 (PPP6) complex (ANKRD52 and PPP6C)17. Loss of function of any of these genes measurably de-repressed EGFP in HCT116EGFP-miR19 but not HCT116EGFP cells (Fig. 1e and Extended Data Fig. 1). CTNNB1 and BRD4 promote MYC expression18,19, a known positive regulator of transcription of the miR-19 host transcript (pri-miR-17-92)20. Accordingly, analysis of MYC, pri-miR-17-92, and mature miR-19 levels in CTNNB1−/−, BRD4−/−, and POU2F1−/− cells provided evidence that CTNNB1 and BRD4 indirectly regulate transcription of miR-19 through MYC (Extended Data Fig. 2). POU2F1, in contrast, promotes pri-miR-17-92 transcription through a MYC-independent mechanism that may include interaction with a binding site in the promoter, as proposed previously21.
ANKRD52 and PPP6C dephosphorylate AGO2
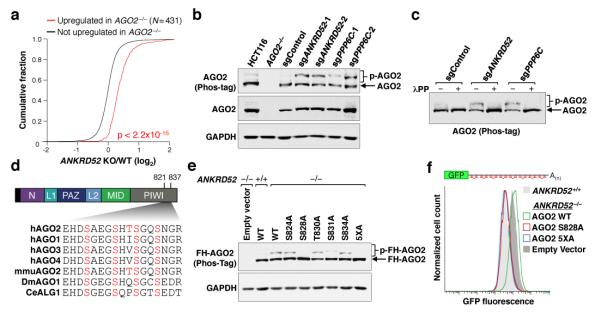
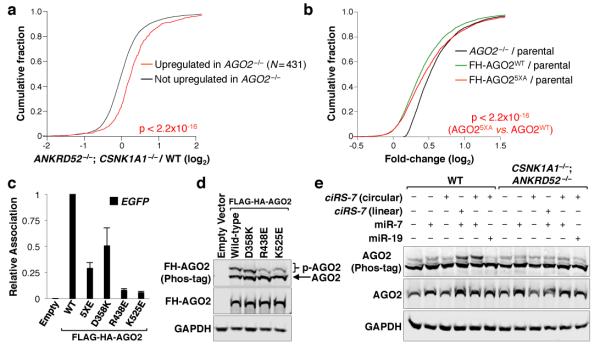
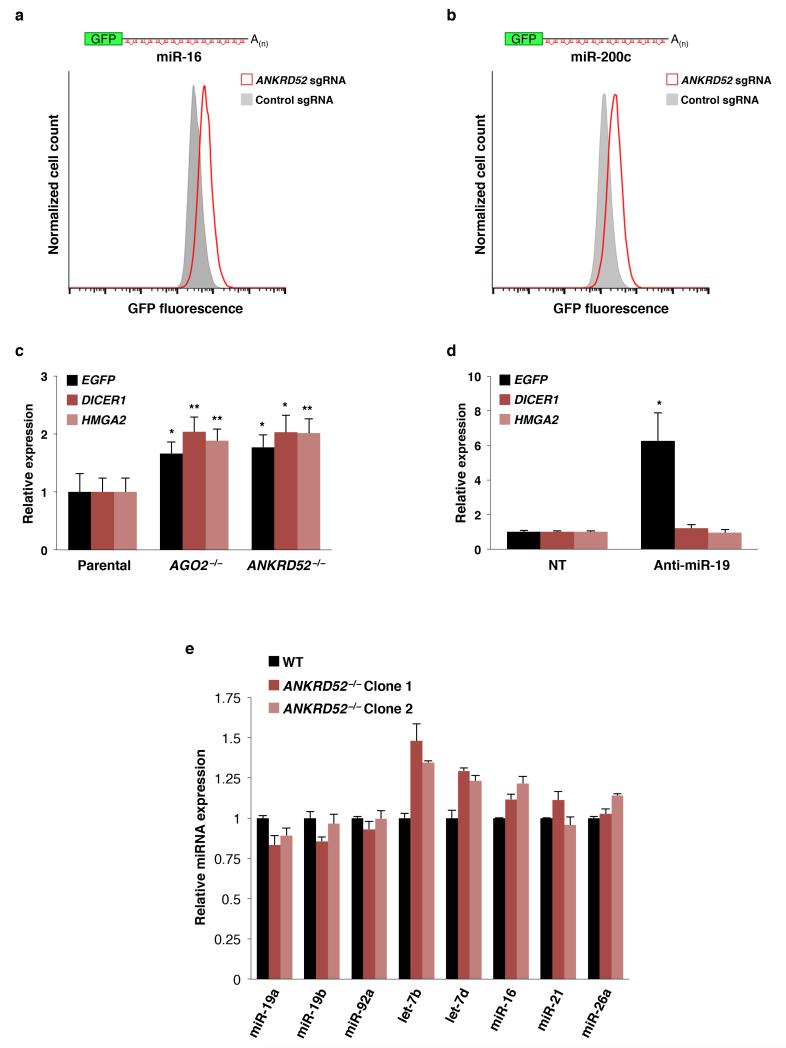
The identification of ANKRD52 and PPP6C as significant hits suggested that phosphorylation regulates the activity of an essential miRNA pathway component. Confirming a general impairment of miRNA-mediated silencing in cells deficient for this phosphatase complex, RNA-seq demonstrated that genes upregulated in AGO2−/− cells were similarly upregulated in ANKRD52−/− cells (Fig. 2a, Extended Data Fig. 3, Supplementary Table 4). Additional miRNA reporter constructs and endogenous let-7 targets22-24 were also de-repressed by ANKRD52 knockout (Extended Data Fig. 4a-d). The steady-state abundance of representative miRNAs was not decreased (Extended Data Fig. 4e), indicating that the ANKRD52-PPP6C complex does not globally regulate miRNA biogenesis.
Fig. 2. Loss of ANKRD52-PPP6C activity globally impairs miRNA-mediated silencing and results in AGO2 hyperphosphorylation.
a, Cumulative distribution function (CDF) plot demonstrating that genes upregulated in AGO2−/− HCT116 cells (Supplementary Table 4; FDR ≤ 0.05) are similarly upregulated in ANKRD52−/− cells. Kolmogorov-Smirnov (KS) p value shown for this and all subsequent CDF plots. b, c, Phos-tag electrophoresis demonstrating enhanced AGO2 phosphorylation in ANKRD52/PPP6C-deficient HCT116 cells (b) and sensitivity of AGO2 phosphorylation to lambda protein phosphatase (λPP) (c). d, Evolutionary conservation of AGO2 S824-S834. Putative phosphorylation sites shown in red. e, Phos-tag analysis of FH-AGO2 mutants stably expressed in ANKRD52−/− cells. f, EGFP expression in ANKRD52−/− HCT116EGFP-miR19 cells expressing the indicated FH-AGO2 constructs. For gel source data, see Supplementary Figure 1.
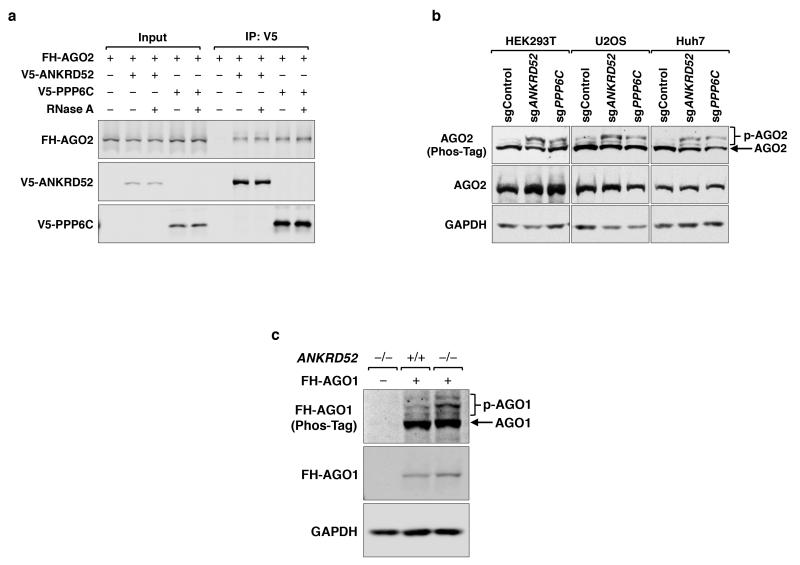
Due to their central role in miRNA-mediated silencing, we hypothesized that Argonaute proteins may be dephosphorylated by ANKRD52-PPP6C. AGO2 and ANKRD52-PPP6C interacted in an RNA-independent manner (Extended Data Fig. 5a). Phos-tag electrophoresis, a sensitive method for detection of phosphorylated proteins25, revealed that AGO2 migrated as a doublet, with dramatic enhancement of the slowly migrating form in ANKRD52- or PPP6C-deficient cells (Fig. 2b). Phosphatase treatment confirmed that the more slowly migrating species corresponded to phosphorylated AGO2 (p-AGO2; Fig. 2c). Deficiency of ANKRD52 or PPP6C in multiple human cell lines similarly led to accumulation of phosphorylated AGO2 (Extended Data Fig. 5b). We also observed enhanced phosphorylation of AGO1 in ANKRD52−/− cells (Extended Data Fig. 5c), suggesting broader regulation of Argonaute proteins by the ANKRD52-PPP6C complex.
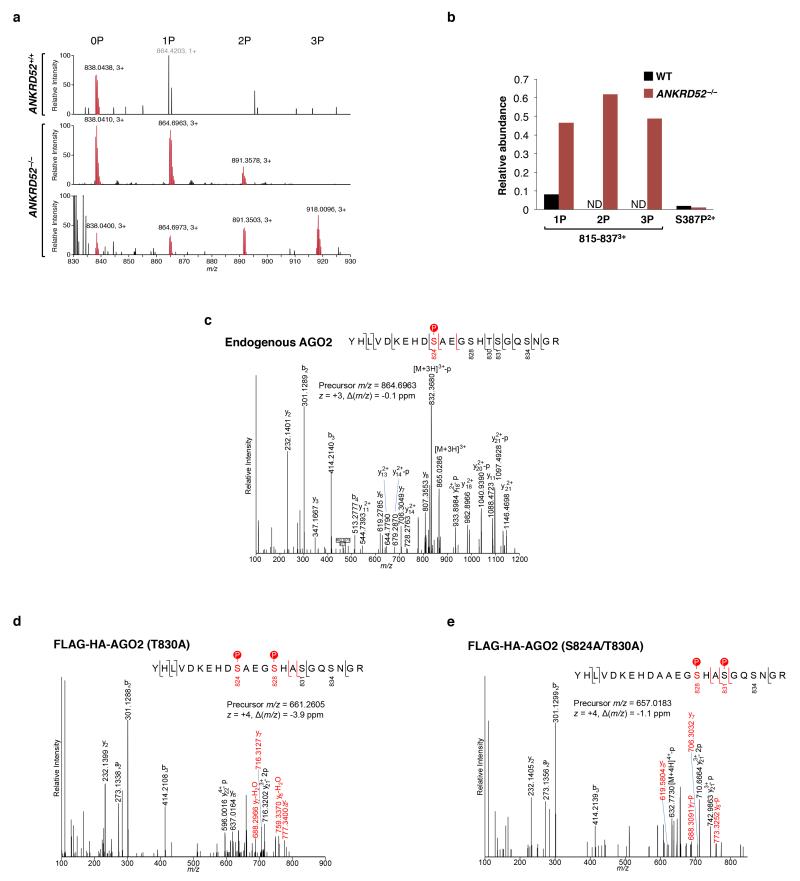
Mass spectrometry was used to identify the relevant phosphoresidue(s) in endogenous AGO2. Enhanced phosphorylation within a region of the PIWI domain containing four highly conserved serine residues and a single poorly conserved threonine residue (S824-S834) was detected in ANKRD52−/− cells, while the previously reported phosphorylation of S387 was not increased (Fig. 2d, Extended Data Fig. 6a,b) 26. Triply phosphorylated peptides spanning S824-S834 were detected, with definitive detection of p-S824 (Extended Data Fig. 6c). Although close spacing prevented the assignment of additional phosphorylations to specific residues, mass spectrometry using AGO2 alanine mutants allowed definitive identification of phosphorylation at S828 and S831 (Extended Data Fig. 6d,e). Confirming these results, mutating all five serine/threonine residues in this region to alanine (5XA) completely abolished the Phos-tag p-AGO2 band (Fig. 2e). Interestingly, a single S828A mutation also fully abolished the AGO2 mobility shift, suggesting that phosphorylation of this residue may be necessary to trigger hierarchical phosphorylation of additional amino acids within this region. Importantly, expression of AGO25XA or AGO2S828A, but not wild-type AGO2, rescued repression of the miR-19 EGFP reporter in ANKRD52−/− cells (Fig. 2f), demonstrating that the defect in miRNA-mediated silencing caused by loss of ANKRD52 was specifically due to hyperphosphorylation of AGO2 at S824-S834.
Phosphorylation inhibits target binding
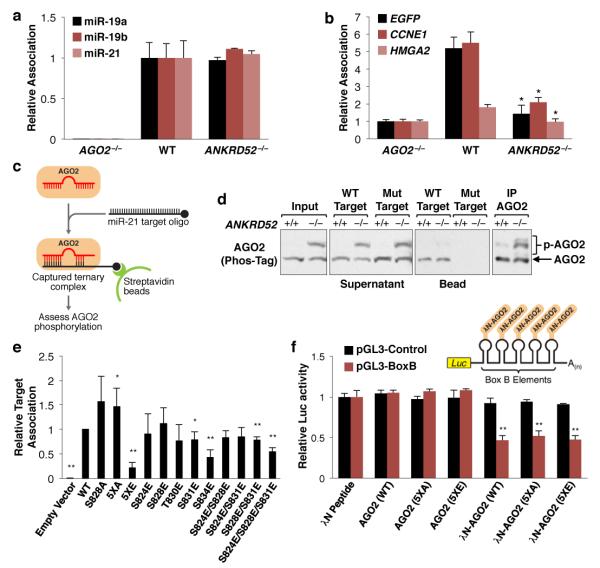
AGO2 S824-S834 is within a structurally unresolved loop of the PIWI domain that is located in the vicinity of the miRNA:target interface27,28. We therefore hypothesized that phosphorylation in this region may reduce miRNA and/or target association. Immunopurification of endogenous AGO2 from ANKRD52+/+ or ANKRD52−/− cells demonstrated equivalent miRNA association (Fig. 3a). In contrast, AGO2 target association was significantly reduced in ANKRD52−/− cells, as determined by assessing AGO2 binding to the miR-19 EGFP reporter transcript and two established targets of miR-16 or let-7 (Fig. 3b)22,23,29. To confirm these findings, AGO2:miRNA complexes were captured with an RNA oligonucleotide that mimics a target of miR-21, an abundant miRNA in HCT116 cells30,31 (Fig. 3c). Whereas unphosphorylated AGO2 was efficiently recovered using this approach, binding of phosphorylated AGO2 to the synthetic target was dramatically decreased (Fig. 3d). Importantly, both phosphorylated and unphosphorylated forms of AGO2 were efficiently recovered by immunoprecipitation using an anti-AGO2 antibody, demonstrating that the relevant phosphoresidues were stable under these conditions.
Fig. 3. AGO2 phosphorylation impairs mRNA target association.
a, Measurement of AGO2-associated miRNA by qRT-PCR. N = 2 biological replicates each assayed in triplicate. Error bars indicate SD for this and all subsequent qRT-PCR data. b, AGO2-target association assessed as described in (a). *p < 0.05, two-tailed student’s t test comparing ANKRD52−/− to WT. c, d, Schematic (c) and phos-tag western blot (d) of AGO2:miRNA target capture experiment. e, EGFP target association of FH-AGO2 assessed as described in (a). *p < 0.05; **p < 0.001, two-tailed student’s t test (N = 4 biological replicates). f, AGO2 tethering experiments demonstrating repression of luciferase-BoxB (pGL3-BoxB) by λN-AGO2 (WT), λN-AGO2 (5XA), and λN-AGO2 (5XE), but not by untethered AGO2 or λN alone. A luciferase transcript lacking BoxB sites (pGL3-Control) served as a negative control. *p < 0.05; ** p < 0.01, two-tailed student’s t test (N = 3 biological replicates). For gel source data, see Supplementary Figure 1.
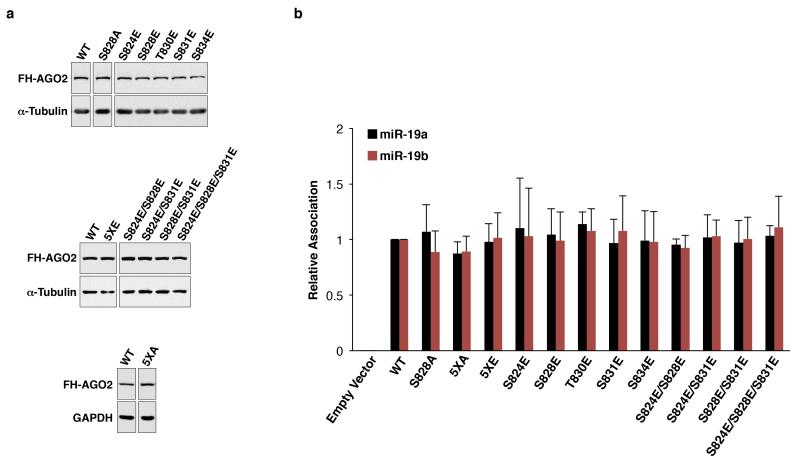
A series of phosphomimetic mutants were generated to identify the specific phosphoresidues that impair AGO2 target association (Extended Data Fig. 7a). As expected, none of the mutations measurably decreased miRNA association (Extended Data Fig. 7b). In contrast, target association was significantly impaired by mutation of all five serine and threonine residues in the S824-S834 region to glutamic acid (5XE) and, more importantly, individual mutations or combinations of mutations that mimic definitive phosphorylation sites documented by mass spectrometry (S831E, S828E/S831E, and S824E/S828E/S831E) (Fig. 3e). Notably, mutation of S828 or all serines and threonines in this region to alanine (S828A or 5XA, respectively) did not inhibit target interaction. Consistent with an isolated effect of S824-S834 phosphorylation on target binding, tethering AGO2WT, AGO25XE, or AGO25XA to a luciferase transcript using the λN peptide-boxB system32 resulted in equivalent repression (Fig. 3f). Taken together, these findings establish that phosphorylation of S824-S834 potently and specifically inhibits AGO2:target interactions.
CSNK1A1 is the inhibitory AGO2 kinase
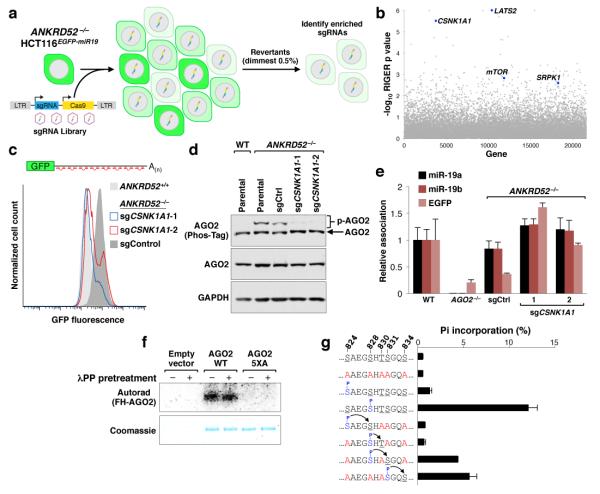
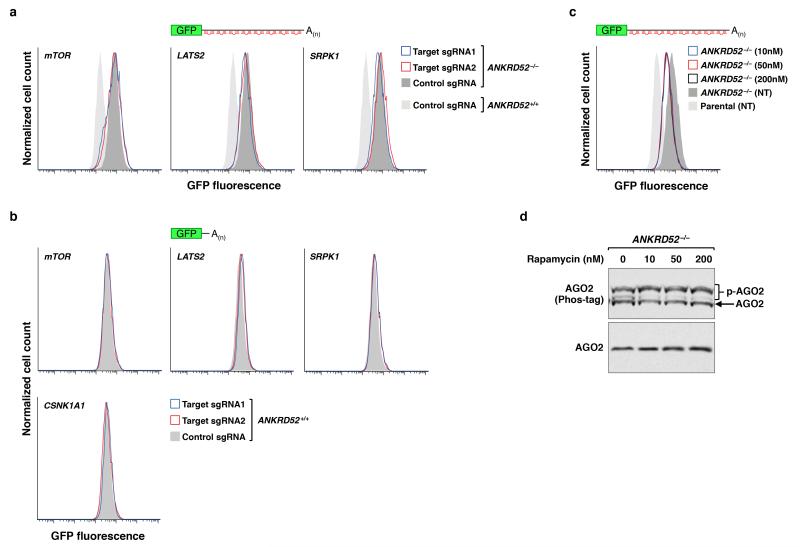
We next sought to identify the kinase that initiates this inhibitory mechanism. Reasoning that loss of function of the kinase would rescue miRNA-mediated silencing in the ANKRD52-deficient state, we performed a secondary genome-wide CRISPR-Cas9 screen in ANKRD52−/− HCT116EGFP-miR19 cells and collected the dimmest 0.5% of cells (Fig. 4a). RIGER analysis revealed four serine/threonine kinases among the top 100 hits: LATS2, CSNK1A1, mTOR, and SRPK1 (Fig. 4b, Supplementary Table 5). Knockout of LATS2 or SRPK1 in the ANKRD52−/− background resulted in minimal to no recovery of EGFP repression (Extended Data Fig. 8a,b). mTOR knockout or inhibition with rapamycin moderately rescued EGFP repression but did not influence AGO2 phosphorylation (Extended Data Fig. 8a,c,d). In stark contrast, knockout of CSNK1A1 in ANKRD52−/− cells (Extended Data Fig. 9a) fully rescued repression of the EGFP reporter without increasing miR-19 levels (Fig. 4c and Extended Data Fig. 9b), greatly reduced AGO2 phosphorylation (Fig. 4d), and restored AGO2 target association (Fig. 4e).
Fig. 4. A CRISPR-Cas9 suppressor screen reveals CSNK1A1 as the inhibitory AGO2 kinase.
a, Design of CRISPR-Cas9 screen to identify ANKRD52−/− suppressors. b, RIGER analysis with serine/threonine kinases highlighted. c, EGFP expression in ANKRD52−/− HCT116EGFP-miR19 cells transduced with lentiCRISPR vectors targeting CSNK1A1. d, Abrogated phosphorylation of AGO2 in ANKRD52−/−; CSNK1A1−/− cells. e, Relative association of miR-19a, miR-19b and EGFP target mRNA with AGO2 assessed as described in Fig. 3a (N = 3 biological replicates). f, In vitro phosphorylation of FH-AGO2 by CSNK1A1 with or without pre-treatment with λPP. g, In vitro CSNK1A1-mediated phosphorylation of the indicated peptides. For gel source data, see Supplementary Figure 1.
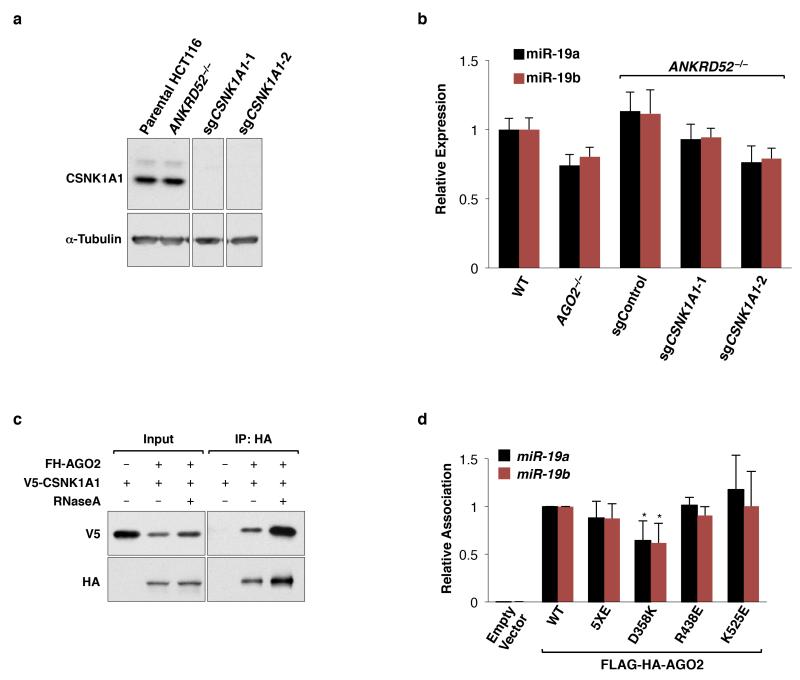
Co-immunoprecipitation demonstrated an RNA-independent interaction between CSNK1A1 and AGO2 (Extended Data Fig. 9c). Moreover, the casein kinase I family, of which CSNK1A1 is a member, prefers previously phosphorylated substrates conforming to the consensus (pS/pT/D/E)-X1-2-S/T, with the latter S/T representing the phospho-acceptor site33,34. The five serine/threonine residues within AGO2 S824-S834 all conform to this consensus motif, with S824 and S828 preceded by acidic residues and T830, S831, and S834 having the potential to be primed by hierarchical phosphorylation initiating at S828. Phosphorylation of full-length wild-type AGO2 but not AGO25XA by recombinant CSNK1A1 was robustly detectable in vitro, with or without pre-treatment with phosphatase to remove potential priming phosphorylations (Fig. 4f). To investigate potential hierarchical phosphorylation of these residues, CSNK1A1 kinase assays were performed with a series of phospho-peptides encompassing amino acids 824-834 of AGO2 (Fig. 4g). Unphosphorylated peptide was a poor substrate for CSNK1A1 under these conditions, suggesting that initial phosphorylation of this region is facilitated by contextual features present in full-length AGO2. pS824 only weakly stimulated further phosphorylation. Prior phosphorylation of S828, however, robustly promoted phosphorylation of S831 (but not T830), while pS831 efficiently primed phosphorylation of S834. Taken together with our earlier data demonstrating a critical role for S828 in phosphorylation of AGO2 in cells (Fig. 2e), these findings support a model whereby initial phosphorylation of S828, and potentially S824, stimulates efficient hierarchical phosphorylation of S831 followed by S834, rendering AGO2 incompetent for target binding until returned to an active state by ANKRD52-PPP6C phosphatase activity.
Target binding triggers phosphorylation
Although deficiency of AGO2 S824-S834 phosphorylation was compatible with fully-efficient silencing of the miR-19 EGFP reporter (Fig. 4c), RNA-seq revealed that genes that are upregulated in AGO2−/− cells were similarly upregulated in CSNK1A1−/−; ANKRD52−/− double knockout cells (Fig. 5a, Supplementary Table 4). These findings suggested that AGO2 S824-S834 phosphorylation is necessary for efficient silencing of endogenous miRNA targets. Further supporting this conclusion, AGO2−/− cells stably reconstituted with AGO25XA exhibited a highly significant defect in miRNA-mediated repression compared to cells reconstituted with AGO2WT (Fig. 5b, Extended Data Fig. 10a, Supplementary Table 6).
Fig. 5. Argonaute S824-S834 phosphorylation is required for fully efficient miRNA-mediated silencing and is triggered by target binding.
a, CDF plot demonstrating that genes upregulated in AGO2−/− HCT116 cells (Supplementary Table 4; FDR ≤ 0.05) are similarly upregulated in CSNK1A1−/−; ANKRD52−/− cells. b, CDF plot showing partially rescued repression of genes upregulated in AGO2−/− cells (Supplementary Table 6; FDR ≤ 0.05) reconstituted with FH-AGO25XA compared to cells reconstituted with FH-AGO2WT. c, EGFP target association of FH-AGO2 assessed as in Fig. 3e (N = 4 biological replicates, each assayed in triplicate). d, e, Phosphorylation of AGO2 mutants in ANKRD52−/− cells (d) or endogenous AGO2 after transfection of ciRS-7 constructs and the indicated miRNAs (e). For gel source data, see Supplementary Figure 1.
Given that this newly-described AGO2 phosphorylation cycle is constitutively active in mammalian cell lines, is necessary to maintain the efficiency of miRNA-mediated silencing, and regulates target binding, we postulated that S824-S834 phosphorylation may be triggered by target engagement itself. To test this hypothesis, we first generated AGO2 mutants with an isolated deficiency in target binding, guided by the structure of AGO2 in complex with a miRNA and target35. Two mutations, R438E and K525E, dramatically reduced target binding without affecting miRNA association, while a third mutation, D358K, partially inhibited both target binding and miRNA association (Fig. 5c, Extended Data Fig. 9d). Phosphorylation of AGO2R438E and AGO2K525E, but not AGO2D358K, was strongly impaired (Fig. 5d), consistent with a role for target binding in facilitating AGO2 phosphorylation.
To directly test whether engagement of a target can trigger AGO2 phosphorylation, HCT116 cells were transfected with constructs that express circular or linear forms of circular RNA sponge for miR-7 (ciRS-7), a previously described transcript with over 70 binding sites for miR-736. Expression of these transcripts along with miR-7, which is not normally expressed in HCT116 cells, was sufficient to trigger robust AGO2 phosphorylation in a CSNK1A1-dependent manner (Fig. 5e). These findings demonstrate that target engagement is a strong trigger for AGO2 S824-S834 phosphorylation.
Phosphorylation remodels AGO2 targeting
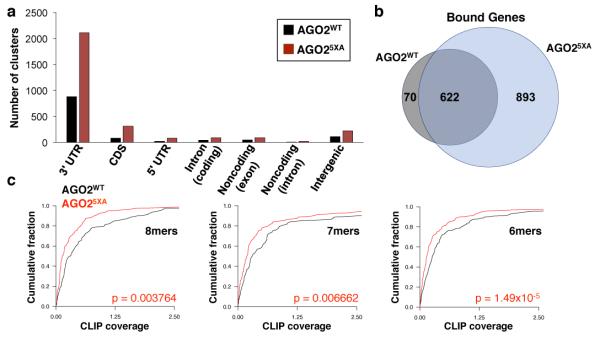
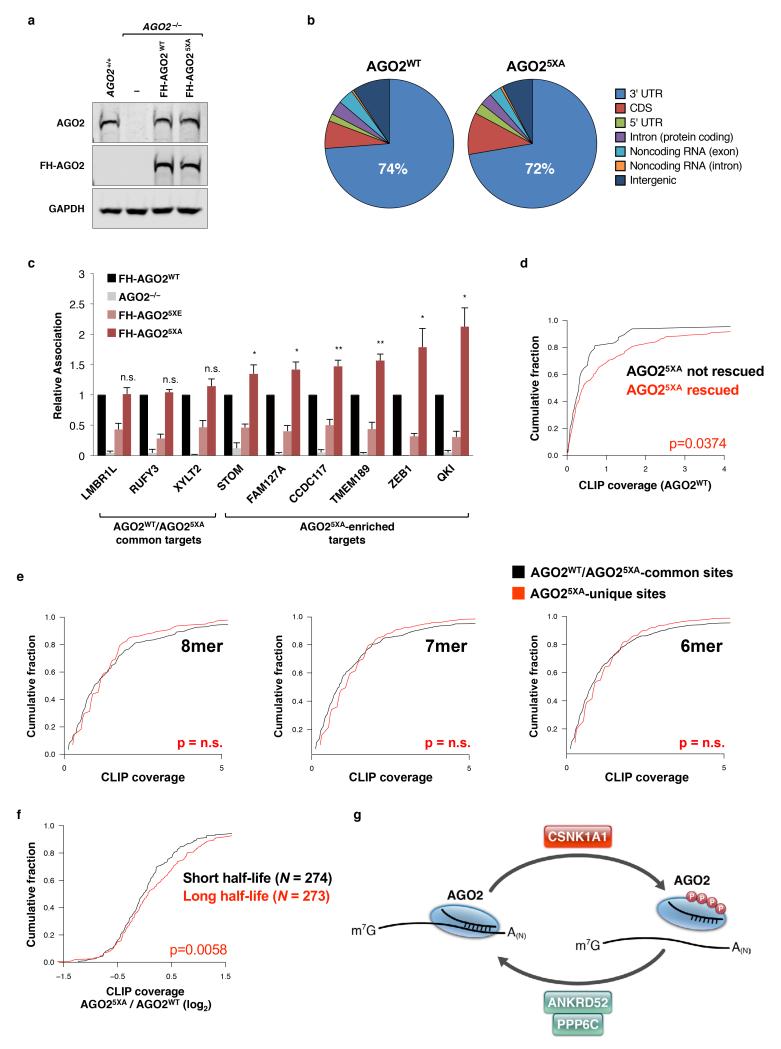
Lastly, to investigate why loss of AGO2 S824-S834 phosphorylation impairs miRNA-mediated silencing, we examined the transcriptome-wide target binding profiles of AGO2WT and AGO25XA using Enhanced Crosslinking Immunoprecipitation (eCLIP)37. Whereas both AGO2WT and AGO25XA bound primarily to sites within mRNA 3′ UTRs (Fig. 6a, Extended Data Fig. 10b, Supplementary Table 7), AGO25XA had more than twice as many detectable binding sites (2921 CLIP clusters for AGO25XA versus 1190 clusters for AGO2WT). While this corresponded to more than twice as many genes bound by AGO25XA, virtually all genes bound by AGO2WT were also bound by AGO25XA (Fig. 6b). Thus, loss of AGO2 S824-S834 phosphorylation dramatically expands the target repertoire bound by AGO2 at steady-state. AGO2 immunoprecipitation confirmed enhanced binding of AGO25XA to representative targets identified by CLIP (Extended Data Fig. 10c).
Fig. 6. Expansion of the target repertoire bound by AGO25XA.
a, Number of AGO2 binding sites determined by eCLIP. b, Unique and common genes bound by FH-AGO2WT and FH-AGO25XA. c, Binding sites for active miRNAs in HCT116 were identified within FH-AGO2WT CLIP clusters in 3' UTRs. CDF plots show CLIP coverage for each class of site (normalized number of crosslinking events within 10 nucleotides of each site divided by FPKM of the transcript) in FH-AGO2WT and FH-AGO25XA datasets.
A significant expansion of binding sites would be expected to reduce the pool of AGO25XA that is available to interact with and silence any given individual target. Indeed, targets of wild-type AGO2 with 8mer, 7mer, or 6mer miRNA binding sites showed reduced binding by AGO25XA (Fig. 6c). This finding offers a plausible explanation for the global defect in miRNA-mediated silencing observed in AGO25XA-reconstituted cells (Fig. 5b). Nevertheless, silencing of some transcripts, including the miR-19 EGFP reporter, was not impaired by loss of AGO2 S824-S834 phosphorylation (Fig. 4c). We speculated that transcripts that are efficiently repressed by AGO25XA represent particularly strong targets that are able to compete effectively for AGO2 binding against the expanded AGO25XA target pool. Consistent with this hypothesis, genes whose repression was rescued by expression of AGO25XA in AGO2−/− cells exhibited greater wild-type AGO2 CLIP coverage (Extended Data Fig. 10d), indicating that they are stronger miRNA targets.
Finally, we sought to identify features of transcripts that are preferentially bound by AGO25XA. Interestingly, the frequency of AGO25XA crosslinking to seed matches was equivalent between clusters uniquely identified by AGO25XA CLIP and clusters that were common to AGO2WT and AGO25XA (Extended Data Fig. 10e). This suggested that the additional sites identified by AGO25XA CLIP are bona fide miRNA binding sites that are uniquely detected due to a prolonged AGO2:target interaction that occurs in the absence of the phosphorylation cycle. In light of this, we reasoned that transcript half-life may influence the relative binding of AGO25XA versus AGO2WT, since association with slowly decayed transcripts would provide greater opportunity for AGO phosphorylation relative to transcripts that are rapidly decayed. Transcripts bound by AGO25XA were classified based on published transcriptome-wide half-life measurements38. Indeed, transcripts with long half-lives exhibited greater binding by AGO25XA relative to AGO2WT compared to transcripts with short half-lives (Extended Data Fig. 10f).
DISCUSSION
This study describes the application of genome-wide CRISPR-Cas9 screening coupled with a fluorescent reporter to interrogate the miRNA pathway. An in depth analysis of the ANKRD52-PPP6C phosphatase complex, identified as a major regulator of the miRNA pathway through this approach, unexpectedly revealed that continual transient phosphorylation of AGO2 is required to maintain the global efficiency of miRNA-mediated repression. Our experiments demonstrated that target engagement by AGO2 stimulates its hierarchical, multi-site phosphorylation by CSNK1A1 on a series of highly conserved residues (S824-S834) (Extended Data Fig. 10g). Although this impairs target binding, dephosphorylation by ANKRD52-PPP6C allows AGO2 to engage new targets. Inactivation of this cycle strongly inhibits global miRNA-mediated repression.
Given that AGO2 S824-S834 phosphorylation impairs target association, why is continual phosphorylation/dephosphorylation of these residues necessary for efficient miRNA activity? Transcriptome-wide analyses of AGO2 targets suggest that this silencing defect is attributable to a dramatic expansion of the target repertoire bound by non-phosphorylatable AGO2 at steady-state, effectively reducing the pool of active AGO2 on a per target basis. Multiple potential mechanisms may contribute to this effect. First, it is possible that AGO:target interactions are much more stable in vivo than suggested by in vitro measurements8,9. In this case, AGO could potentially persist on a target longer than is necessary to trigger a productive silencing interaction. Given that target levels greatly exceed miRNA levels in mammalian cells6,7, active disassembly of AGO:target complexes via S824-S834 phosphorylation would thereby effectively increase AGO availability to silence additional targets. Structural studies have revealed AGO2 conformational changes induced by target engagement35. While S824-S834 are unresolved in existing AGO structures, it is possible that target binding exposes these sites to the activity of CSNK1A1, providing a timing mechanism that limits the duration of target interaction. This model is consistent with our finding of enriched binding of non-phosphorylatable AGO2 to transcripts with long half-lives since the stable association of AGO2 with slowly decayed transcripts would provide a greater opportunity for CSNK1A1 phosphorylation relative to mRNA targets that are rapidly degraded. AGO phosphorylation might be further stimulated by the successful recruitment of additional silencing factors such as the CCR4-NOT deadenylase complex and/or DDX6, indicating the completion of a productive silencing interaction. An alternative, non-mutually exclusive model to account for greater association of AGO25XA with specific targets posits the existence of additional features, such as sites for RNA binding proteins, that promote AGO phosphorylation, thus actively disfavoring stable AGO association. This would effectively focus AGO activity on a subset of the possible targets in a cell, facilitating their productive repression. Further characterization of the distinguishing features of targets that most efficiently promote AGO2 phosphorylation will help resolve these uncertainties.
In the context of these models, the conservation pattern of these phosphorylation sites may be informative. In particular, while the relevant serines are conserved in Drosophila AGO1 (Fig. 2d), which carries out miRNA-mediated repression, these sites are absent in Drosophila AGO2, which performs siRNA-mediated target slicing. Single molecule studies have documented accelerated AGO dissociation following target cleavage8,9, potentially obviating the need for phosphorylation to facilitate Drosophila AGO2 target disengagement. On the other hand, the deep evolutionarily conservation of these phosphorylation sites in Argonaute proteins that carry out miRNA-mediated repression strongly suggests that this phosphorylation cycle is a broadly utilized mechanism to optimize miRNA activity in diverse species. In addition, the potent inhibitory effect of S824-S834 phosphorylation would provide a powerful mechanism to regulate the global activity of the miRNA pathway by upstream signaling pathways. This possibility highlights the importance of future studies to examine this newly-discovered Argonaute phosphorylation cycle in diverse developmental, physiologic, and pathophysiologic contexts.
Methods
Cell culture
Cell lines used in this study were obtained from ATCC and cultured under standard conditions. HCT116 cells were authenticated by karyotyping. All cell lines were confirmed to be free of mycoplasma contamination.
Construction of EGFP miRNA reporters
EGFP was PCR amplified from EGFP-hAGO2 (Addgene #21981) and cloned into pMSCV-Puro (Clontech) using the BglII and XhoI restriction sites. The puromycin resistance cassette was then removed by EcoRI and ClaI digestion and replaced with an insert containing eight imperfect miR-19 binding sites [modeled from39], synthesized as a gBlock (IDT) (sequence in Supplementary Table 8). For EGFP only reporter, the puromycin resistance cassette was removed by EcoRI and ClaI digestion followed by re-ligation after filling-in overhangs.
Reporters for miR-16 and miR-200c were generated by replacing the puromycin cassette in the pMSCV-Puro vector containing EGFP by digesting with EcoRI and ClaI and ligating in oligonucleotides containing single miRNA binding sites (sequences in Supplementary Table 8). Multiple cloning cycles were performed using MfeI and ClaI to generate the final reporters containing eight total binding sites.
Generation of HCT116 reporter cell lines
MSCV-EGFP, MSCV-EGFP-miR-19, MSCV-EGFP-miR-16, and MSCV-EGFP-miR-200 retrovirus was generated by first seeding 6×10⁵ cells per well in a 6-well dish. The following day, cells were transfected using 1 μg of plasmid (MSCV-EGFP or MSCV-EGFP-miR-19), 3 μL of FuGENE HD (Promega), and 200 μL Opti-MEM (Thermo Fisher) per well according to manufacturer’s instructions. Media were changed the next day. Two days after transfection, media were collected and passed through a 0.45 μm SFCA sterile filter. Recipient HCT116 cells were transduced overnight at an MOI of approximately 0.2 using media supplemented with 8 μg/mL polybrene (EMD Millipore). Cells expressing EGFP were enriched by FACS and single-cell clonal lines were derived.
Generation of knockout cell lines using CRISPR-Cas9
Heterogeneous knockout cell populations were generated using lentiCRISPR v2 (Addgene #52961) or lentiCRISPR-hygro. lentiCRISPR-Hygro was constructed by replacing the puromycin resistance ORF in lentiCRISPR v2 with a hygromycin resistance ORF. A silent mutation was introduced into a BsmBI restriction site within the hygromycin resistance ORF to prevent fragmentation of the vector when cloning sgRNA oligos. sgRNA sequences (Supplementary Table 8) were cloned as described previously12. An sgRNA targeting an irrelevant gene (PPID) or a non-targeting guide were used as negative controls.
To generate active lentivirus, 6×10⁵ 293T cells were first seeded in 6-well dishes and transfected the following day using a 5:3:2 ratio of lentiCRISPR:psPAX2 (Addgene #12260):pMD2.G (Addgene #12259) using FuGENE HD and 1 μg of total plasmid per well. Media were changed the next day. Two days after transfection, media were collected and passed through a 0.45 μm SFCA sterile filter. Media containing the virus were diluted 1:1 with fresh media and used to transduce recipient cells overnight in a final polybrene concentration of 8 μg/mL. Media were changed 24 hours later, and cells were split into fresh media containing 1 μg/mL puromycin 48 hours after transduction.
To generate clonal knockout lines, single-cell cloning was performed after infection with lentiCRISPR v2, lentiCRISPR-hygro, or after transient transfection of PX330 (Addgene #42230) targeting the gene of interest. lentiCRISPR v2-derived clones were used in Figs. 2d, 4d, 4e, 5a, 5e, Extended Data Fig. 2, Extended Data Fig. 4e, Extended Data Fig. 5c, and Extended Data Fig. 9a-b. A lentiCRISPR-hygro derived ANKRD52−/− clone was used in Fig. 2e. PX330-derived clones were used in Figs. 2a, 2f, 3a-e, 4a-f, 5a-e, 6a-c, Extended Data Fig. 3, Extended Data Fig. 4c, Extended Data Fig. 6, Extended Data Fig. 7, Extended Data Fig. 8c-d, Extended Data Fig. 9a-b, Extended Data Fig. 9d, and Extended Data Fig. 10.
Transfection with miR-19 inhibitors
3×10⁵ reporter cells were seeded per well in six-well dishes. Cells were transfected the following day with a mixture of inhibitors for miR-19a and miR-19b at 5 nM each (MiRIDIAN microRNA Hairpin Inhibitors, GE Dharmacon) using Lipofectamine RNAiMAX (Thermo Fisher). Fluorescence was assessed by flow cytometry 48 hours after transfection.
Genome-wide CRISPR-Cas9 Screening
Lentiviral sgRNA library production
The human GeCKO v2 library was obtained from Addgene (#1000000048) and amplified according to the provided instructions. Plasmid was purified from bacterial pellets using the Qiagen plasmid maxi kit. Active lentivirus was prepared in 293T cells by first seeding 3.2×10⁶ cells per 10 cm dish. GeCKO library A and library B were prepared independently using 15 dishes per library. The day after seeding, each dish was transfected using 10 μg of total plasmid (5:3:2 ratio of GeCKO library:psPAX2:pMD2.G), 30 μL of FuGENE HD, and 900 μL of Opti-MEM. Medium was exchanged the following day. Media collections at 48 and 72 hours after transfection were pooled prior to filtering through a 0.45 μm SFCA sterile filter. Aliquots of the library were snap frozen on dry ice and ethanol before being stored at −80°C. Library titer was determined as described12.
Transduction of reporter cell lines with lentiCRISPR library
Genome-wide CRISPR-Cas9 screens using HCT116EGFP-miR-19, HCT116EGFP, or ANKRD52−/− HCT116EGFP-miR-19 cells were performed using both GeCKO v2 libraries A and B. Biological replicates were performed for all screens. For each transduction, five 12-well plates were seeded with 5×10⁵ reporter cells per well. An overnight transduction was performed the following day by diluting virus to an MOI of 0.2-0.4 in 8 μg/mL polybrene. Cells were then trypsinized and pooled before being plated into fresh medium in six 15 cm dishes. 48 hours later, cells were trypsinized, pooled, counted, and seeded into five 15 cm dishes with 1 μg/mL puromycin using 2.4×10⁷ cells per dish. In parallel, a small aliquot of cells was used to confirm that an MOI of 0.2-0.4 was achieved. Cells were passaged for 12-14 days before sorting. At every passage, 1×10⁷ cells were seeded per dish into four 15 cm dishes with medium containing puromycin. At least 2×10⁷ cells were transduced with each library for each screen, corresponding to ~300X or greater coverage.
Cell sorting
Two days prior to sorting, ten 15 cm dishes with 1.2×10⁷ cells per dish were seeded for each library-reporter pair. Samples were prepared for FACS by trypsinization in 0.25% trypsin-EDTA (Thermo Fisher) for 7 minutes. Cells were dissociated by pipetting up and down approximately 20 times with a P1000 pipet to minimize doublets. Dissociated cells were pipetted directly into media, pelleted at 300 g for 5 minutes, and washed once with PBS. Cells were resuspended at 1.4×10⁷ cells per mL in PBS supplemented with 3% FBS. Cells were sorted at the UT Southwestern Flow Cytometry Core Facility using a MoFlo cell sorter (Beckman Coulter). The brightest or dimmest 0.5% of cells were collected based on EGFP fluorescence. Cell sorting was performed on approximately 9×10⁷ cells, and typical yields ranged from 2×10⁵ – 3×10⁵ sorted bright/dim cells. Cells were pelleted at 300 g and frozen at −80°C for genomic DNA (gDNA) extraction. Unsorted cells were similarly collected.
Genomic DNA extraction
gDNA was extracted from the unsorted cells using the Qiagen DNeasy Blood & Tissue Kit according to the manufacturer’s instructions. Extractions were performed on 4×10⁷ cells using 5×10⁶ cells per column to ensure enough gDNA for 300X coverage of the library. DNA was eluted by adding 125 μL of water to each column. The same eluate was added back to the column for a second elution. The DNA concentration in the final eluate was assessed using the Qubit dsDNA BR assay kit (Thermo Fisher).
To facilitate maximum recovery of gDNA from the sorted cells, a previously described method40 was used with the following modifications: Sorted cell pellets were resuspended in 500 μL of tissue lysis buffer, consisting of 460 μL of STE buffer [1 mM EDTA (pH 8.0), 10 mM Tris-HCl (pH 8.0), 100 mM NaCl] supplemented with 10 μL of 0.5 M EDTA, 10 μL of proteinase K [10 mg/mL in TE buffer containing 10 mM Tris-HCl (pH 8.0) and 1 mM EDTA], and 20 μL of 10% SDS. Pellets were digested overnight at 55°C while shaking at 1000 rpm on a Thermomixer (Eppendorf). The following day, 5 μL of 2 mg/mL RNase A was added to each tube and incubated at 37°C for 1 hr while shaking at 1000 rpm. Extractions were performed with an equal volume of pH 7.9-buffer saturated phenol, followed by phenol:chloroform:isoamyl alcohol (25:24:1), followed by chloroform. 20 μg of glycogen (Roche) and 1.5 mL of 100% ethanol was added to each tube and DNA was precipitated at −80°C for 1 hr followed by centrifugation at 18,000 g for 10 min at 4°C. Pellets were washed with 1 mL of 75% ethanol, dried, and resuspended in 21 μL of water by incubating at 37°C for a minimum of 4 hrs. DNA concentration was determined with the Qubit dsDNA BR assay kit.
Sequencing library preparation
Methods to prepare PCR amplicon libraries for deep sequencing were adapted from a previously published protocol12. All primer sequences are provided in Supplementary Table 8. For unsorted cells, an initial round of PCR (PCR I) was performed using 6.6 μg of gDNA per 100 μL PCR reaction. To maintain 300X coverage, 20 reactions were assembled for each sample. For sorted cells, all extracted gDNA for a given sample was distributed into two 100 μL reactions. In both cases, 18 cycles of amplification were performed using Herculase II Fusion polymerase (Agilent). All reactions for a given sample from PCR I were then pooled together and a second round of PCR (PCR II) was performed to add the necessary adapters for Illumina sequencing. Due to variable PCR efficiency between samples, the cycle number for PCR II was adjusted so that each library was amplified in a 50 μL reaction to a common endpoint with respect to DNA quantity (approximately 50 ng of DNA library in a 50 μL PCR sample).
DNA was purified for sequencing using AMPure XP beads (Agencourt) according to the manufacturer’s instructions with the following modifications: Each 50 uL PCR II reaction was mixed with 25 uL of beads and incubated for 5 minutes. Magnetic separation was used to collect the supernatant. The supernatant was mixed with 90 μL of beads and incubated for 5 minutes. The supernatant was collected and discarded. Beads were washed twice with 200 μL of 70% ethanol and then dried for approximately 12 minutes. Bound DNA was eluted from the beads using 40 μL of water.
Next-generation sequencing
Prior to sequencing, all DNA libraries were analyzed using the Bioanalyzer High Sensitivity DNA Analysis Kit (Agilent). Library concentration was then determined by qPCR using the KAPA Library Quantification Kit for Illumina platforms. All samples were sequenced on an Illumina HiSeq 2500 or a NextSeq 500 with 75 bp single reads. ~15-20 million reads were sequenced per library.
Sequencing data analysis
A reference file for all sgRNAs in the library was acquired from Addgene, and identical sgRNAs targeting more than one protein-coding gene were removed. Demultiplexed FASTQ files were mapped to the reference file using Bowtie 2 requiring unique alignments with no mismatches. Normalized read counts were calculated as described previously12. Screen hits were identified using RIGER16 with the following parameters: log fold-change ranking, 1×10⁶ permutations, second best rank (SBR) scoring algorithm.
qRT-PCR
RNA was extracted from cells using the miRNeasy Mini Kit (Qiagen) with an on-column DNase digestion. cDNA was generated using either the SuperScript IV First-Strand Synthesis System (Thermo Fisher) or MultiScribe Reverse Transcriptase (Thermo Fisher). SYBR Green assays were performed using the SYBR Green PCR Master Mix (Applied Biosystems) using custom primer pairs or qRT-PCR assays for mature miRNAs or mRNAs were performed using pre-designed assays and the TaqMan Universal Master Mix II (Applied Biosystems). Primer sequences and catalog numbers provided in Supplementary Table 8. A custom Taqman assay was designed for pri-miR-17-92 (sequences provided in Supplementary Table 8).
Co-immunoprecipitation assays
For all co-IP assays, 3.2×10⁶ 293T cells were seeded one day before transfection. Cells were transfected using Fugene HD with 10 μg of total plasmid. Media were changed the following day. Cells were harvested 48 hours after transfection. Cells were washed once, scraped in PBS, and lysed on ice for 10 minutes in 1 mL of lysis buffer composed of 25 mM Tris-HCl (pH 8.0), 150 mM NaCl, 2 mM MgCl2, 0.5% NP-40, 1 mM DTT, and a protease inhibitor cocktail (cOmplete EDTA-free, Roche). Lysates were spun at 10,000 g for 10 minutes. Supernatants were collected and diluted with 0.5 volumes of fresh lysis buffer. 1.5 μL of IP antibody [anti-V5 (Invitrogen Cat# 46-0705) or anti-HA (Cell Signaling Cat# 2367S)] was added to each sample and rotated at 4°C for 30 minutes. 30 μL of washed Dynabeads Protein G (Thermo Fisher) were added to each sample and incubated for 6 hours. RNase A (Thermo Fisher) was added to a final concentration of 20 μg/mL where indicated. Samples were washed four times in ice-cold lysis buffer. 50 μL of 2X Laemmli sample buffer were added to each sample and aliquots were used for western blot analysis.
Western Blot Antibodies
Antibodies used for western blotting included anti-HA (2367S, Cell Signaling), anti-V5 (46-0705, Invitrogen), anti-AGO2 (SAB4200085, Sigma), anti-GAPDH (2118S, Cell Signaling), anti-alpha-Tubulin (T6199-200UL, Sigma), anti-BRD4 (13440S, Cell Signaling), anti-CTNNB1 (9587S, Cell Signaling), anti-POU2F1 (8157S, Cell Signaling), anti-ANKRD52 (A302-372A, Bethyl), and anti-CSNK1A1 (sc-6477, Santa Cruz).
Phos-tag SDS-PAGE Electrophoresis
SDS-PAGE gels (7%) were supplemented with Phos-tag AAL solution (Wako) according to manufacturer’s recommendations. Gels were run at 100V in an XCELL SureLOCK Mini-Cell (Invitrogen) until the dye front completely exited the gel. Gels were incubated in transfer buffer supplemented with 1 mM EDTA for 10 minutes. Gels were then soaked in normal transfer buffer for 10 minutes. Proteins were transferred to a nitrocellulose membrane and standard western blotting procedures were subsequently followed.
For lambda phosphatase treatments, lysates were generated as described in the co-immunoprecipitation assays. 50 μL of lysate was mixed with 10X MnCl2 buffer and 10X reaction buffer provided with the lambda protein phosphatase kit (NEB). Samples treated with enzyme received 1 μL of purified lambda protein phosphatase. Incubations were performed for 45 minutes at 30°C, and samples were subjected to chloroform-methanol precipitation41 prior to phos-tag electrophoresis.
Mass spectrometry
Endogenous AGO2 was purified from ANKRD52+/+ and ANKRD52−/− HCT116 cells. AGO2−/− cells were used as a control. 1×10⁷ cells were seeded per 15 cm dish, and eight dishes were used per cell line. AGO2 was immunoprecipitated using methods adapted from an established protocol42 with 100 μL of Dynabeads Protein G loaded with 18 μg of anti-AGO2 antibody (SAB4200085, Sigma) per purification. IP eluates were resuspended in 5x Laemmli sample buffer.
FH-AGO2 constructs (WT, T830A, S824A/T830A) were stably expressed using MSCV-puro in ANKRD52−/− cells. 1×10⁷ cells were seeded per 15 cm dish, and eight dishes were used per cell line. Media were changed 48 hours later. Cells were scraped in PBS 72 hours after plating. Lysates were generated using methods similar to the co-immunoprecipitation assays, with the exception that a phosphatase inhibitor cocktail (PhosStop, Roche) was included and lysate supernatants were diluted with one volume of lysis buffer. Proteins were immunoprecipitated using 100 μL of Dynabeads Protein G loaded with 20 μg of anti-FLAG antibody (F1804, Sigma). Beads were rotated at 4°C for 3 hours. Beads were washed five times in lysis buffer. Proteins were eluted using 70 μL of 2x Laemmli sample buffer per 100 μL of beads.
Purified AGO2 proteins were separated by SDS-PAGE and stained using InstantBlue (Expedeon). Gel slices containing AGO2 bands were reduced by DTT, alkylated by iodoacetic acid, and digested with trypsin (Trypsin Gold; Promega). The digestion was stopped by adding formic acid, followed by peptide extraction in acetonitrile. Extracted peptides were desalted by C18 ZipTip (Millipore).
Peptide mixtures were separated by C-18 resin (100 Å, 3 μm, MICHROM Bioresources) in-house packed into a silica capillary emitter (100 μm ID, 100 mm resin length). LC gradient was generated by a Dionex Ultimate 3000 nanoLC system (Thermo Scientific), using mobile phase A: 0.1% formic acid and B: 0.1% formic acid in acetonitrile. Mobile phase gradient: 2% B at 0-15 min, 30% B at 81 min, 35% B at 85 min, 40% B at 87 min, 60% B at 95 min, 80% B at 96-107 min and 2% B at 108-120 min. Flow rate: 600 nL/min at 0-13.5 min, 250 nL/min at 13.5-120 min.
Peptide eluents were sprayed online with a nano-electrospray ion source (Thermo Scientific) at spray voltage of 1.5 kV and capillary temperature of 250° C. High resolution MS analysis was performed on a QExactive Quadrupole-Orbitrap Hybrid mass spectrometer (Thermo Scientific), which operates in data-dependent mode with dynamic exclusion of 30s. Full scan MS was acquired at the m/z range of 300-1650, resolution of 70,000 and automatic gain control (AGC) target of 3e6. The top 15 most intense ions were subsequently selected for HCD fragmentation at resolution of 17,500, collision energy of 27 and AGC target of 1e5.
Proteome data analysis was performed using Mascot (Matrix Science) and Proteome Discoverer (1.4, Thermo Scientific). The raw data were searched against the human proteome database (Uniprot, UP000005640) plus common contaminants. Static modification was cysteine carbamidomethylation; variable modifications were serine or threonine phosphorylation, methionine oxidation and glutamine or asparagine deamination. Precursor mass tolerance was 20 ppm and fragment mass tolerance, 0.05 Da. Maximum number of miscleavage sites allowed was 2. After peptide identification, precursor ion intensities were quantified manually in XCalibur using extracted ion chromatogram.
Cloning, mutagenesis, and expression of cDNA constructs
Sequences of all primers used for cloning are provided in Supplementary Table 8. FLAG-HA-AGO2 (FH-AGO2) was PCR amplified from pIRES-neo-FLAG/HA AGO2 (Addgene #10822) and subcloned into pcDNA3.1+. FH-AGO2 mutants were generated using the QuikChange II XL Site-Directed Mutagenesis Kit (Agilent) or by cloning customized gBlocks (IDT) into the parental pcDNA3.1+ vector containing FH-AGO2 (sequence of all mutants provided in Supplementary Table 8). Stable expression of wild-type or mutant FH-AGO2 was achieved in one of two ways. In one, constructs were subcloned into pMSCV-puro (Clontech). In another, stable expression of AGO2 for RNA-seq and eCLIP experiments was achieved by cloning individual mutants into a modified pLJM1-EGFP vector (Addgene #19319) where EGFP was resected using AgeI and BsrGI prior to blunt-end ligation. AGO2 constructs were introduced at the EcoRI cloning site. FLAG-HA-AGO1 was subcloned from pIRESneo-FLAG/HA AGO1 (Addgene #10820) into pMSCV-PIG (Addgene #21654). V5-tagged ANKRD52 (corresponding to NP_775866.2) was constructed by PCR amplification from HCT116 cDNA followed by cloning into pcDNA3.1+. cDNA clones for human PPP6C and CSNK1A1 were obtained from the Invitrogen Ultimate ORF LITE Library (Clone ID #IOH7224 and IOH59150, respectively) and subcloned into pCAGIG (Addgene #11159) using Gateway LR Clonase (Thermo Fisher). For tethering assays, a 5X BoxB sequence adapted from a previous report 32 was designed as a gBlock (IDT) and cloned in the XbaI site of pGL3-Control (Promega) (sequence in Supplementary Table 8). For the λN constructs, a gBlock containing the λN peptide sequence with an HA tag32 was subcloned into pcDNA3.1-FH-AGO2, replacing the FLAG-HA tag. To generate control plasmid expressing λN-HA peptide alone, the λN-HA sequence was PCR amplified and cloned into pcDNA3.1+.
Expression of FH-AGO2 mutants in ANKRD52−/− HCT116EGFP-miR-19 cells
Active lentivirus was generated using FH-AGO2 mutants (WT, 5XA, S828A, and empty vector) cloned into a modified pLJM1 vector with EGFP resected. A viral packaging protocol analogous to that used for the lentiCRISPR lentivirus preparations was employed. Recipient ANKRD52−/− HCT116EGFP-miR-19 cells were transduced at an MOI of approximately 0.2. Transduced cells were selected in puromycin for at least ten days, prior to use in flow cytometry experiments (Fig. 2f).
AGO2:miRNA and AGO2:mRNA association studies
For experiments involving endogenous AGO2, parental HCT116 cells were used. For analysis of FH-AGO2 miRNA or mRNA binding, cells stably expressing the indicated wild-type or mutant FH-AGO2 protein were first generated by infecting AGO2−/− HCT116 cells with MSCV retroviruses. Then, for each IP sample, 6×10⁶ cells were seeded per 10 cm dish. Cells were harvested 48 hours later by scraping in PBS. Pelleted cells were resuspended in 1 mL of a lysis buffer consisting of 25 mM Tris-HCl (pH 8.0), 150 mM NaCl, 2 mM MgCl2, 0.5% NP-40, 1 mM DTT, a protease inhibitor cocktail (cOmplete, EDTA-free, Roche), and 250 U/mL Recombinant RNasin Ribonuclease Inhibitor (Promega). Cells were lysed on ice for 10 minutes. Samples were spun at 10,000 g for 10 minutes. Supernatant fractions were retained. Protein concentration was determined using the Bio-Rad DC Protein Assay Kit, and all samples were adjusted to the same concentration with lysis buffer. Dynabeads Protein G (Thermo Fisher) were prepared by pre-incubating with 1.5 μg of antibody [either anti-FLAG (F1804, Sigma) or anti-AGO2 (SAB4200085, Sigma)] and pre-blocking with 0.5 mg/mL BSA, 0.5 mg/mL yeast tRNA, and 0.2 mg/mL heparin. Each sample was incubated with 25 μL of prepared Dynabeads Protein G for 3 hours at 4°C. Samples were washed three times in lysis buffer. Captured protein was eluted from the beads using either 2.5 mg/mL 3X FLAG peptide (Sigma) or 3.5 mg/mL AGO2 peptide [sequence derived from42, synthesized at the UT Southwestern Protein Chemistry Technology Core] dissolved in lysis buffer. 80% of the eluate was harvested for RNA extraction and 20% was diluted with 2x Laemmli sample buffer for western blot analysis. For each IP, qRT-PCR assays were performed to determine input and IP levels for mature miRNAs and mRNA targets of interest. Western blot analysis was performed to determine the relative amount of AGO2 in the IP eluate. RNA quantity as a percent of input was determined for all IP eluates and then normalized to the relative amount of protein captured in each eluate.
AGO2 capture using an mRNA target mimic
Experiments to capture AGO2 loaded with miRNA were adapted from a previously published method30. ANKRD52+/+ and ANKRD52−/− HCT116EGFP-miR-19 cells were seeded at 1.35×10⁷ cells per dish in six 15 cm dishes per cell line. 48 hours later, cells from each dish were scraped in PBS, pelleted, and lysed on ice for 10 minutes in 1 mL of a buffer containing 25 mM Tris-HCl (pH 8.0), 150 mM NaCl, 2 mM MgCl2, 0.5% NP-40, 1 mM DTT, a protease inhibitor cocktail (cOmplete, EDTA-free, Roche), a phosphatase inhibitor cocktail (PhosStop, Roche), and 250 U/mL Recombinant RNasin Ribonuclease Inhibitor (Promega). Lysates were spun at 10,000 g for 10 minutes and supernatants were further diluted with one volume of lysis buffer. To assess binding of AGO2 to the target mimic, 1.8 mL of each lysate was incubated with 50 μL of washed Dynabeads MyOne Streptavidin C1 (Thermo Fisher) pre-loaded with 300 pmol of wild type or mutant RNA oligonucleotide (Supplementary Table 8) and pre-blocked with 1 mg/mL BSA, 0.5 mg/mL yeast tRNA, and 0.2 mg/mL heparin. To assess AGO2 phosphorylation after immunoprecipitation, 1.8 mL of each lysate was incubated with 50 μL of washed Dynabeads Protein G (Thermo Fisher) pre-incubated with 5 μL of anti-AGO2 antibody [SAB4200085, Sigma42] and pre-blocked as noted previously. Lysates were incubated with beads for 3 hours at room temperature. Beads were washed four times in lysis buffer before 50 μL of 2X Laemmli sample buffer was added. Phos-tag electrophoresis was performed on captured protein complexes and on input protein samples subjected to chloroform-methanol precipitation41.
Tethering assays
293T cells were seeded in 24-well plates using 7.5×10⁴ cells per well. Cells were transfected the following day using FuGENE HD and 301 ng of total plasmid. Each transfection consisted of 1 ng of phRL-SV40 (Promega), 20 ng of pGL3-Control or pGL3-BoxB, 150 ng of pcDNA3.1+ (expressing tethered or untethered proteins), and 130 ng of empty pcDNA3.1+. Cells were harvested 24 hours later for luciferase activity assays using the Dual-Luciferase Reporter Assay System (Promega). Firefly luciferase activity was normalized to Renilla luciferase activity in each well to control for variation in transfection efficiency. Biological triplicates were performed for each transfection.
Rapamycin treatment of reporter cells
ANKRD52−/− HCT116EGFP-miR-19 cells were seeded in 6-well dishes at 6×10⁵ cells per well. The following day, cells were treated with 10, 50, or 200 nM rapamycin for 72 hours (fresh medium with rapamycin was exchanged at 48 hours). Cells were harvested in 2X Laemmli sample buffer at the experimental endpoint.
In vitro kinase assays using immunopurified FLAG-HA-AGO2
AGO2−/− cells were infected with MSCV retroviral constructs to stably express FH-AGO2WT or FH-AGO25XA. FH-AGO2-expressing cells were seeded using 1.5×10⁷ cells per dish in 15 cm dishes with three dishes per cell line. Lysates were generated using methods similar to the co-immunoprecipitation assays, with the exception that 2 mL of lysis buffer was used per dish. Lysates were diluted with one volume of lysis buffer. FH-AGO2 was immunoprecipitated using 9 μg of anti-FLAG antibody (F1804, Sigma) and 150 μL of washed Dynabeads. Samples were rotated at 4°C overnight. Beads were washed three times with lysis buffer and then treated with lambda protein phosphatase (NEB) for 45 minutes. Beads were washed three times with lysis buffer and then resuspended in 100 μL reaction buffer composed of 25 mM Tris-HCl (pH 7.5), 10 mM MgCl2, 2.5 mM DTT, 0.01% Triton X-100, 0.5 mg/mL BSA, 0.5 mM EGTA, 0.5 mM Na3VO4, 5 mM beta-glycerophosphate, 170 ng of recombinant CSNK1A1 (PV3850, Thermo Fisher), and 200 μM [γ-32P]ATP (SA = 100-500 cpm/pmol). Reactions were incubated at 37°C for 2 hrs. Beads were separated and mixed with 50 μL of 2X Laemmli sample buffer. SDS-PAGE was performed, and gels were stained using SimplyBlue SafeStain (Invitrogen). 32P signal was detected using a phosphor screen (GE Healthcare) and Typhoon FLA 7000 (GE Healthcare).
In vitro kinase assays using AGO2 peptides
In vitro CSNK1A1 kinase assays were performed using assay conditions adapted from manufacturer recommendations (Recombinant CSNK1A1, PV3850, Thermo Fisher). All reactions were performed in a 50 μL volume for 90 minutes at 30°C. Assay buffer was composed of 25 mM Tris-HCl (pH 7.5), 10 mM MgCl2, 2.5 mM DTT, 0.01% Triton X-100, 0.5 mg/mL BSA, 0.5 mM EGTA, 0.5 mM Na3VO4, 5 mM beta-glycerophosphate, 1 mM peptide (Supplementary Table 8), 170 ng of recombinant CSNK1A1, and 200 μM [γ-32P]ATP (SA = 100-500 cpm/pmol). Reactions were terminated using 75 mM H3PO4 and spotted onto P81 phosphocellulose squares. Samples were washed four times in 75 mM H3PO4 for 5 minutes per wash and immersed in acetone for 5 minutes before drying. 32P incorporation was assessed by Cerenkov counting.
Cloning and expression of ciRS-7
The linear form of ciRS-7 was constructed by amplifying the endogenous ciRS-7 locus from human genomic DNA (Roche) by PCR (Phusion Polymerase, Thermo Scientific) using primer sequences described previously36 (Supplementary Table 8). The PCR fragment was then cloned into the HindIII and NotI cloning sites of pcDNA3.1+ (Invitrogen). To generate the ciRS-7 construct capable of circularization, an ~800-bp region upstream of the splice acceptor was amplified using previously described primers36 (Supplementary Table 8) and inserted in the inverse orientation downstream of the linear ciRS-7 sequence at the XhoI cloning site of pcDNA3.1+.
The effect of ciRS-7 expression on AGO2 phosphorylation was assessed through co-transfection experiments. Cells were seeded at a density of 9×10⁵ cells per well in six-well dishes. Cells were transfected according to manufacturer’s recommendations using Lipofectamine 2000 (Thermo Fisher). Where indicated, each well received 2 μg of plasmid and 10 nM miRNA mimics (miRIDIAN miRNA mimics, GE Dharmacon). Cells were harvested 28 hours later for western blot analysis.
RNA-seq
Parental HCT116EGFP-miR-19, AGO2−/− HCT116EGFP-miR-19, ANKRD52−/− HCT116EGFP-miR-19, and ANKRD52−/−; CSNK1A1−/− HCT116EGFP-miR-19 cells were used for RNA-seq. Three independent clonal AGO2−/−, ANKRD52−/−, and ANKRD52−/−; CSNK1A1−/− knockout cell lines and three biological triplicates of parental cells were sequenced. 5.0×10⁵ cells were seeded per well in six-well dishes. Cells were harvested 48 hours later, and RNA was extracted using the RNeasy Mini Kit (Qiagen) with an on-column DNase digestion. Sequencing libraries were generated using the TruSeq Stranded mRNA LT Sample Prep Kit (Illumina) and run on a NextSeq 500 using the NextSeq 500/550 High Output v2 Kit, 75 cycle (Illumina).
AGO2−/− HCT116EGFP-miR-19 cells generated using PX330 were reconstituted with either empty pLJM1 vector (with EGFP previously resected), FH-AGO2-WT (AGO2WT), or FH-AGO2-5XA (AGO25XA). Biological triplicates for each cell line were seeded with 5.0×10⁵ cells per well in six-well dishes. Cells were collected 48 hours later, and RNA was extracted using the miRNeasy Mini Kit (Qiagen) with an on-column DNase digestion. Sequencing libraries were generated using the TruSeq Stranded Total RNA with Ribo-Zero Human/Mouse/Rat Low-throughput (LT) kit (Illumina) and run as performed in the previous RNA-seq experiment.
Quality assessment of the RNA-seq data was done using NGS-QC-Toolkit43 with default settings. Quality-filtered reads generated by the tool were then aligned to the human reference genome hg19 (for AGO2−/−, ANKRD52−/−, and ANKRD52−/−; CSNK1A1−/− RNA-seq experiments) or hg38 (for FH-AGO2 reconstitution experiments) using the Tophat2 (v 2.0.12 ) aligner44 using default settings. Read counts obtained from featureCounts45 were used as input for edgeR (v 3.8.6)46 for differential expression analysis. Genes with FDR ≤ 0.05 were regarded as differentially expressed for comparisons of each sample group.
Enhanced UV crosslinking and immunoprecipitation (eCLIP)
Cell culture, library preparation, and deep sequencing
AGO2−/− cells or AGO2−/− cells reconstituted with FH-AGO2WT or FH-AGO25XA via lentiviral expression (described above) were seeded in 15 cm dishes with five dishes per cell line at 1.0×10⁷ cells per dish. Cells were cultured for 48 hours and subsequently UV crosslinked at 400 mJ/cm2. Aliquots of 2.0×10⁷ cells were then frozen at −80°C. eCLIP was performed using the frozen samples as previously described37, using anti-FLAG antibody for IPs (F1804, Sigma). For each cell line, duplicate input and IP samples were prepared and sequenced. The RiL19 RNA adapter (Supplementary Table 8) was used as the 3' RNA linker for all samples. PAGE-purified DNA oligonucleotides were obtained from Sigma for the PCR library amplification step (Supplementary Table 8). PCR amplification was performed using between 11-15 cycles for all samples. Paired-end sequencing was performed on a NextSeq 500 using the NextSeq 500/550 High Output v2 Kit, 75 cycle (Illumina).
Mapping deep sequencing reads
Adapters were trimmed from original reads using Cutadapt (v1.9.1)47 with default settings. Next, the randomer sequence from the rand103Tr3 linker (Supplementary Table 8) was trimmed and recorded. Tophat2 (v2.0.12)44 was used to align mate 2 to hg38. Only the uniquely mapped reads were retained. PCR duplicates were then removed using the randomer information using an in-house script. All reads remaining after PCR duplicate removal were regarded as usable reads and used for cluster calling.
eCLIP cluster calling and annotation
eCLIP clusters were identified using a previously described method6 with the following modifications. Genome coverage by usable reads was determined at nucleotide resolution for each data set, and regions of continuous coverage greater than expected from a Poisson noise distribution were identified (p ≤ 0.001). For each region, read counts were obtained using Bedtools (v2.17)48. If 50% of a read overlapped a region on the same strand, it was counted as a read that covers that region. For each region, normalization to total usable reads was performed and a fold change between IP and input samples was calculated. Significant CLIP clusters in each dataset were defined by i) the presence of significantly greater coverage in the region than expected by chance based on the Poisson distribution, and ii) log2 fold change of normalized reads in the cluster was ≥ 2 comparing IP to input.
The final CLIP clusters for FH-AGO2WT and FH-AGO25XA were identified by first identifying significant clusters present in both experimental replicates. A region was considered to be present in both replicates if it occurred on the same strand and the replicate clusters overlapped by at least 1/3 of their total length. Significant clusters from both replicates were then merged to define the final cluster length. Lastly, all clusters identified in the AGO2−/− samples were subtracted to generate the final CLIP cluster calls (Supplementary Table 7). Clusters were annotated based on their genomic locations (Ensembl GRCh38.85) if 55% of the cluster overlapped with a given genomic region. If a cluster was assigned to multiple annotations, the annotation was selected using the following priority: CDS exon > 3' UTR > 5' UTR > Protein-coding gene intron > Noncoding RNA exon > Noncoding RNA intron > Intergenic.
Identification of active miRNA seed families and calculation of CLIP coverage at miRNA binding sites (Fig. 6c)
Active miRNAs in HCT116 were identified using an approach similar to that described previously6 with the following modifications. The top 100 most highly expressed miRNAs in HCT116 cells were identified based on a previously published small RNA sequencing experiment in this cell line49 and collapsed to 66 7mer seed families with identical sequence from nucleotides 2-8. 8mer binding sites for these seeds, defined as in3, were identified in the 3' UTRs of all expressed genes (FPKM > 0) using seqMap (v1.0.12)50. The locations were then transformed to genomic coordinates and extended 10 nt upstream and downstream to obtain a seed match region (excluding sites on exon-exon junctions). The number of crosslinking sites in these seed match regions for each miRNA seed family in FH-AGO2WT CLIP data were counted, normalized to the total usable reads in each replicate library, and averaged across replicates. To determine the significance cut-off, all possible 8mers except for known miRNA seeds and those with 4 consecutive A, C, G, or T nucleotides were used to generate a null distribution. These background 8mers were divided into 13 groups with 1000 8mers in first 12 groups and 678 8mers in the final group. CLIP crosslinking to each 8mer in expressed 3' UTRs was quantified as described above for actual miRNA seeds. A mRNA seed family was considered to be active in HCT116 cells if it obtained more crosslinking events than expected by chance, defined by the average number of crosslinking events from each of the 13 background 8mer groups above which p < 0.01. Based on this analysis, 15 active miRNA seed families were identified (representative miRNA: miR-423-5p, miR-17-5p, miR-200a-3p, miR-19a-3p, miR-23a-3p, miR-148a-3p, miR-221-3p, miR-125-5p, miR-182-5p, miR-21-5p, miR-30a-5p, miR-25-3p, let-7a-5p, miR-27a-3p, miR-24-3p).
To quantify CLIP coverage of miRNA binding sites in FH-AGO2WT and FH-AGO25XA CLIP data (Fig. 6c), 8mer, 7mer, and 6mer binding sites, defined as in3, for all active miRNAs were identified within FH-AGO2WT CLIP clusters in 3' UTRs using seqMap. Clusters with only a single type of binding site (8mer, 7mer, or 6mer) were identified. If an 8mer binding site was identified, this site was excluded from 7mer or 6mer categories. Likewise, 7mer sites were excluded from the 6mer sites. Clusters were further filtered for those that were present in transcripts with FPKM > 0 in both FH-AGO2WT and FH-AGO25XA cell lines, yielding 228, 89, and 80 clusters containing 6mers, 7mers, or 8mers, respectively. For each cluster with a given type of binding site, CLIP coverage was calculated by determining the average number of CLIP reads in the cluster in each replicate normalized to the total number of reads in all clusters in each replicate, divided by FPKM of the transcript. The final reported CLIP coverage is the average of both replicates.
To quantify CLIP coverage of miRNA binding sites in FH-AGO25XA-unique clusters versus FH-AGO2WT/FH-AGO25XA-common clusters (Extended Data Fig. 10e), 8mer, 7mer, and 6mer binding sites for all active miRNAs were identified within each class of CLIP cluster. Windows around each site were then extended 10 nt upstream and downstream to obtain a seed match region. The number of crosslinking sites within these regions were counted and normalized to the total number of reads in clusters of each class (FH-AGO25XA-unique or FH-AGO2WT/FH-AGO25XA-common) to derive the CLIP coverage used to draw the CDF plots.
CLIP coverage of FH-AGO25XA rescued vs. non-rescued transcripts (Extended Data Fig. 10d)
Genes whose repression in AGO2−/− cells was rescued by FH-AGO25XA were defined by first identifying the genes that were significantly upregulated in AGO2−/− cells compared to parental HCT116 (FDR ≤ 0.05), then among these genes, those that were significantly downregulated in FH-AGO25XA vs. AGO2−/− (FDR ≤ 0.05). All other genes upregulated in AGO2−/− cells were considered not-rescued. The FH-AGO2WT CLIP coverage for each gene in these classes was calculated as the sum of all reads in CLIP clusters in a given 3' UTR, normalized to total reads in all clusters, divided by FPKM of the transcript. The final reported CLIP coverage is the average of both FH-AGO2WT replicates.
mRNA half-life analysis (Extended Data Fig. 10f)
Half-lives of transcripts with FH-AGO25XA CLIP clusters in their 3' UTRs were obtained from a previously published study38. Genes that had half-lives assigned to more than one RefSeq mRNA isoform were removed to avoid ambiguity. Genes in the top quartile of half-lives were defined as having a long half-life (N = 273) and genes in the bottom quartile of half-lives were defined as having a short half-life (N = 274). The total number of CLIP reads in clusters in a given 3' UTR were obtained for each replicate and edgeR (v 3.8.6)46 was used to calculate the normalized fold change of CLIP coverage comparing FH-AGO25XA to FH-AGO2WT.
Data Availability
All high-throughput sequencing data generated in the course of this study (CRISPR-Cas9 screens, RNA-seq, eCLIP) have been deposited in GEO under accession code GSE89946.
Extended Data
Extended Data Figure 1. Knockout of candidate miRNA regulators in HCT116EGFP cells.
Flow cytometry analysis of EGFP in HCT116EGFP cells after transduction with lentiCRISPR vectors targeting the indicated genes.
Extended Data Figure 2. BRD4, CTNNB1, and POU2F1 positively regulate miR-19 expression.
a, Model depicting how each gene may promote expression of the miR-17-92 cluster. b, c, d, Western blot analysis confirming loss of expression of the indicated gene in HCT116 knockout clones. Asterisk indicates non-specific band. For each protein, all lanes came from the same blot but irrelevant lanes were removed. e, f, g, qRT-PCR assays demonstrating reduced expression of MYC (e), pri-miR-17-92 (f), or mature miR-19a/b (g) in BRD4−/−, CTNNB1−/−, or POU2F1−/− cells. For gel source data, see Supplementary Figure 1.
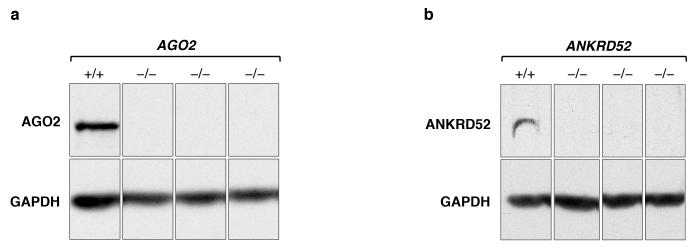
Extended Data Figure 3. Western blot analysis confirms loss of protein expression in AGO2 (a) and ANKRD52 (b) HCT116 clonal knockout lines.
For each protein, all lanes came from the same blot but irrelevant lanes were removed. For gel source data, see Supplementary Figure 1.
Extended Data Figure 4. General impairment of miRNA-mediated silencing in ANKRD52−/− cells.
a, b, Flow cytometry analysis of EGFP expression in HCT116 cells stably expressing reporters for miR-16 (a) or miR-200 (b) after transduction with lentiCRISPR vectors targeting ANKRD52 or expressing a non-targeting sgRNA. c, qRT-PCR showing de-repression of established let-7 targets (DICER1 or HMGA2) in AGO2−/− or ANKRD52−/− cells. *p < 0.05, **p < 0.01, two-tailed student’s t test comparing AGO2−/− or ANKRD52−/− to parental. (N = 3 biological replicates, each assayed in triplicate). d, qRT-PCR analysis of DICER1 and HMGA2 in non-transfected (NT) HCT116EGFP-miR-19 cells or after transfection with miR-19 antisense oligonucleotides (Anti-miR-19) confirms that these transcripts are not regulated by miR-19. Upregulation of the EGFP miR-19 reporter transcript served as a positive control in this experiment. (N = 3 biological replicates, each assayed in triplicate). e, qRT-PCR was performed for the indicated miRNAs and expression levels were normalized to U6 snRNA (N = 2 biological replicates, each assayed in triplicate).
Extended Data Figure 5. The ANKRD52-PPP6C complex interacts with and dephosphorylates AGO proteins.
a, Co-immunoprecipitation of FLAG-HA-AGO2 (FH-AGO2) with V5-ANKRD52 or V5-PPP6C with or without RNase A treatment. b, Phos-tag electrophoresis demonstrating AGO2 hyperphosphorylation in multiple ANKRD52/PPP6C-deficient cell lines. c, Phos-tag western blot analysis of FLAG-HA-AGO1 (FH-AGO1) stably expressed in ANKRD52+/+ and ANKRD52−/− HCT116 cells. For gel source data, see Supplementary Figure 1.
Extended Data Figure 6. Identification of multiple definitively phosphorylated residues in the S824-S834 region of AGO2 by mass spectrometry.
a, Full scan mass spectra zoomed to the region for the AGO2 815-837 peptide. The unphosphorylated and multiply phosphosphorylated precursor ions are shown in red. Peak labels indicate the mass-to-charge ratios and the charge state. The singly charged ion with grey label (top panel) does not correspond to peptide 815-837. Data at two close elution time points are shown for ANKRD52−/− to illustrate the unphosphorylated (0P), singly (1P), doubly (2P) and triply (3P) phosphorylated peptides. b, Quantification of the indicated endogenous AGO2 phosphopeptides relative to unphosphorylated peptide as determined by mass spectrometry. 1P, 2P, or 3P respectively denotes singly, doubly, or triply phosphorylated peptides spanning residues 815-837 of AGO2. Superscript indicates peptide charge state. ND, not detected. c, MS/MS spectra demonstrating phosphorylation of endogenous AGO2 at S824 in ANKRD52−/− cells. Red bars denote site-determining ions. d, e, MS/MS spectra demonstrating phosphorylation of FH-AGO2 (T830A) at S824 and S828 (d) or phosphorylation of FH-AGO2 (S824A/T830A) at S828 and S831(e) in ANKRD52−/− cells.
Extended Data Figure 7. Phosphomimetic mutants of FH-AGO2 do not exhibit reduced miRNA association.
a, Western blots showing expression of the indicated FH-AGO2 mutants. Within each panel (upper, middle, lower), all lanes came from the same blot but irrelevant lanes were removed. b, miRNA association of wild-type or mutant FH-AGO2 assessed as described in Figure 3a (N = 4 biological replicates, each assayed in triplicate). For gel source data, see Supplementary Figure 1.
Extended Data Figure 8. Analysis of serine/threonine kinases identified in the CRISPR-Cas9 suppressor screen.
a, b, Flow cytometry demonstrating EGFP expression in HCT116EGFP-miR19 (a) or HCT116EGFP cells (b) after transduction with lentiCRISPR vectors targeting the indicated genes. c, Flow cytometry demonstrating EGFP expression in HCT116EGFP-miR19 cells treated with the indicated dose of rapamycin. NT, not treated. d, Phos-tag western blot analysis of AGO2 in ANKRD52−/− cells after treatment with rapamycin. For gel source data, see Supplementary Figure 1.
Extended Data Figure 9. Functional characterization of CSNK1A1 and AGO2 target binding mutants.
a, Western blot analysis confirms loss of CSNK1A1 expression in HCT116 ANKRD52−/−; CSNK1A1−/− clonal knockout cells. All lanes came from the same blot but irrelevant lanes were removed. b, miR-19 expression normalized to U6 expression, assessed by qRT-PCR, in cells of the indicated genotypes (N = 4 biological replicates, each assayed in triplicate). c, Co-immunoprecipitation of V5-CSNK1A1 with FH-AGO2, with or without RNase A treatment. d, miRNA association of FH-AGO2 assessed as in Fig. 3e (N = 4 biological replicates, each assayed in triplicate). *p < 0.05 comparing mutant to wild-type AGO2, two-tailed student’s t test. For gel source data, see Supplementary Figure 1.
Extended Data Figure 10. Generation and eCLIP analysis of AGO2−/− cells reconstituted with AGO2WT or AGO25XA.
a, Western blot showing equivalent expression of FH-AGO2WT and FH-AGO25XA at physiologic levels. b, Distribution of AGO2 binding sites determined by eCLIP. For gel source data, see Supplementary Figure 1. c, Validation of targets identified by eCLIP using FH-AGO2 pull-down assays performed in reconstituted AGO2−/− cells. Experiment was performed as in Fig. 3a except anti-FLAG antibody was used for immunoprecipitation (N = 3 biological replicates, each assayed in triplicate). *p < 0.05, **p < 0.01, one-tailed student’s t test comparing FH-AGO25XA to FH-AGO2WT. n.s., not significant. d, FH-AGO2WT CLIP coverage (normalized total number of reads in clusters in a given 3' UTR divided by FPKM) of genes whose AGO2-mediated repression is or is not rescued by FH-AGO25XA. e, 8mer, 7mer, or 6mer binding sites for active miRNAs in HCT116 were identified within FH-AGO2WT/FH-AGO25XA-common CLIP clusters or FH-AGO25XA-unique CLIP clusters in 3' UTRs. CDF plots show CLIP coverage for each class of site (normalized number of crosslinking events within 10 nucleotides of each site). n.s., Kolmogorov-Smirnov (KS) test not significant. f, CDF plot showing the fold-change in CLIP coverage comparing FH-AGO25XA to FH-AGO2WT for transcripts with long half-lives (top quartile) vs. those with short half-lives (bottom quartile). g, Summary of the newly-defined AGO2 phosphorylation cycle. Target engagement triggers the hierarchical, multi-site phosphorylation of AGO2 by CSNK1A1, which inhibits target binding. The ANKRD52-PPP6C phosphatase complex dephosphorylates these residues, allowing AGO2 to engage new targets. Continual phosphorylation/de-phosphorylation of AGO2 through this cycle is necessary to maintain the global efficiency of miRNA-mediated silencing.
Supplementary Material
Acknowledgements
We thank David Bartel, Connie Cepko, David Sabatini, Phil Sharp, Didier Trono, Thomas Tuschl, and Feng Zhang for plasmids; Ashley Guzman and Rachel Bruce in the McDermott Center Next Generation Sequencing Core; Angie Mobley and the UT Southwestern Flow Cytometry Core; Haydn Ball and the UT Southwestern Protein Chemistry Technology Core; Stephen Johnson for assistance with software implementation; Jose Cabrera for assistance with figure preparation; and Kathryn O’Donnell for advice on the manuscript. This work was supported by grants from CPRIT (R1008 and RP160249 to J.T.M., RP101251 to Y.X., RP120718 to X.J.C., and RR150033 to V.S.T.) and the NIH (R01CA120185 and R35CA197311 to J.T.M., R01CA152301 to Y.X., and R00DK099254 to V.S.T.). T.L. is supported by a fellowship from Cancer Research Institute. F.K. is supported by the Leopoldina Fellowship Program (LPDS 2014-12) from the German National Academy of Sciences Leopoldina. J.T.M. and V.S.T. are CPRIT Scholars in Cancer Research. J.T.M. and Z.J.C. are Investigators of the Howard Hughes Medical Institute.
Footnotes
Supplementary Information is linked to the online version of the paper at www.nature.com/nature.
Author Contributions
R.J.G. performed most experiments and B.C. performed most bioinformatics analyses. T.L., X.C., J.W., and R.J.G. performed mass spectrometry analyses. J.B. and H.M. generated plasmid constructs, cell lines, and performed CLIP validation experiments. V.S. provided technical assistance for sequencing sgRNA libraries. T.C.C. performed qPCR analyses. F.K. assisted with CLIP experiments. A.R.M. generated plasmid constructs. B.C., Y.X., and J.T.M. performed bioinformatics analyses. V.S.T. provided guidance for the in vitro kinase assays. R.J.G., J.T.M., B.C., Y.X., Z.J.C., and T.L. designed most experiments. R.J.G and J.T.M. wrote the manuscript.
The authors have no relevant competing financial interests.
References
- 1.Mendell JT, Olson EN. MicroRNAs in stress signaling and human disease. Cell. 2012;148:1172–1187. doi: 10.1016/j.cell.2012.02.005. [DOI] [PMC free article] [PubMed] [Google Scholar]
- 2.Vidigal JA, Ventura A. The biological functions of miRNAs: lessons from in vivo studies. Trends Cell Biol. 2015;25:137–147. doi: 10.1016/j.tcb.2014.11.004. [DOI] [PMC free article] [PubMed] [Google Scholar]
- 3.Bartel DP. MicroRNAs: target recognition and regulatory functions. Cell. 2009;136:215–233. doi: 10.1016/j.cell.2009.01.002. [DOI] [PMC free article] [PubMed] [Google Scholar]
- 4.Jonas S, Izaurralde E. Towards a molecular understanding of microRNA-mediated gene silencing. Nat Rev Genet. 2015;16:421–433. doi: 10.1038/nrg3965. [DOI] [PubMed] [Google Scholar]
- 5.Grimson A, et al. MicroRNA targeting specificity in mammals: determinants beyond seed pairing. Mol Cell. 2007;27:91–105. doi: 10.1016/j.molcel.2007.06.017. [DOI] [PMC free article] [PubMed] [Google Scholar]
- 6.Bosson AD, Zamudio JR, Sharp PA. Endogenous miRNA and target concentrations determine susceptibility to potential ceRNA competition. Mol Cell. 2014;56:347–359. doi: 10.1016/j.molcel.2014.09.018. [DOI] [PMC free article] [PubMed] [Google Scholar]
- 7.Denzler R, Agarwal V, Stefano J, Bartel DP, Stoffel M. Assessing the ceRNA hypothesis with quantitative measurements of miRNA and target abundance. Mol Cell. 2014;54:766–776. doi: 10.1016/j.molcel.2014.03.045. [DOI] [PMC free article] [PubMed] [Google Scholar]
- 8.Jo MH, et al. Human Argonaute 2 Has Diverse Reaction Pathways on Target RNAs. Mol Cell. 2015;59:117–124. doi: 10.1016/j.molcel.2015.04.027. [DOI] [PubMed] [Google Scholar]
- 9.Salomon WE, Jolly SM, Moore MJ, Zamore PD, Serebrov V. Single-Molecule Imaging Reveals that Argonaute Reshapes the Binding Properties of Its Nucleic Acid Guides. Cell. 2015;162:84–95. doi: 10.1016/j.cell.2015.06.029. [DOI] [PMC free article] [PubMed] [Google Scholar]
- 10.Parry DH, Xu J, Ruvkun G. A whole-genome RNAi Screen for C. elegans miRNA pathway genes. Curr Biol. 2007;17:2013–2022. doi: 10.1016/j.cub.2007.10.058. [DOI] [PMC free article] [PubMed] [Google Scholar]
- 11.Zhou R, et al. Comparative analysis of argonaute-dependent small RNA pathways in Drosophila. Mol Cell. 2008;32:592–599. doi: 10.1016/j.molcel.2008.10.018. [DOI] [PMC free article] [PubMed] [Google Scholar]
- 12.Shalem O, et al. Genome-scale CRISPR-Cas9 knockout screening in human cells. Science. 2014;343:84–87. doi: 10.1126/science.1247005. [DOI] [PMC free article] [PubMed] [Google Scholar]
- 13.Wang T, Wei JJ, Sabatini DM, Lander ES. Genetic screens in human cells using the CRISPR-Cas9 system. Science. 2014;343:80–84. doi: 10.1126/science.1246981. [DOI] [PMC free article] [PubMed] [Google Scholar]
- 14.Jallepalli PV, et al. Securin is required for chromosomal stability in human cells. Cell. 2001;105:445–457. doi: 10.1016/s0092-8674(01)00340-3. [DOI] [PubMed] [Google Scholar]
- 15.Sanjana NE, Shalem O, Zhang F. Improved vectors and genome-wide libraries for CRISPR screening. Nat Methods. 2014;11:783–784. doi: 10.1038/nmeth.3047. [DOI] [PMC free article] [PubMed] [Google Scholar]
- 16.Luo B, et al. Highly parallel identification of essential genes in cancer cells. Proc Natl Acad Sci U S A. 2008;105:20380–20385. doi: 10.1073/pnas.0810485105. [DOI] [PMC free article] [PubMed] [Google Scholar]
- 17.Stefansson B, Ohama T, Daugherty AE, Brautigan DL. Protein phosphatase 6 regulatory subunits composed of ankyrin repeat domains. Biochemistry. 2008;47:1442–1451. doi: 10.1021/bi7022877. [DOI] [PubMed] [Google Scholar]
- 18.He TC, et al. Identification of c-MYC as a target of the APC pathway. Science. 1998;281:1509–1512. doi: 10.1126/science.281.5382.1509. [DOI] [PubMed] [Google Scholar]
- 19.Zuber J, et al. RNAi screen identifies Brd4 as a therapeutic target in acute myeloid leukaemia. Nature. 2011;478:524–528. doi: 10.1038/nature10334. [DOI] [PMC free article] [PubMed] [Google Scholar]
- 20.O'Donnell KA, Wentzel EA, Zeller KI, Dang CV, Mendell JT. c-Myc-regulated microRNAs modulate E2F1 expression. Nature. 2005;435:839–843. doi: 10.1038/nature03677. [DOI] [PubMed] [Google Scholar]
- 21.Ji M, et al. The miR-17-92 microRNA cluster is regulated by multiple mechanisms in B-cell malignancies. Am J Pathol. 2011;179:1645–1656. doi: 10.1016/j.ajpath.2011.06.008. [DOI] [PMC free article] [PubMed] [Google Scholar]
- 22.Lee YS, Dutta A. The tumor suppressor microRNA let-7 represses the HMGA2 oncogene. Genes Dev. 2007;21:1025–1030. doi: 10.1101/gad.1540407. [DOI] [PMC free article] [PubMed] [Google Scholar]
- 23.Mayr C, Hemann MT, Bartel DP. Disrupting the pairing between let-7 and Hmga2 enhances oncogenic transformation. Science. 2007;315:1576–1579. doi: 10.1126/science.1137999. [DOI] [PMC free article] [PubMed] [Google Scholar]
- 24.Tokumaru S, Suzuki M, Yamada H, Nagino M, Takahashi T. let-7 regulates Dicer expression and constitutes a negative feedback loop. Carcinogenesis. 2008;29:2073–2077. doi: 10.1093/carcin/bgn187. [DOI] [PubMed] [Google Scholar]
- 25.Kinoshita E, Kinoshita-Kikuta E, Takiyama K, Koike T. Phosphate-binding tag, a new tool to visualize phosphorylated proteins. Mol Cell Proteomics. 2006;5:749–757. doi: 10.1074/mcp.T500024-MCP200. [DOI] [PubMed] [Google Scholar]
- 26.Zeng Y, Sankala H, Zhang X, Graves PR. Phosphorylation of Argonaute 2 at serine-387 facilitates its localization to processing bodies. Biochem J. 2008;413:429–436. doi: 10.1042/BJ20080599. [DOI] [PubMed] [Google Scholar]
- 27.Schirle NT, MacRae IJ. The crystal structure of human Argonaute2. Science. 2012;336:1037–1040. doi: 10.1126/science.1221551. [DOI] [PMC free article] [PubMed] [Google Scholar]
- 28.Elkayam E, et al. The structure of human argonaute-2 in complex with miR-20a. Cell. 2012;150:100–110. doi: 10.1016/j.cell.2012.05.017. [DOI] [PMC free article] [PubMed] [Google Scholar]
- 29.Liu Q, et al. miR-16 family induces cell cycle arrest by regulating multiple cell cycle genes. Nucleic Acids Res. 2008;36:5391–5404. doi: 10.1093/nar/gkn522. [DOI] [PMC free article] [PubMed] [Google Scholar]
- 30.Flores-Jasso CF, Salomon WE, Zamore PD. Rapid and specific purification of Argonaute-small RNA complexes from crude cell lysates. RNA. 2013;19:271–279. doi: 10.1261/rna.036921.112. [DOI] [PMC free article] [PubMed] [Google Scholar]
- 31.Cummins JM, et al. The colorectal microRNAome. Proc Natl Acad Sci U S A. 2006;103:3687–3692. doi: 10.1073/pnas.0511155103. [DOI] [PMC free article] [PubMed] [Google Scholar]
- 32.Pillai RS, Artus CG, Filipowicz W. Tethering of human Ago proteins to mRNA mimics the miRNA-mediated repression of protein synthesis. RNA. 2004;10:1518–1525. doi: 10.1261/rna.7131604. [DOI] [PMC free article] [PubMed] [Google Scholar]
- 33.Knippschild U, et al. The casein kinase 1 family: participation in multiple cellular processes in eukaryotes. Cell Signal. 2005;17:675–689. doi: 10.1016/j.cellsig.2004.12.011. [DOI] [PubMed] [Google Scholar]
- 34.Wang CC, Tao M, Wei T, Low PS. Identification of the major casein kinase I phosphorylation sites on erythrocyte band 3. Blood. 1997;89:3019–3024. [PubMed] [Google Scholar]
- 35.Schirle NT, Sheu-Gruttadauria J, MacRae IJ. Structural basis for microRNA targeting. Science. 2014;346:608–613. doi: 10.1126/science.1258040. [DOI] [PMC free article] [PubMed] [Google Scholar]
- 36.Hansen TB, et al. Natural RNA circles function as efficient microRNA sponges. Nature. 2013;495:384–388. doi: 10.1038/nature11993. [DOI] [PubMed] [Google Scholar]
- 37.Van Nostrand EL, et al. Robust transcriptome-wide discovery of RNA-binding protein binding sites with enhanced CLIP (eCLIP) Nat Methods. 2016;13:508–514. doi: 10.1038/nmeth.3810. [DOI] [PMC free article] [PubMed] [Google Scholar]
- 38.Tani H, et al. Genome-wide determination of RNA stability reveals hundreds of short-lived noncoding transcripts in mammals. Genome Res. 2012;22:947–956. doi: 10.1101/gr.130559.111. [DOI] [PMC free article] [PubMed] [Google Scholar]
Associated Data
This section collects any data citations, data availability statements, or supplementary materials included in this article.
Supplementary Materials
Data Availability Statement
All high-throughput sequencing data generated in the course of this study (CRISPR-Cas9 screens, RNA-seq, eCLIP) have been deposited in GEO under accession code GSE89946.


