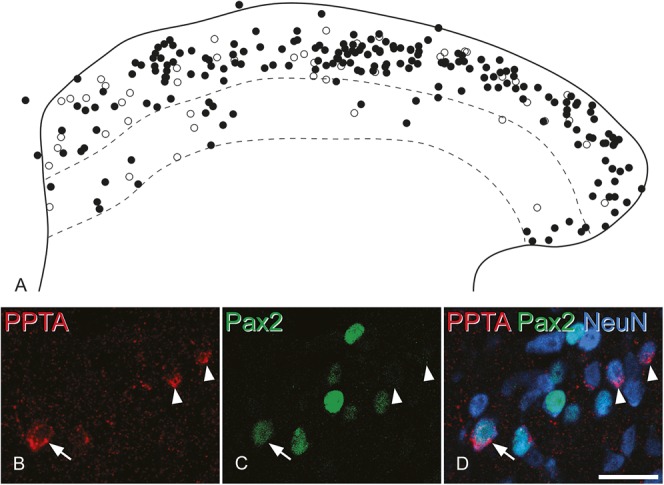
Figure 2.

The distribution of excitatory and inhibitory preprotachykinin A (PPTA) cells. (A) Plot of the distribution of all PPTA-immunoreactive cells obtained from the stereological analysis of 3 mice (2 sections each) showing the location of Pax2-negative (excitatory) cells as filled circles and Pax2-positive (inhibitory) cells as open circles. The solid line represents the outline of the gray matter, and the upper and lower dashed lines represent the borders between laminae II-III and III-IV, respectively. (B–D) Examples of Pax2-negative and positive cells seen in confocal images. These have been scanned to reveal PPTA (red), Pax2 (green), and NeuN (blue). The arrow indicates a PPTA-immunoreactive cell that was Pax2 positive, whereas the arrowheads show 2 PPTA-immunoreactive cells that lack Pax2. The images are projections of 3 optical sections at 2 μm z-spacing. Scale bar = 20 μm.
