

Summary
Height is a highly heritable, classic polygenic trait with ∼700 common associated variants identified so far through genome-wide association studies. Here, we report 83 height-associated coding variants with lower minor allele frequencies (range of 0.1-4.8%) and effects of up to 2 cm/allele (e.g. in IHH, STC2, AR and CRISPLD2), >10 times the average effect of common variants. In functional follow-up studies, rare height-increasing alleles of STC2 (+1-2 cm/allele) compromised proteolytic inhibition of PAPP-A and increased cleavage of IGFBP-4 in vitro, resulting in higher bioavailability of insulin-like growth factors. These 83 height-associated variants overlap genes mutated in monogenic growth disorders and highlight new biological candidates (e.g. ADAMTS3, IL11RA, NOX4) and pathways (e.g. proteoglycan/glycosaminoglycan synthesis) involved in growth. Our results demonstrate that sufficiently large sample sizes can uncover rare and low-frequency variants of moderate to large effect associated with polygenic human phenotypes, and that these variants implicate relevant genes and pathways.
Introduction
Human height is a highly heritable, polygenic trait1,2. The contribution of common DNA sequence variation to inter-individual differences in adult height has been systematically evaluated through genome-wide association studies (GWAS). This approach has thus far identified 697 independent variants located within 423 loci that together explain ∼20% of the heritability of height3. As is typical of complex traits and diseases, most of the height alleles discovered so far are common (minor allele frequency (MAF) >5%) and are mainly located outside coding regions, complicating the identification of the relevant genes or functional variants. Identifying coding variants associated with a complex trait in new or known loci has the potential to pinpoint causal genes. Furthermore, the extent to which rare (MAF <1%) and low-frequency (1%< MAF ≤ 5%) coding variants also influence complex traits and diseases remains an open question. Many recent DNA sequencing studies have identified only few such variants4-8, but this limited success could be due to their modest sample size9. Some studies have suggested that common sequence variants may explain the majority of the heritable variation in adult height10, making it timely to assess whether and to what extent rare and low-frequency coding variation contributes to the genetic landscape of this model polygenic trait.
In this study, we used an ExomeChip11 to test the association between 241,453 variants (83% coding with MAF ≤5%) and adult height variation in 711,428 individuals (discovery and validation sample sizes were 458,927 and 252,501, respectively). The ExomeChip is a genotyping array designed to query in very large sample sizes coding variants identified by whole-exome DNA sequencing of ∼12,000 participants. The main goals of our project were to determine whether rare and low-frequency coding variants influence the architecture of a model complex human trait, such as adult height, and to discover and characterize new genes and biological pathways implicated in human growth.
Results
32 rare and 51 low-frequency coding variants associated with adult height
We conducted single-variant meta-analyses in a discovery sample of 458,927 individuals, of whom 381,625 were of European ancestry. We validated our association results in an independent set of 252,501 participants. We first performed standard single-variant association analyses; technical details of the discovery and validation steps are in Methods (Extended Data Figs 1-3, Supplementary Tables 1-11). In total, we found 606 independent ExomeChip variants at array-wide significance (P<2×10⁻⁷), including 252 non-synonymous or splice site variants (Methods and Supplementary Table 11). Focusing on non-synonymous or splice site variants with MAF <5%, our single-variant analyses identified 32 rare and 51 low-frequency height-associated variants (Extended Data Tables 1-2). To date, these 83 height variants (MAF range 0.1-4.8%) represent the largest set of validated rare and low-frequency coding variants associated with any complex human trait or disease. Among these 83 variants, there are 81 missense, one nonsense (in CCND3), and one essential acceptor splice site (in ARMC5) variants.
We observed a strong inverse relationship between MAF and effect size (Fig. 1). Although power limits our capacity to find rare variants of small effects, we know that common variants with effect sizes comparable to the largest seen in our study would have been easily discovered by prior GWAS, but were not detected. Our results agree with a model based on accumulating theoretical and empirical evidences that suggest that variants with strong phenotypic effects are more likely to be deleterious, and therefore rarer12,13. The largest effect sizes were observed for four rare missense variants, located in the androgen receptor gene AR (rs137852591, MAF=0.21%, Pcombined=2.7×10⁻¹⁴), in CRISPLD2 (rs148934412, MAF=0.08%, Pcombined=2.4×10⁻²⁰), in IHH (rs142036701, MAF=0.08%, Pcombined=1.9×10⁻²³), and in STC2 (rs148833559, MAF=0.1%, Pcombined=1.2×10⁻³⁰). Carriers of the rare STC2 missense variant are ∼2.1 cm taller than non-carriers, whereas carriers of the remaining three variants (or hemizygous men that carry the X-linked AR-rs137852591 rare allele) are ∼2 cm shorter than non-carriers. In comparison, the mean effect size of common height alleles is ten times smaller in the same dataset. Across all 83 rare and low-frequency non-synonymous variants, the minor alleles were evenly distributed between height-increasing and -decreasing effects (48% vs. 52%, respectively) (Fig. 1 and Extended Data Tables 1-2).
Figure 1.

Variants with a larger effect size on height variation tend to be rarer. We observed an inverse relationship between the effect size (from the combined “discovery+validation” analysis, in cm on the y-axis) and the minor allele frequency (MAF) for the height variants (x-axis, from 0 to 50%). We included in this figure the 606 height variants with P<2×10⁻⁷.
Coding variants in new and known height loci, and heritability explained
Many of the height-associated variants in this ExomeChip effort are located near common variants previously associated with height. Of the 83 rare and low-frequency non-synonymous variants, two low-frequency missense variants were previously identified (in CYTL1 and IL11)3,14 and 47 fell within 1 Mb of a known height signal; the remaining 34 define new loci. We used conditional analysis in the UK Biobank dataset and confirmed that 38 of these 47 variants were independent from the previously described height SNPs (Supplementary Table 12). We validated the UK Biobank conditional results using an orthogonal imputation-based methodology implemented in the full discovery set (Extended Data Fig. 4 and Supplementary Table 12). In addition, we found a further 85 common variants and one low-frequency synonymous variant (in ACHE) that define novel loci (Supplementary Table 12). Thus, our study identified a total of 120 new height loci (Supplementary Table 11).
We used the UK Biobank dataset to estimate the contribution of the new height variants to heritability, which is h2∼80% for adult height2. In combination, the 83 rare and low-frequency variants explained 1.7% of the heritability of height. The newly identified novel common variants accounted for another 2.4%, and all independent variants, known and novel together explained 27.4% of heritability. By comparison, the 697 known height SNPs explain 23.3% of height heritability in the same dataset (vs. 4.1% by the new height variants identified in this ExomeChip study). We observed a modest positive association between MAF and heritability explained per variant (P=0.012, Extended Data Fig. 5), with each common variant explaining slightly more heritability than rare or low-frequency variants (0.036% vs. 0.026%, Extended Data Fig. 5).
Gene-based association results
To increase power to find rare or low-frequency coding variants associated with height, we performed gene-based analyses (Methods and Supplementary Tables 13-15). After accounting for gene-based signals explained by a single variant driving the association statistics, we identified ten genes with P<5×10⁻⁷ that harbor more than one coding variant independently associated with height variation (Supplementary Tables 16-17). These gene-based results remained significant after conditioning on genotypes at nearby common height-associated variants present on the ExomeChip (Table 1). Using the same gene-based tests in an independent dataset of 59,804 individuals genotyped on the same exome array, we replicated three genes at P<0.05 (Table 1). Further evidence for replication in these genes was seen at the level of single variants (Supplementary Table 18). From the gene-based results, three genes – CSAD, NOX4, and UGGT2 – fell outside of the loci found by single-variant analyses and are implicated in human height for the first time.
Table 1.
Ten height genes implicated by gene-based testing. These genes meet our three criteria for statistical significance: (1) gene-based P<5×10⁻⁷, (2) the gene does not include variants with P<2×10⁻⁷, and (3) the gene-based P-value is at least two orders of magnitude smaller than the P-value for the most significant variant within the gene. For each gene, we provide P-values for the four different gene-based tests applied. P-values in bold are the most significant results for a given gene.
| Gene | Discovery gene-based P-value | Validation P-value1 | Combined P-value1 | Conditional P-value2 | Note3 | |||
|---|---|---|---|---|---|---|---|---|
| SKAT-broad | VT-broad | SKAT-strict | VT-strict | |||||
| OSGIN1 | 4.3×10⁻¹¹ | 4.5×10⁻⁵ | 0.19 | 0.18 | 0.048 | 2.6×10⁻¹² | 7.7×10⁻¹¹ | Known locus. No predicted causal genes. |
| CRISPLD1 | 2.2×10⁻⁷ | 6.7×10⁻¹¹ | 8.5×10⁻⁶ | 8.9×10⁻⁷ | 0.50 | 1.2×10⁻¹² | NA | Known locus, sentinel GWAS SNP not tested on ExomeChip. CRISPLD1 was predicted to be causal. |
| CSAD | 2.3×10⁻⁸ | 2.4×10⁻⁹ | 0.83 | 0.59 | 0.54 | 2.0×10⁻⁹ | NA | New locus. |
| SNED1 | 1.9×10⁻⁵ | 4.3×10⁻⁹ | NA | NA | 0.083 | 4.5×10⁻¹⁰ | 1.4×10⁻⁹ | Known locus. SNED1 was not predicted to be causal. |
| G6PC | 1.3×10⁻⁵ | 3.6×10⁻⁸ | 5.5×10⁻⁶ | 1.3×10⁻⁶ | 0.24 | 5.2×10⁻⁸ | 3.9×10⁻⁸ | Known locus, G6PC was not predicted to be causal. G6PC is mutated in glycogen storage disease Ia. |
| NOX4 | 5.1×10⁻⁶ | 1.4×10⁻⁷ | NA | NA | 0.013 | 5.5×10⁻⁹ | NA | New locus. |
| UGGT2 | 3.0×10⁻⁵ | 2.6×10⁻⁷ | 2.3×10⁻⁵ | 4.8×10⁻⁷ | 0.64 | 3.4×10⁻⁷ | NA | New locus. |
| FLNB | 2.2×10⁻⁶ | 5.1×10⁻⁴ | 2.4×10⁻⁹ | 3.2×10⁻⁶ | 0.016 | 8.6×10⁻¹¹ | 3.6×10⁻⁹ | Known locus. FLNB was predicted to be causal. FLNB is mutated in atelosteogenesis type I. |
| B4GALNT3 | 2.4×10⁻⁵ | 1.9×10⁻⁵ | 1.8×10⁻⁵ | 3.1×10⁻⁷ | 0.79 | 4.3×10⁻⁷ | 7.7×10⁻⁷ | Known locus. B4GALNT3 was predicted to be causal. |
| CCDC3 | 6.3×10⁻⁴ | 6.3×10⁻⁶ | 3.0×10⁻⁷ | 5.4×10⁻⁹ | 0.080 | 1.2×10⁻⁹ | 1.6×10⁻⁹ | Known locus. CCDC3 was predicted to be causal. |
Validation (N=59,804) and combined results using the same test and (when possible) variants.
When the gene is located in a locus identified by our single-variant analysis (1 Mb window), we conditioned the gene-based association result on genotypes at the single variant(s).
If the gene falls within a known GWAS height locus, we mention if it was predicted to be causal using bioinformatic tools (ref. 3). NA, not applicable.
Coding variants implicate biological pathways in human skeletal growth
Prior pathway analyses of height loci identified by GWAS have highlighted gene sets related to both general biological processes (such as chromatin modification and regulation of embryonic size) and more skeletal growth-specific pathways (chondrocyte biology, extracellular matrix (ECM), and skeletal development)3. We used two different methods, DEPICT15 and PASCAL16 (Methods), to perform pathway analyses using the ExomeChip results to test whether coding variants could either independently confirm the relevance of these previously highlighted pathways (and further implicate specific genes in these pathways), or identify new pathways. To compare the pathways emerging from coding and non-coding variation, we applied DEPICT separately on (1) exome array-wide associated coding variants independent of known GWAS signals and (2) non-coding GWAS loci, excluding all novel height-associated genes implicated by coding variants. We identified a total of 496 and 1,623 enriched gene sets, respectively, at a false discovery rate (FDR) <1% (Supplementary Tables 19-20); similar analyses with PASCAL yielded 362 and 278 enriched gene sets (Supplementary Tables 21-22). Comparison of the results revealed a high degree of shared biology for coding and non-coding variants (for DEPICT, gene set P-values compared between coding and non-coding results had Pearson's r = 0.583, P<2.2×10⁻¹⁶; for PASCAL, Pearson's r=0.605, P<2.2×10⁻¹⁶). However, some pathways showed stronger enrichment with either coding or non-coding genetic variation. In general, coding variants more strongly implicated pathways specific to skeletal growth (such as ECM and bone growth), while GWAS signals highlighted more global biological processes (such as transcription factor binding and embryonic size/lethality) (Extended Data Fig. 6). The two significant gene sets identified by DEPICT and PASCAL that uniquely implicated coding variants were “BCAN protein protein interaction subnetwork” and “proteoglycan binding.” Both of these pathways relate to the biology of proteoglycans, which are proteins (such as aggrecan) that contain glycosaminoglycans (such as chrondroitin sulfate) and that have well-established connections to skeletal growth17.
We also examined which height-associated genes identified by ExomeChip analyses were driving enrichment of pathways such as proteoglycan binding. Using unsupervised clustering analysis, we observed that a cluster of 15 height-associated genes is strongly implicated in a group of correlated pathways that include biology related to proteoglycans/glycosaminoglycans (Fig. 2 and Extended Data Fig. 7). Seven of these 15 genes overlap a previously curated list of 277 genes annotated in OMIM as causing skeletal growth disorders3; genes in this small cluster are enriched for OMIM annotations relative to genes outside the cluster (odds ratio=27.6, Fisher's exact P=1.1×10⁻⁵). As such, the remaining genes in this cluster may be strong candidates for harboring variants that cause Mendelian growth disorders. Within this group are genes that are largely uncharacterized (SUSD5), have relevant biochemical functions (GLT8D2, a glycosyl transferase studied mostly in the context of the liver18; LOXL4, a lysyl oxidase expressed in cartilage19), modulate pathways known to affect skeletal growth (FIBIN, SFRP4)20,21 or lead to increased body length when knocked out in mice (SFRP4)22.
Figure 2.

Heat map showing subset of DEPICT gene set enrichment results. The full heat map is available as Extended Data Fig. 7. For any given square, the color indicates how strongly the corresponding gene (shown on the x-axis) is predicted to belong to the reconstituted gene set (y-axis). This value is based on the gene's Z-score for gene set inclusion in DEPICT's reconstituted gene sets, where red indicates a higher Z-score and blue indicates a lower one. The proteogly can binding pathway (bold) was uniquely implicated by coding variants by DEPICT and PASCAL. To visually reduce redundancy and increase clarity, we chose one representative “meta-gene set” for each group of highly correlated gene sets based on affinity propagation clustering (Supplementary Information). Heat map intensity and DEPICT P-values correspond to the most significantly enriched gene set within the meta-gene set; meta-gene sets are listed with their database source. Annotations for the genes indicate whether the gene has OMIM annotation as underlying a disorder of skeletal growth (black and grey) and the minor allele frequency of the significant ExomeChip (EC) variant (shades of blue; if multiple variants, the lowest-frequency variant was kept). Annotations for the gene sets indicate if the gene set was also found significant for EC by PASCAL (yellow and grey) and if the gene set was found significant by DEPICT for EC only or for both EC and GWAS (purple and green). Abbreviations: GO: Gene Ontology; MP: mouse phenotype in the Mouse Genetics Initiative; PPI: protein-protein interaction in the In Web database.
Functional characterization of rare STC2 variants
To begin exploring whether the identified rare coding variants affect protein function, we performed in vitro functional analyses of two rare coding variants in a particularly compelling and novel candidate gene, STC2. Over-expression of STC2 diminishes growth in mice by covalent binding and inhibition of the proteinase PAPP-A, which specifically cleaves IGF binding protein-4 (IGFBP-4), leading to reduced levels of bioactive insulin-like growth factors (Fig. 3A)23. Although there was no prior genetic evidence implicating STC2 variation in human growth, the PAPPA and IGFBP4 genes were both implicated in height GWAS3, and rare mutations in PAPPA2 cause severe short stature24, emphasizing the likely relevance of this pathway in humans. The two STC2 height-associated variants are rs148833559 (p.Arg44Leu, MAF=0.096%, Pdiscovery=5.7×10⁻¹⁵) and rs146441603 (p.Met86Ile, MAF=0.14%, Pdiscovery=2.1×10⁻⁵). These rare alleles increase height by 1.9 and 0.9 cm, respectively, suggesting that they both partially impair STC2 activity. In functional studies, STC2 with these amino acid substitutions were expressed at similar levels to wild-type, but showed clear, partial defects in binding to PAPP-A and in inhibition of PAPP-A-mediated cleavage of IGFBP-4 (Fig. 3B-D). Thus, the genetic analysis successfully identified rare coding alleles that have demonstrable and predicted functional consequences, strongly confirming the role of these variants and the STC2 gene in human growth.
Figure 3.
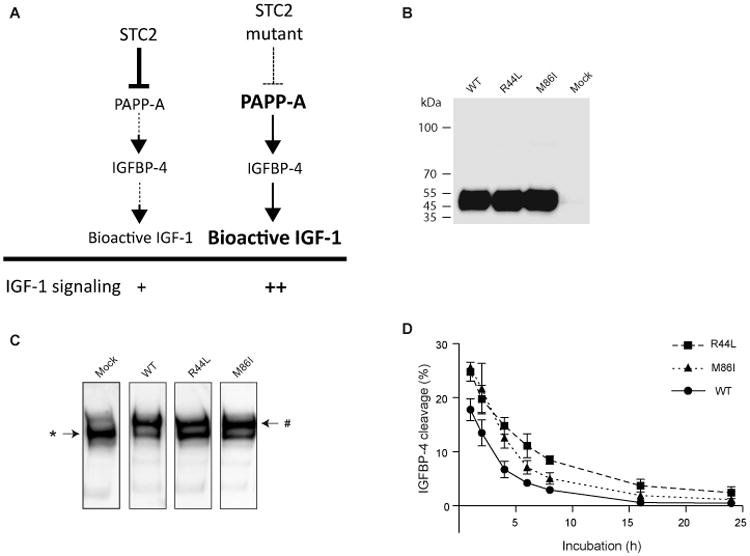
STC2 mutants p.Arg44Leu (R44L) and p.Met86Ile (M86I) show compromised proteolytic inhibition of PAPP-A. (A) Schematic representation of the role of STC2 in IGF-1 signaling. Partial inactivation of STC2 by height-associated DNA sequence variation could increase bioactive IGF-1 through reduced inhibition of PAPP-A. (B) Western blot analysis of recombinant STC2 wild-type and variants R44L and M86I. (C) Covalent complex formation between PAPP-A and STC2 wild-type or variants R44L and M86I. Separately synthesized proteins were analyzed by PAPP-A Western blotting following incubation for 8 h. In the absence of STC2 (Mock lane), PAPP-A appears as a single 400 kDa band (*). Following incubation with wild-type STC2, the majority of PAPP-A is present as the approximately 500 kDa covalent PAPP-A:STC2 complex (#), in which PAPP-A is devoid of proteolytic activity towards IGFBP-4. Under similar conditions, incubation with variants R44L or M86I appeared to cause less covalent complex formation with PAPP-A. The gels are representative of at least three independent experiments. (D) PAPP-A proteolytic cleavage of IGFBP-4 following incubation with wild-type STC2 or variants for 1-24 h. Wild-type STC2 causes reduction in PAPP-A activity, with complete inhibition of activity following 24 h incubation. Both STC2 variants show increased IGFBP-4 cleavage (i.e. less inhibition) for all time points analyzed. Mean and standard deviations of three independent experiments are shown. One-way repeated measures analysis of variance followed by Dunnett's post-test showed significant differences between STC2 wild-type and variants R44L (P<0.001) and M86I (P<0.01).
Pleiotropic effects
Previous GWAS studies have reported pleiotropic or secondary effects on other phenotypes for many common variants associated with adult height3,25. Using association results from 17 human complex phenotypes for which well-powered meta-analysis results were available, we explored if rare and low-frequency height variants are also pleiotropic. We found one rare and five low-frequency missense variants associated with at least one of the other investigated traits at array-wide significance (P<2×10⁻⁷)(Extended Data Fig. 8 and Supplementary Table 23). The minor alleles at rs77542162 (ABCA6, MAF=1.7%) and rs28929474 (SERPINA1, MAF=1.8%) were associated with increased height and increased levels of LDL-cholesterol (LDL-C) and total cholesterol (TC), whereas the minor allele at rs3208856 in CBLC (MAF=3.4%) was associated with increased height, HDL-cholesterol (HDL-C) and triglyceride (TG), but lower LDL-C and TC levels. The minor allele at rs141845046 (ZBTB7B, MAF=2.8%) was associated with both increased height and body mass index (BMI). The minor alleles at the other two missense variants associated with shorter stature, rs201226914 in PIEZO1 (MAF=0.2%) and rs35658696 in PAM (MAF=4.8%), were associated with decreased glycated haemoglobin (HbA1c) and increased type 2 diabetes (T2D) risk, respectively.
Discussion
We undertook an association study of nearly 200,000 coding variants in 711,428 individuals, and identified 32 rare and 51 low-frequency coding variants associated with adult height. Furthermore, gene-based testing discovered 10 genes that harbor several additional rare/low-frequency variants associated with height, including three genes (CSAD, NOX4, UGGT2) in loci not previously implicated in height. Given the design of the ExomeChip, which did not consider variants with MAF <0.004% (or one allele in ∼12,000 participants), our gene-based association results do not rule out the possibility that additional genes with such rarer coding variants also contribute to height variation; deep DNA sequencing in very large sample sizes will be required to address this question. In total, our results highlight 89 genes (10 from gene-based testing and 79 from single-variant analyses (four genes have 2 independent coding variants)) that are likely to modulate human growth, and 24 alleles segregating in the general population that affect height by more than 1 cm (Extended Data Tables 1-2 and Table 1). The rare and low-frequency coding variants explain 1.7% of the heritable variation in adult height. When considering all rare, low-frequency, and common height-associated variants validated in this study, we can now explain 27.4% of the heritability.
Our analyses revealed many coding variants in genes mutated in monogenic skeletal growth disorders, confirming the presence of allelic series (from familial penetrant mutations to mild effect common variants) in the same genes for related growth phenotypes in humans. We used gene set enrichment-type analyses to demonstrate the functional connectivity between the genes that harbor coding height variants, highlighting known as well as novel biological pathways that regulate height in humans (Fig. 2, Extended Data Fig. 7 and Supplementary Tables 19-22), and newly implicating genes such as SUSD5, GLT8D2, LOXL4, FIBIN, and SFRP4 that have not been previously connected with skeletal growth. Additional interesting height candidate genes include NOX4, ADAMTS3 and ADAMTS6, PTH1R, and IL11RA (Extended Data Tables 1-2, Supplementary Tables 17 and 24). NOX4, identified through gene-based testing, encodes NADPH oxidase 4, an enzyme that produces reactive oxygen species, a biological pathway not previously implicated in human growth. Nox4-/- mice display higher bone density and reduced numbers of osteoclasts, a cell type essential for bone repair, maintenance, and remodelling12. We also found rare coding variants in ADAMTS3 and ADAMTS6, genes that encode metalloproteinases that belong to the same family than several other human growth syndromic genes (e.g. ADAMTS2, ADAMTS10, ADAMTSL2). Moreover, we discovered a rare missense variant in PTH1R that encodes a receptor of the parathyroid hormone (PTH): PTH-PTH1R signaling is important for bone resorption and mutations in PTH1R cause chondrodysplasia in humans26. Finally, we replicated the association between a low-frequency missense variant in the cytokine gene IL11, but also found a new low-frequency missense variant in its receptor gene IL11RA. The IL11-IL11RA axis has been shown to play an important role in bone formation in the mouse27,28. Thus, our data confirm the relevance of this signaling cascade in human growth as well.
Overall, our findings provide strong evidence that rare and low-frequency coding variants contribute to the genetic architecture of height, a model complex human trait. This conclusion has strong implications for the prediction of complex human phenotypes in the context of precision medicine initiatives. Indeed, although rare, large effect size variants might not explain most of the heritable disease risk at the population level, they are important to predict the risk to develop disease for individuals that carry them. Our findings also seem to contrast sharply with results from the recent large-scale T2D association study, which found only six variants with MAF <5% (ref. 29). This apparent difference could simply be explained by the large difference in sample sizes between the two studies (711,428 for height vs. 127,145 for T2D). When we consider the fraction of associated variants with MAF<5% among all confirmed variants for height and T2D, we find that it is similar (9.7% for height vs. 7.1% for T2D). This supports the strong probability that rarer T2D alleles and more generally, rarer alleles for other polygenic diseases and traits, will be uncovered as sample sizes continue to increase.
Methods
Study design & participants
The discovery cohort consisted of 147 studies comprising 458,927 adult individuals of the following ancestries: 1) European descent (N=381,625), 2) African (N=27,494), 3) South Asian (N=29,591), 4) East Asian (N=8,767); 5) Hispanic (N=10,776) and 6) Saudi (N=695). All participating institutions and coordinating centers approved this project, and informed consent was obtained from all subjects. Discovery meta-analysis was carried out in each ancestry group (except the Saudi) separately as well as in the All group. Validation was undertaken in individuals of European ancestry only (Supplementary Tables 1-3). Conditional analyses were undertaken only in the European descent group (106 studies, N=381,625).
Phenotype
Height (in centimeters) was corrected for age and the genomic principal components (derived from GWAS data, the variants with MAF >1% on ExomeChip, or ancestry informative markers available on the ExomeChip), as well as any additional study-specific covariates (e.g. recruiting center), in a linear regression separately by sex, whereas for family-based studies sex was included as a covariate in model. For studies with non-related individuals, residuals were calculated the model. Additionally, residuals for case/control studies were calculated separately. Finally, residuals were subject to inverse normal transformation.
Genotype calling
The majority of studies followed a standardized protocol and performed genotype calling using the designated manufacturer software, which was then followed by zCall31. For 10 studies participating in the Cohorts for Heart and Aging Research in Genomic Epidemiology (CHARGE) Consortium, the raw intensity data for the samples from seven genotyping centers were assembled into a single project for joint calling11. Study-specific quality control (QC) measures of the genotyped variants was implemented before association analysis (Supplementary Tables 1-2).
Study-level statistical analyses
Individual cohorts were analyzed separately for each ancestry population, with either RAREMETALWORKER (http://genome.sph.umich.edu/wiki/RAREMETALWORKER) or RVTEST (http://zhanxw.github.io/rvtests/), to associate inverse normal transformed height data with genotype data taking potential cryptic relatedness (kinship matrix) into account in a linear mixed model. These software are designed to perform score-statistics based rare-variant association analysis, can accommodate both unrelated and related individuals, and provide single-variant results and variance-covariance matrix. The covariance matrix captures linkage disequilibrium (LD) relationships between markers within 1 Mb, which is used for gene-level meta-analyses and conditional analyses32. Single-variant analyses were performed for both additive and recessive models (for the alternate allele).
Centralized quality-control
The individual study data were investigated for potential existence of ancestry population outliers based on 1000 Genome Project phase 1 ancestry reference populations. A centralized QC procedure implemented in EasyQC33 was applied to individual study association summary statistics to identify outlying studies: (1) assessment of possible problems in height transformation,(2) comparison of allele frequency alignment against 1000 Genomes Project phase 1 reference data to pinpoint any potential strand issues, and (3) examination of quantile-quantile (QQ) plots per study to identify any problems arising from population stratification, cryptic relatedness and genotype biases. We excluded variants if they had call rate <95%, Hardy-Weinberg equilibrium P<1×10⁻⁷, or large allele frequency deviations from reference populations (>0.6 for all ancestry analyses and >0.3 for ancestry-specific population analyses). We also excluded from downstream analyses markers not present on the Illumina ExomeChip array 1.0, variants on the Y-chromosome or the mitochondrial genome, indels, multiallelic variants, and problematic variants based on the Blat-based sequence alignment analyses. Meta-analyses were carried out in parallel by two different analysts at two sites.
Single-variant meta-analyses
Discovery analyses
We conducted single-variant meta-analyses in a discovery sample of 458,927 individuals of different ancestries using both additive and recessive genetic models (Extended Data Fig. 1 and Supplementary Tables 1-4). Significance for single-variant analyses was defined at array-wide level (P<2×10⁻⁷, Bonferroni correction for 250,000 variants). The combined additive analyses identified 1,455 unique variants that reached array-wide significance (P<2×10⁻⁷), including 578 non-synonymous and splice site variants (Supplementary Tables 5-7). Under the additive model, we observed a high genomic inflation of the test statistics (e.g. λGC of 2.7 in European-ancestry studies for common markers, Extended Data Fig. 2 and Supplementary Table 8), although validation results (see below) and additional sensitivity analyses (see below) suggested that it is consistent with polygenic inheritance as opposed to population stratification, cryptic relatedness, or technical artifacts (Extended Data Fig. 2). The majority of these 1,455 association signals (1,241; 85.3%) were found in the European-ancestry meta-analysis (85.5% of the discovery sample size) (Extended Data Fig. 2). Nevertheless, we discovered eight associations within five loci in our all-ancestry analyses that are driven by African studies (including one missense variant in the growth hormone gene GH1 (rs151263636), Extended Data Fig. 3), three height variants found only in African studies, and one rare missense marker associated with height in South Asians only (Supplementary Table 7).
Genomic inflation and confounding
We observed a marked genomic inflation of the test statistics even after adequate control for population stratification (linear mixed model) arising mainly from common markers; λGC in European-ancestry was 1.2 and 2.7 for all and common markers, respectively (Extended Data Fig. 2 and Supplementary Table 8). Such inflation is expected for a highly polygenic trait like height, and is consistent with our very large sample size3,34. To confirm this, we applied the recently developed linkage disequilibrium (LD) score regression method to our height ExomeChip results30, with the caveats that the method was developed (and tested) with >200,000 common markers available. We restricted our analyses to 15,848 common variants (MAF ≥5%) from the European-ancestry meta-analysis, and matched them to pre-computed LD scores for the European reference dataset30. The intercept of the regression of the χ2 statistics from the height meta-analysis on the LD score estimate the inflation in the mean χ2 due to confounding bias, such as cryptic relatedness or population stratification. The intercept was 1.4 (standard error=0.07), which is small when compared to the λGC of 2.7. Furthermore, we also confirmed that the LD score regression intercept is estimated upward because of the small number of variants on the ExomeChip and the selection criteria for these variants (i.e. known GWAS hits). The ratio statistic of (intercept -1) / (mean χ2 -1) is 0.067 (standard error=0.012), well within the normal range30, suggesting that most of the inflation (∼93%) observed in the height association statistics is due to polygenic effects (Extended Data Fig. 2).
Furthermore, to exclude the possibility that some of the observed associations between height and rare/low-frequency variants could be due to allele calling problems in the smaller studies, we performed a sensitivity meta-analysis with primarily Europe-ancestry studies totaling >5,000 participants. We found very concordant effect sizes, suggesting that smaller studies do not bias our results (Extended Data Fig. 2).
Conditional analyses
The RAREMETAL R-package35 and the GCTA v1.2436 software were used to identify independent height association signals across the European descent meta-analysis results. RAREMETAL performs conditional analyses by using covariance matrices in order to distinguish true signals from those driven by LD at adjacent known variants. First, we identified the lead variants (P<2×10⁻⁷) based on a 1 Mb window centered on the most significantly associated variant and performed LD pruning (r2<0.3) to avoid downstream problems in the conditional analyses due to co-linearity. We then conditioned on the LD-pruned set of lead variants in RAREMETAL and kept new lead signals at P<2×10⁻⁷. The process was repeated until no additional signal emerged below the pre-specified P-value threshold. The use of a 1 Mb window in RAREMETAL can obscure dependence between conditional signals in adjacent intervals in regions of extended LD. To detect such instances, we performed joint analyses using GCTA with the ARIC and UK ExomeChip reference panels, both of which comprise >10,000 individuals of European descent. With the exception of a handful of variants in a few genomic regions with extended LD (e.g. the HLA region on chromosome 6), the two software identified the same independent signals (at P<2×10⁻⁷).
To discover new height variants, we conditioned the height variants found in our ExomeChip study on the previously published GWAS height variants3 using the first release of the UK Biobank imputed dataset and regression methodology implemented in BOLT-LMM37. Because of the difference between the sample size of our discovery set (N=458,927) and the UK Biobank (first release, N=120,084), we applied a threshold of Pconditional<0.05 to declare a height variant as independent in this analysis. We also explored an alternative approach based on approximate conditional analysis36. This latter method (SSimp) relies on summary statistics available from the same cohort, thus we first imputed summary statistics38 for exome variants, using summary statistics from the Wood et al. 2014 study3. Conversely, we imputed the top variants from the Wood et al. 2014 study using the summary statistics from the ExomeChip. Subsequently, we calculated effect sizes for each exome variant conditioned on the Wood et al. 2014 top variants in two ways. First, we conditioned the imputed summary statistics of the exome variant on the summary statistics of the Wood et al. 2014 top variants that fell within 5 Mb of the target ExomeChip variant. Second, we conditioned the summary statistics of the ExomeChip variant on the imputed summary statistics of the Wood et al. 2014 hits. We then selected the option that yielded a higher imputation quality. For poorly tagged variants (r̂2 < 0.8), we simply used up-sampled HapMap summary statistics for the approximate conditional analysis. Pairwise SNP-by-SNP correlations were estimated from the UK10K data (TwinsUK39 and ALSPAC40 studies, N=3,781).
Validation of the single-variant discovery results
Several studies, totaling 252,501 independent individuals of European ancestry, became available after the completion of the discovery analyses, and were thus used for validation of our experiment. We validated the single-variant association results in eight studies, totaling 59,804 participants, genotyped on the Exomechip using RAREMETAL32. We sought additional evidence for association for the top signals in two independent studies in the UK (UK Biobank) and Iceland (deCODE), comprising 120,084 and 72,613 individuals, respectively. We used the same QC and analytical methodology as described above. Genotyping and study descriptives are provided in Supplementary Tables 1-3. For the combined analysis, we used the inverse-variance weighted fixed effects meta-analysis method using METAL41. Significant associations were defined as those with a combined meta-analysis (discovery and validation) Pcombined<2×10⁻⁷.
We considered 81 variants with suggestive association in the discovery analyses (2×10⁻⁷<Pdiscovery≤2×10⁻⁶). Of those 81 variants, 55 reached significance after combining discovery and replication results based on Pcombined<2×10⁻⁷ (Supplementary Table 9). Furthermore, recessive modeling confirmed seven new independent markers with Pcombined<2×10⁻⁷ (Supplementary Table 10). One of these recessive signals is due to a rare X-linked variant in the AR gene (rs137852591, MAF=0.21%). Because of its frequency, we only tested hemizygous men (we did not identify homozygous women for the minor allele) so we cannot distinguish between a true recessive mode of inheritance or a sex-specific effect for this variant. To test the independence and integrate all height markers from the discovery and validation phase, we used conditional analyses and GCTA “joint” modeling36 in the combined discovery and validation set. This resulted in the identification of 606 independent height variants, including 252 non-synonymous or splice site variants (Supplementary Table 11). If we only consider the initial set of lead SNPs with P<2×10⁻⁷, we identified 561 independent variants. Of these 561 variants (selected without the validation studies), 560 have concordant direction of effect between the discovery and validation studies, and 548 variants have a Pvalidation<0.05 (466 variants with Pvalidation<8.9×10⁻⁵, Bonferroni correction for 561 tests), suggesting a very low false discovery rate (Supplementary Table 11).
Gene-based association meta-analyses
For the gene-based analyses, we applied two different sets of criteria to select variants, based on coding variant annotation from five prediction algorithms (PolyPhen2 HumDiv and HumVar, LRT, Mutation Taster and SIFT)42. The mask labeled “broad” included variants with a MAF <0.05 that are nonsense, stop-loss, splice site, as well as missense variants that are annotated as damaging by at least one program mentioned above. The mask labeled “strict” included only variants with MAF <0.05 that are nonsense, stop-loss, splice site, as well as missense variants annotated as damaging by all five algorithms. We used two tests for gene-based testing, namely the SKAT43 and VT44 tests. Statistical significance for gene-based tests was set at a Bonferroni-corrected threshold of P<5×10⁻⁷ (threshold for 25,000 genes and four tests). The gene-based discovery results were validated (same test and variants, when possible) in the same eight studies genotyped on the ExomeChip (N=59,804 participants) that were used for the validation of the single-variant results (see above, and Supplementary Tables 1-3). Gene-based conditional analyses were performed in RAREMETAL.
Pleiotropy analyses
We accessed ExomeChip data from GIANT (BMI, waist-hip ratio), GLGC (total cholesterol (TC), triglycerides (TG), HDL-cholesterol (HDL-C), LDL-cholesterol (LDL-C)), IBPC (systolic and diastolic blood pressure), MAGIC (glycaemic traits), REPROGEN (age at menarche and menopause), and DIAGRAM (type 2 diabetes). For coronary artery disease, we accessed 1000 Genomes Project-imputed GWAS data released by CARDIoGRAMplusC4D45.
Pathway analyses
DEPICT is a computational framework that uses probabilistically-defined reconstituted gene sets to perform gene set enrichment and gene prioritization15. For a description about gene set reconstitution please refer to references 15 and 46. In brief, reconstitution was performed by extending pre-defined gene sets (such as Gene Ontology terms, canonical pathways, protein-protein interaction subnetworks and rodent phenotypes) with genes co-regulated with genes in these pre-defined gene set using large-scale microarray-based transcriptomics data. In order to adapt the gene set enrichment part of DEPICT for ExomeChip data, we made two principal changes. First and foremost, because DEPICT for GWAS incorporates all genes within a given LD block around each index SNP, we modified DEPICT to take as input only the gene directly impacted by the coding SNP. Second, we adapted the way DEPICT adjust for confounders (such as gene length) by generating null ExomeChip association results using Swedish ExomeChip data (Malmö Diet and Cancer (MDC), All New Diabetics in Scania (ANDIS), and Scania Diabetes Registry (SDR) cohorts, N=11,899) and randomly assigning phenotypes from a normal distribution before conducting association analysis (see Supplementary Information). For the gene set enrichment analysis of the ExomeChip data, we used significant non-synonymous variants statistically independent of known GWAS hits (and that were present in the null ExomeChip data; see Supplementary Information for details). For gene set enrichment analysis of the GWAS data, we used all loci (1) with a non-coding index SNP and (2) that did not contain any of the novel ExomeChip genes. In visualizing the analysis, we used affinity propagation clustering47 to group the most similar reconstituted gene sets based on their gene memberships (see Supplementary Information). Within a “meta-gene set”, the best P-value of any member gene set was used as representative for comparison. DEPICT for ExomeChip was written using the Python programming language and the code can be found at https://github.com/RebeccaFine/height-ec-depict.
We also applied the PASCAL pathway analysis tool16 to association summary statistics for all coding variants. In brief, the method derives gene-based scores (both SUM and MAX statistics) and subsequently tests for the over-representation of high gene scores in predefined biological pathways. We used standard pathway libraries from KEGG, REACTOME and BIOCARTA, and also added dichotomized (Z-score>3) reconstituted gene sets from DEPICT15. To accurately estimate SNP-by-SNP correlations even for rare variants, we used the UK10K data (TwinsUK39 and ALSPAC40 studies, N=3781). In order to separate the contribution of regulatory variants from the coding variants, we also applied PASCAL to association summary statistics of only regulatory variants (20 kb upstream, gene body excluded) from the Wood et al. study3. In this way, we could classify pathways driven principally by coding, regulatory or mixed signals.
STC2 functional experiments
Mutagenesis, cell culture and transfection
For the generation of STC2 mutants (R44L and M86I), wild-type STC2 cDNA contained in pcDNA3.1/Myc-His(-) (Invitrogen)23 was used as a template. Mutagenesis was carried out using Quickchange (Stratagene), and all constructs were verified by sequence analysis. Recombinant wild-type STC2 and variants were expressed in human embryonic kidney (HEK) 293T cells (293tsA1609neo, ATCC CRL-3216) maintained in high-glucose DMEM supplemented 10% fetal bovine serum, 2 mM glutamine, nonessential amino acids, and gentamicin. The cells are routinely tested for mycoplasma contamination. Cells (6×10⁶) were plated onto 10 cm-dishes and transfected 18 h later by calcium phosphate coprecipitation using 10 μg plasmid DNA. Media were harvested 48 h post transfection, cleared by centrifugation, and stored at -20°C until use. Protein concentrations (58-66 nM) were determined by TRIFMA using antibodies described previously23. PAPP-A was expressed stably in HEK293T cells as previously reported48. Expressed levels of PAPP-A (27.5 nM) were determined by a commercial ELISA (AL-101, Ansh Labs, TX).
STC2 and PAPP-A complex formation
Culture supernatants containing wild-type STC2 or variants were adjusted to 58 nM, added an equal volume of culture supernatant containing PAPP-A corresponding to a 2.1-fold molar excess, and incubated at 37°C. Samples were taken at 1, 2, 4, 6, 8, 16, and 24 h and stored at -20°C.
Analysis of proteolytic activity
Specific proteolytic cleavage of 125I-labeled IGFBP-4 is described in detail elsewhere49. Briefly, the PAPP-A:STC2 complex mixtures were diluted (1:190) to a concentration of 145 pM PAPP-A and mixed with preincubated 125I-IGFBP4 (10 nM) and IGF-1 (100 nM) in 50 mM Tris-HCl, 100 mM NaCl, 1 mM CaCl2. Following 1 h incubation at 37°C, reactions were terminated by the addition of SDS-PAGE sample buffer supplemented with 25 mM EDTA. Substrate and co-migrating cleavage products were separated by 12% nonreducing SDS-PAGE and visualized by autoradiography using a storage phosphor screen (GE Healthcare) and a Typhoon imaging system (GE Healthcare). Band intensities were quantified using ImageQuant TL 8.1 software (GE Healthcare).
Western blotting
STC2 and covalent complexes between STC2 and PAPP-A were blotted onto PVDF membranes (Millipore) following separation by 3-8% SDS-PAGE. The membranes were blocked with 2% Tween-20, and equilibrated in 50 mM Tris-HCl, 500 mM NaCl, 0.1% Tween-20, pH 9 (TST). For STC2, the membranes were incubated with goat polyclonal anti-STC2 (R&D systems, AF2830) at 0.5 μg/ml in TST supplemented with 2% skim milk for 1 h at 20°C. For PAPP-A:STC2 complexes, the membranes were incubated with rabbit polyclonal anti-PAPP-A50 at 0.63 μg/ml in TST supplemented with 2% skim milk for 16 h at 20°C. Membranes were washed with TST and subsequently incubated with polyclonal swine anti-rabbit IgG-HRP (DAKO, P0217) or polyclonal rabbit anti-goat IgG-HRP (DAKO, P0449), respectively, diluted 1:2000 in TST supplemented with 2% skim milk for 1 h at 20°C. Following washing with TST, membranes were developed using enhanced chemiluminescence (ECL Prime, GE Healthcare). Images were captured using an ImageQuant LAS 4000 instrument (GE Healthcare).
Data Availability Statement
Summary genetic association results are available on the GIANT website: http://portals.broadinstitute.org/collaboration/giant/index.php/GIANT_consortium.
URLs
ClinVar, http://www.ncbi.nlm.nih.gov/clinvar/
DEPICT, http://www.broadinstitute.org/mpg/depict/
ExomeChip, http://genome.sph.umich.edu/wiki/Exome_Chip_Design
ExomeDEPICT, https://github.com/RebeccaFine/height-ec-depict
OMIM, http://omim.org/
PASCAL, http://www2.unil.ch/cbg/index.php?title=Pascal
RAREMETALWORKER, http://genome.sph.umich.edu/wiki/RAREMETALWORKER
RVTEST, http://zhanxw.github.io/rvtests/
Extended Data
Extended Data Figure 1.
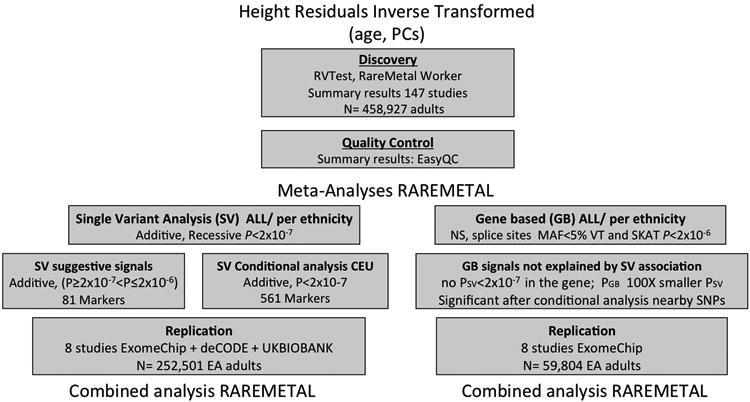
Flowchart of the GIANT ExomeChip height study design.
Extended Data Figure 2.
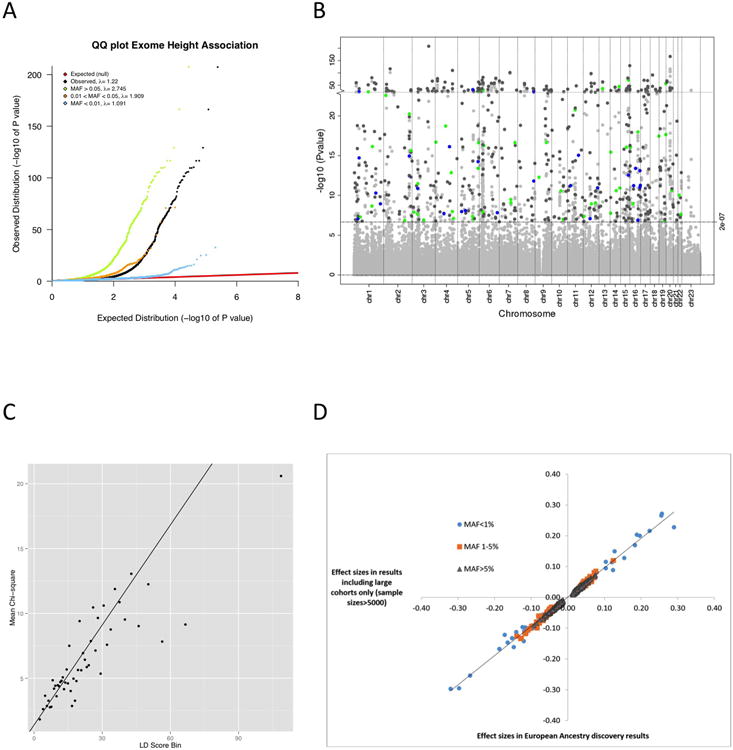
Height ExomeChip association results. (A) Quantile-quantile plot of ExomeChip variants and their association to adult height under an additive genetic model in individuals of European ancestry. We stratified results based on allele frequency. (B) Manhattan plot of all ExomeChip variants and their association to adult height under an additive genetic model in individuals of European ancestry with a focus on the 553 independent SNPs, of which 469 have MAF>5% (grey), 55 have MAF between 1 and 5% (green), and 29 have MAF<1% (blue). (C) Linkage disequilibrium (LD) score regression analysis for the height association results in European-ancestry studies. In the plot, each point represents an LD Score quantile, where the x-axis of the point is the mean LD Score of variants in that quantile and the y-axis is the mean χ2 statistic of variants in that quantile. The LD Score regression slope of the black line is calculated based on Equation 1 in Bulik-Sullivan et al.30 which is estimated upwards due to the small number of common variants (N=15,848) and the design of the ExomeChip. The LD score regression intercept is 1.4, the λGC is 2.7, the mean χ2 is 7.0, and the ratio statistic of (intercept -1) / (mean χ2 -1) is 0.067 (standard error=0.012). (D) Scatter plot comparison of the effect sizes for all variants that reached significance in the European-ancestry discovery results (N=381,625) and results including only studies with sample sizes >5000 individuals (N=241,453).
Extended Data Figure 3.
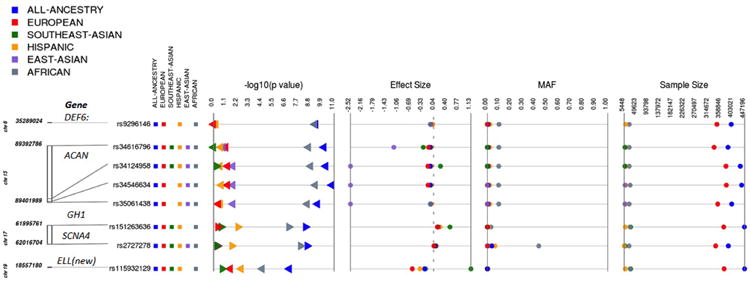
Height ExomeChip association results in African-ancestry populations. Among the all-ancestry results, we found eight variants for which the genetic association with height is mostly driven by individuals of African ancestry. The minor allele frequency of these variants is <1% (or monomorphic) in all ancestries except African-ancestry individuals. In individuals of African ancestry, the variants had allele frequencies between 9 and 40%.
Extended Data Figure 4.
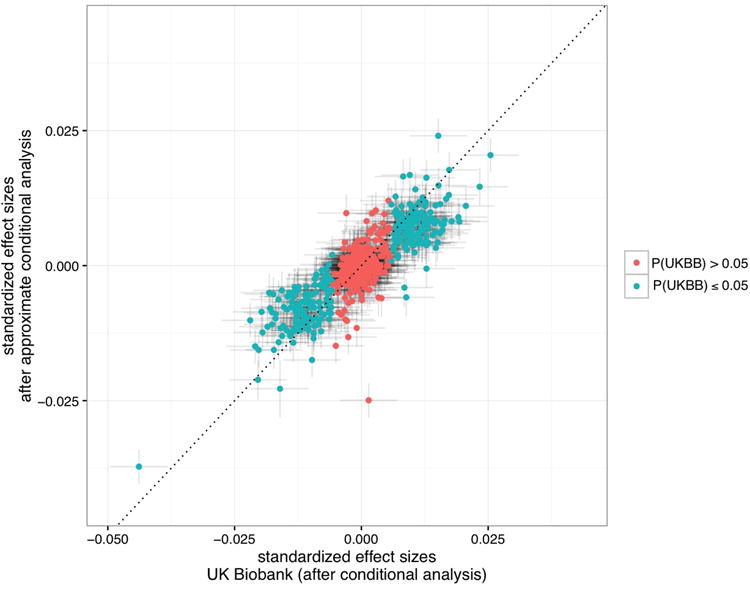
Concordance between direct conditional effect sizes using UK Biobank (x-axis) and conditional analysis performed using a combination of imputation-based methodology and approximate conditional analysis (SSimp, y-axis). The Pearson's correlation coefficient is r=0.85. The dashed line indicates the identity line. The 95% confidence interval is indicated in both directions. Red, SNPs with Pcond>0.05 in the UK Biobank; Green, SNPs with Pcond≤0.05 in the UK Biobank.
Extended Data Figure 5.
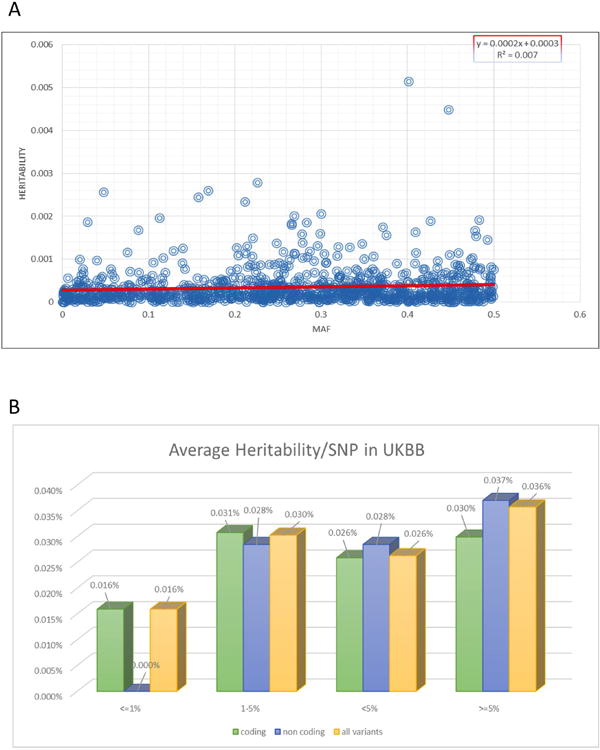
Heritability estimated for all known height variants in the first release of the UK Biobank dataset. (A) We observed a weak but significant positive trend between minor allele frequency (MAF) and heritability explained (P=0.012). (B) Average heritability explained per variant when stratifying the analyses by allele frequency or genomic annotation. For heritability estimations in UKBB, variants were pruned to r2< 0.2 in the 1000 Genomes Project data set, and the heritability figures are based on h2=80% for height.
Extended Data Figure 6.
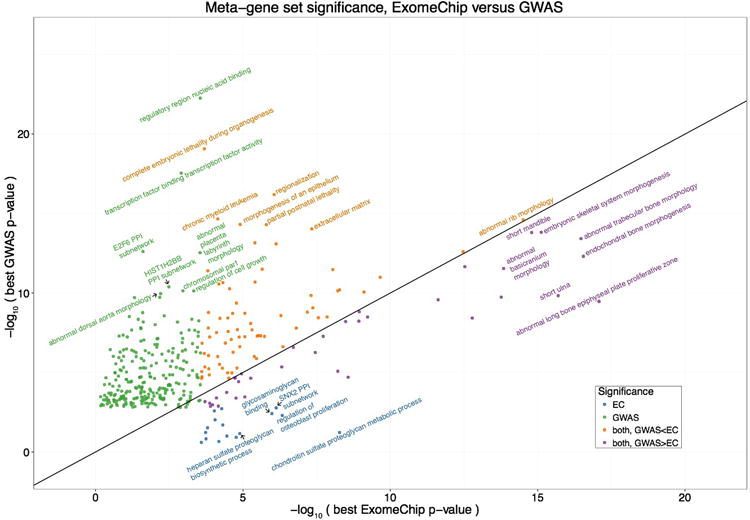
Comparison of DEPICT gene set enrichment results based on coding variation from ExomeChip (EC) or non-coding variation from genome-wide association study data (GWAS). The x-axis indicates the P-value for enrichment of a given gene set using DEPICT adapted for EC data, where the input to DEPICT is the genes implicated by coding EC variants that are independent of known GWAS signals. The y-axis indicates the P-value for gene set enrichment using DEPICT, using as input the GWAS loci that do not overlap the coding signals. Each point represents a meta-gene set, and the best P-value for any gene set within the meta-gene set is shown. Only significant (false discovery rate < 0.01) gene set enrichment results are plotted. Colors correspond to whether the meta-gene set was significant for EC only (blue), GWAS only (green), both but more significant for EC (purple), or both but more significant for GWAS (orange), and the most significant gene sets within each category are labeled. A line is drawn at x = y for ease of comparison.
Extended Data Figure 7.
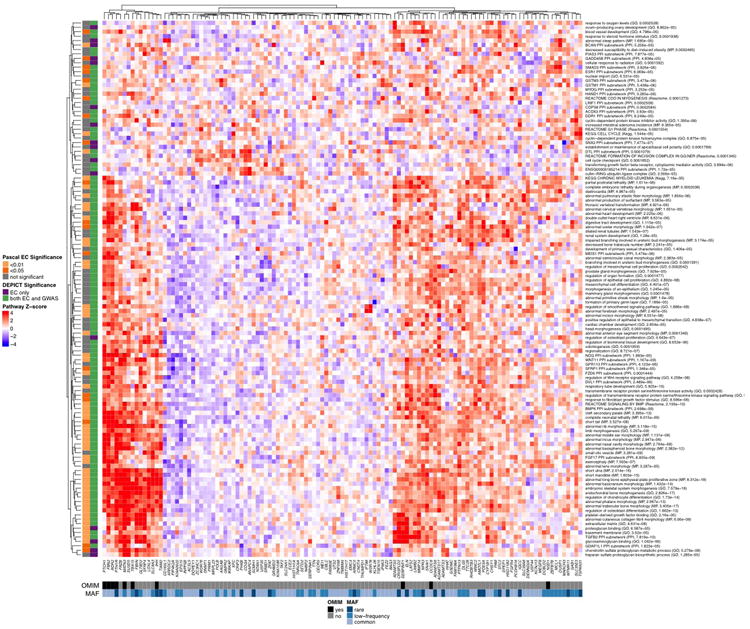
Heat map showing entire DEPICT gene set enrichment results (analogous to Fig. 2 in the main text). For any given square, the color indicates how strongly the corresponding gene (shown on the x-axis) is predicted to belong to the reconstituted gene set (y-axis). This value is based on the gene's Z-score for gene set inclusion in DEPICT's reconstituted gene sets, where red indicates a higher Z-score and blue indicates a lower one. The proteoglycan binding pathway was uniquely implicated by coding variants (as opposed to common variants) by both DEPICT and the Pascal method. To visually reduce redundancy and increase clarity, we chose one representative “meta-gene set” for each group of highly correlated gene sets based on affinity propagation clustering (see Methods and Supplementary Information). Heat map intensity and DEPICT p-values correspond to the most significantly enriched gene set within the meta-gene set; meta-gene sets are listed with their database source. Annotations for the genes indicate whether the gene has OMIM annotation as underlying a disorder of skeletal growth (black and grey) and the minor allele frequency of the significant EC variant (shades of blue; if multiple variants, the lowest-frequency variant was kept). Annotations for the gene sets indicate if the gene set was also found significant for EC by the Pascal method (yellow and grey) and if the gene set was found significant by DEPICT for EC only or for both EC and GWAS (purple and green). Abbreviations: GO: Gene Ontology; KEGG: Kyoto encyclopedia of genes and genomes; MP: mouse phenotype in the Mouse Genetics Initiative; PPI: protein-protein interaction in the InWeb database.
Extended Data Figure 8.
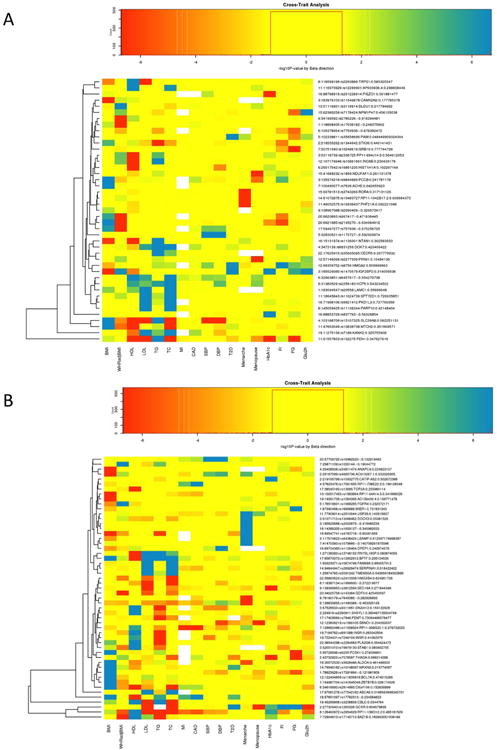
Heatmaps showing associations of the height variants to other complex traits; −log10(P-values) are oriented with beta effect direction for the alternate allele, white are missing values, yellow are non-significant (P>0.05), green to blue shading for hits with positive beta in the other trait and P-values between 0.05 and <2×10⁻⁷ and, orange to red shading for hits with negative beta in the other trait and P-values between 0.05 to <2×10⁻⁷. Short and tall labels are given for the minor alleles. Clustering is done by the complete linkage method with Euclidean distance measure for the loci. Clusters highlight SNPs that are more significantly associated with the same set of traits. (A) Variants for which the minor allele is the height-decreasing allele. (B) Variants for which the minor allele is the height-increasing allele.
Extended Data Table 1.
Rare variants associated with adult height.32 missense or splice site variants with minor allele frequency <1% in European-ancestry participants that have Pcombined<2×10⁻⁷. The direction of the effect (Beta, standard deviation units) and effect allele frequency (AF) is given for the alternate (Alt) allele. Genomic coordinates are on build 37 of the human genome. For each variant, we provide the most severe annotation using the ENSEMBL Variant Effect Predictor (VEP) tool. N, sample size; Ref, reference allele; SE, standard error.
| Discovery (N up to 381,625) | Validation (N up to 252,501) | Combined (N up to 634,126) | ||||||||||||||
|---|---|---|---|---|---|---|---|---|---|---|---|---|---|---|---|---|
| Variant | Chr:Pos | Ref/Alt | Gene | Annotation | AF | Beta | SE | P-value | AF | Beta | SE | P-value | AF | Beta | SE | P-value |
| rsl50341307 | 1:32673514 | G/C | IQCC | missense | 0.002 | -0.141 | 0.026 | 7.92E-08 | 0.004 | -0.116 | 0.025 | 3.83E-06 | 0.003 | -0.128 | 0.018 | 1.34E-12 |
| rsl43365597 | 1:41540902 | G/A | SCMH1 | missense | 0.004 | 0.188 | 0.018 | 1.58E-25 | 0.006 | 0.169 | 0.024 | 9.42E-13 | 0.005 | 0.181 | 0.014 | 1.35E-36 |
| rsl14233776 | 1:41618297 | G/A | SCMH1 | missense | 0.006 | -0.119 | 0.015 | 1.92E-15 | 0.006 | -0.11 | 0.019 | 1.32E-08 | 0.006 | -0.116 | 0.012 | 1.80E-22 |
| rs145659444 | 1:149902342 | C/T | MTMR11 | missense | 0.007 | 0.067 | 0.015 | 4.16E-06 | 0.006 | 0.083 | 0.019 | 7.11E-06 | 0.007 | 0.073 | 0.012 | 3.03E-10 |
| rs144712473 | 1:183495812 | A/G | SMG7 | missense | 0.006 | -0.094 | 0.014 | 4.97E-11 | 0.008 | -0.067 | 0.017 | 8.94E-05 | 0.007 | -0.083 | 0.011 | 1.61E-14 |
| rs144673025 | 1:223178026 | T/C | DISP1 | missense | 0.008 | -0.078 | 0.013 | 1.11E-09 | 0.007 | -0.086 | 0.018 | 1.22E-06 | 0.008 | -0.081 | 0.011 | 1.27E-14 |
| rs142036701 | 2:219924961 | G/T | IHH | missense | 0.001 | -0.32 | 0.04 | 1.09E-15 | 0.003 | -0.263 | 0.043 | 1.48E-09 | 0.002 | -0.294 | 0.029 | 1.85E-23 |
| rsl47445258 | 2:220078652 | C/T | ABCB6 | missense | 0.01 | -0.086 | 0.012 | 3.43E-13 | 0.009 | -0.064 | 0.018 | 4.40E-04 | 0.01 | -0.079 | 0.01 | 2.47E-15 |
| rsl21434601 | 3:46939587 | C/T | PTH1R | missense | 0.003 | 0.154 | 0.023 | 1.30E-11 | 0.003 | 0.192 | 0.031 | 5.48E-10 | 0.003 | 0.168 | 0.019 | 1.14E-19 |
| rsl41374503 | 4:73179445 | C/T | ADAMTS3 | missense | 0.003 | -0.119 | 0.021 | 1.82E-08 | 0.004 | -0.089 | 0.023 | 1.32E-04 | 0.004 | -0.106 | 0.016 | 1.30E-11 |
| rsl49385790 | 4:120422407 | T/G | PDE5A | missense | 0.001 | 0.257 | 0.031 | 7.50E-17 | 0.005 | 0.19 | 0.033 | 1.28E-08 | 0.003 | 0.226 | 0.023 | 2.65E-23 |
| rsl46301345 | 5:32784907 | G/A | NPR3 | missense | 0.003 | 0.128 | 0.022 | 1.05E-08 | 0.002 | 0.166 | 0.035 | 1.78E-06 | 0.003 | 0.139 | 0.019 | 7.91E-14 |
| rs61736454 | 5:64766798 | G/A | ADAMTS6 | missense | 0.002 | -0.152 | 0.026 | 7.82E-09 | 0.002 | -0.182 | 0.032 | 1.37E-08 | 0.002 | -0.164 | 0.02 | 4.80E-16 |
| rs78727187 | 5:127668685 | G/T | FBN2 | missense | 0.006 | 0.183 | 0.015 | 2.47E-33 | 0.006 | 0.181 | 0.02 | 5.06E-20 | 0.006 | 0.182 | 0.012 | 1.47E-52 |
| rsl48833559 | 5:172755066 | C/A | STC2 | missense | 0.001 | 0.29 | 0.037 | 5.69E-15 | 0.001 | 0.368 | 0.043 | 1.32E-17 | 0.001 | 0.323 | 0.028 | 1.15E-30 |
| rsl48543891 | 6:155450779 | A/G | TIAM2 | missense | 0.003 | -0.124 | 0.022 | 1.45E-08 | 0.001 | -0.016 | 0.082 | 8.50E-01 | 0.003 | -0.117 | 0.021 | 3.96E-08 |
| rs41511151 | 7:73482987 | G/A | ELN | missense | 0.004 | -0.086 | 0.018 | 2.63E-06 | 0.007 | -0.061 | 0.019 | 1.51E-03 | 0.006 | -0.074 | 0.013 | 2.31E-08 |
| rsl12892337 | 8:135614553 | G/C | ZFAT | missense | 0.004 | 0.196 | 0.019 | 4.42E-26 | 0.004 | 0.184 | 0.024 | 1.20E-14 | 0.004 | 0.191 | 0.015 | 6.12E-38 |
| rs75596750 | 8:135622851 | G/A | ZFAT | missense | 0.001 | 0.255 | 0.036 | 1.54E-12 | 0.002 | 0.339 | 0.039 | 5.94E-18 | 0.002 | 0.293 | 0.027 | 2.05E-28 |
| rsl38273386 | 11:27016360 | G/A | FIBIN | missense | 0.004 | -0.12 | 0.017 | 5.79E-12 | 0.005 | -0.076 | 0.024 | 1.56E-03 | 0.004 | -0.105 | 0.014 | 3.26E-14 |
| rsl38059525 | 11:94533444 | G/A | AMOTL1 | missense | 0.009 | -0.096 | 0.012 | 9.01E-16 | 0.007 | -0.089 | 0.017 | 3.84E-07 | 0.008 | -0.094 | 0.01 | 2.84E-21 |
| rsl47996581 | 12:58138971 | G/A | TSPAN31 | missense | 0.003 | -0.116 | 0.022 | 8.26E-08 | 0.001 | -0.268 | 0.09 | 2.85E-03 | 0.003 | -0.125 | 0.021 | 5.50E-09 |
| rsl3141 | 12:121756084 | G/A | ANAPC5 | missense | 0.009 | -0.082 | 0.012 | 1.09E-11 | 0.011 | -0.105 | 0.016 | 1.44E-11 | 0.01 | -0.091 | 0.01 | 1.45E-21 |
| rsl50494621 | 15:44153571 | C/T | WDR76 | missense | 0.008 | 0.063 | 0.013 | 1.56E-06 | 0.014 | 0.054 | 0.015 | 3.42E-04 | 0.011 | 0.059 | 0.01 | 2.32E-09 |
| rsl41308595 | 15:89424870 | G/T | HAPLN3 | missense | 0.001 | -0.267 | 0.037 | 2.84E-13 | 0.002 | -0.234 | 0.035 | 2.43E-11 | 0.002 | -0.25 | 0.025 | 1.02E-22 |
| rs141923065 | 16:31474091 | A/G | ARMC5 | splice acceptor | 0.006 | 0.104 | 0.015 | 5.88E-12 | 0.013 | 0.057 | 0.018 | 1.16E-03 | 0.009 | 0.084 | 0.011 | 1.62E-13 |
| rs34667348 | 16:47684830 | C/A | PHKB | missense | 0.005 | 0.121 | 0.016 | 3.96E-14 | 0.005 | 0.033 | 0.020 | 1.04E-01 | 0.005 | 0.088 | 0.013 | 3.43E-12 |
| rsl40385822 | 16:67470505 | G/A | HSD11B2 | missense | 0.002 | -0.148 | 0.028 | 1.27E-07 | 0.002 | -0.124 | 0.035 | 3.38E-04 | 0.002 | -0.139 | 0.022 | 1.97E-10 |
| rsl49615348 | 16:84900645 | G/A | CRISPLD2 | missense | 0.007 | -0.095 | 0.014 | 9.13E-12 | 0.008 | -0.098 | 0.017 | 4.34E-09 | 0.008 | -0.096 | 0.011 | 2.92E-19 |
| rsl48934412 | 16:84902472 | G/A | CRISPLD2 | missense | 0.001 | -0.297 | 0.04 | 7.75E-14 | 0.001 | -0.317 | 0.058 | 3.49E-08 | 0.001 | -0.304 | 0.033 | 2.36E-20 |
| rs201226914 | 16:88798919 | G/T | PIEZOl | missense | 0.002 | -0.187 | 0.027 | 5.27E-12 | 0.002 | -0.241 | 0.043 | 1.99E-08 | 0.002 | -0.202 | 0.023 | 8.68E-19 |
| rsl37852591 | 23:66941751 | C/G | AR | missense | 0.002 | -0.304 | 0.061 | 7.05E-07 | 0.008 | -0.333 | 0.058 | 7.12E-09 | 0.005 | -0.319 | 0.042 | 2.67E-14 |
Extended Data Table 2.
Low-frequency variants associated with adult height.59 variants (51 missense or nonsense) with minor allele frequency between 1 and 5% in European-ancestry participants that have Pcombined<2×10⁻⁷. For TTN-rs16866412 and NOL8-rs921122, the association is significant (P<2×10⁻⁷) upon conditional analysis. The direction of the effect (Beta, standard deviation units) and effect allele frequency (AF) is given for the alternate (Alt) allele. For each variant, we provide the most severe annotation using the ENSEMBL Variant Effect Predictor (VEP) tool. N, sample size; Ref, reference allele; SE, standard error
| Discovery (N up to 381,625) | Validation (N up to 252,501) | Combined N up to 634,126) | ||||||||||||||
|---|---|---|---|---|---|---|---|---|---|---|---|---|---|---|---|---|
| Variant | Chr:Pos | Ref/Alt | Gene | Annotation | AF | Beta | SE | P-value | AF | Beta | SE | P-value | AF | Beta | SE | P-value |
| rs41292521 | 1:51873967 | G/A | EPS15 | missense | 0.020 | 0.045 | 0.008 | 5.07E-08 | 0.023 | 0.065 | 0.010 | 7.60E-11 | 0.021 | 0.053 | 0.006 | 2.56E-17 |
| rs61730011 | 1:119427467 | A/C | TBX15 | missense | 0.042 | -0.059 | 0.006 | 1.61E-24 | 0.046 | -0.056 | 0.007 | 4.19E-15 | 0.044 | -0.058 | 0.005 | 2.79E-36 |
| rsl1580946 | 1:150551327 | G/A | MCLl | missense | 0.014 | 0.061 | 0.010 | 2.16E-09 | 0.015 | 0.085 | 0.012 | 7.86E-12 | 0.015 | 0.070 | 0.008 | 1.55E-19 |
| rs141845046 | 1:154987704 | c/t | ZBTB7B | missense | 0.028 | 0.058 | 0.007 | 7.30E-17 | 0.025 | 0.061 | 0.010 | 4.46E-10 | 0.027 | 0.059 | 0.006 | 3.46E-25 |
| rs79485039 | 1:180886140 | C/T | KIAA1614 | missense | 0.026 | 0.034 | 0.007 | 1.41E-06 | 0.031 | 0.030 | 0.009 | 4.51E-04 | 0.028 | 0.033 | 0.006 | 2.63E-09 |
| rs52826764 | 2:20205541 | C/T | MATN3 | missense | 0.026 | -0.071 | 0.007 | 2.67E-23 | 0.028 | -0.084 | 0.010 | 6.60E-19 | 0.027 | -0.076 | 0.006 | 3.74E-41 |
| rs16859517 | 2:219949184 | C/T | NHEJ1 | intron | 0.036 | 0.059 | 0.006 | 5.96E-21 | 0.036 | 0.064 | 0.008 | 1.12E-15 | 0.036 | 0.061 | 0.005 | 8.20E-37 |
| rsl6866412 | 2:179474668 | G/A | TTN | missense | 0.013 | -0.053 | 0.010 | 1.35E-07 | 0.010 | -0.019 | 0.015 | 2.15E-01 | 0.012 | -0.042 | 0.008 | 3.44E-07 |
| rs7571816 | 2:233077064 | A/G | DIS3L2 | intron | 0.025 | -0.060 | 0.007 | 2.35E-16 | 0.023 | -0.079 | 0.010 | 2.58E-15 | 0.024 | -0.066 | 0.006 | 6.46E-31 |
| rs2229089 | 3:14214524 | G/A | XPC | missense | 0.031 | -0.038 | 0.007 | 1.22E-08 | 0.035 | -0.020 | 0.008 | 1.68E-02 | 0.033 | -0.030 | 0.005 | 1.29E-08 |
| rs76208147 | 3:47162886 | C/T | SETD2 | missense | 0.019 | 0.048 | 0.009 | 2.24E-08 | 0.016 | 0.062 | 0.012 | 2.22E-07 | 0.018 | 0.053 | 0.007 | 1.65E-13 |
| rs35713889 | 3:49162583 | C/T | LAMB2 | missense | 0.039 | 0.043 | 0.006 | 3.28E-12 | 0.045 | 0.060 | 0.007 | 1.33E-16 | 0.041 | 0.050 | 0.005 | 3.49E-27 |
| rs9838238 | 3:98600385 | T/C | DCBLD2 | missense | 0.047 | 0.029 | 0.005 | 1.23E-07 | 0.051 | 0.027 | 0.007 | 5.62E-05 | 0.048 | 0.028 | 0.004 | 1.68E-12 |
| rs11722554 | 4:5016883 | G/A | CYTL1 | missense | 0.040 | -0.049 | 0.006 | 2.01E-17 | 0.034 | -0.057 | 0.009 | 6.68E-11 | 0.038 | -0.052 | 0.005 | 1.86E-25 |
| rs61730641 | 4:87730980 | C/T | PTPN13 | missense | 0.015 | -0.086 | 0.010 | 1.94E-19 | 0.016 | -0.094 | 0.012 | 1.38E-15 | 0.016 | -0.089 | 0.008 | 9.43E-32 |
| rs116807401 | 4:135121721 | T/C | PABPC4L | missense | 0.017 | 0.065 | 0.009 | 1.39E-13 | 0.016 | 0.045 | 0.012 | 1.33E-04 | 0.017 | 0.058 | 0.007 | 7.54E-16 |
| rs28925904 | 4:144359490 | C/T | GAB1 | missense | 0.019 | -0.048 | 0.008 | 1.04E-08 | 0.023 | -0.036 | 0.010 | 3.24E-04 | 0.021 | -0.043 | 0.006 | 4.29E-12 |
| rs34343821 | 4:154557616 | C/T | KIAA0922 | missense | 0.011 | 0.059 | 0.011 | 7.75E-08 | 0.015 | 0.056 | 0.012 | 5.75E-06 | 0.013 | 0.058 | 0.008 | 2.18E-12 |
| rs35658696 | 5:102338811 | A/G | PAM | missense | 0.048 | -0.025 | 0.005 | 3.76E-06 | 0.053 | -0.031 | 0.007 | 8.47E-06 | 0.050 | -0.027 | 0.004 | 1.63E-10 |
| rs34821177 | 5:126250812 | C/T | MARCH3 | missense | 0.036 | 0.034 | 0.006 | 4.25E-08 | 0.029 | 0.027 | 0.009 | 2.45E-03 | 0.034 | 0.032 | 0.005 | 1.67E-10 |
| rs62623707 | 5:135288632 | A/G | LECT2 | missense | 0.044 | -0.030 | 0.006 | 1.02E-07 | 0.049 | -0.024 | 0.007 | 4.77E-04 | 0.046 | -0.027 | 0.005 | 1.36E-09 |
| rs34471628 | 5:172196752 | A/G | DUSP1 | missense | 0.036 | 0.048 | 0.006 | 4.00E-14 | 0.042 | 0.036 | 0.007 | 1.26E-06 | 0.039 | 0.043 | 0.005 | 1.93E-20 |
| rs28932177 | 5:176637471 | G/A | NSD1 | missense | 0.028 | 0.063 | 0.007 | 2.38E-17 | 0.027 | 0.065 | 0.009 | 2.62E-12 | 0.028 | 0.064 | 0.006 | 4.27E-30 |
| rs78247455 | 5:176722005 | G/A | NSD] | missense | 0.023 | -0.083 | 0.008 | 1.86E-26 | 0.025 | -0.085 | 0.010 | 8.42E-18 | 0.024 | -0.084 | 0.006 | 2.32E-41 |
| rs7757648 | 6:30851933 | G/A | DDRI | intron | 0.013 | -0.075 | 0.013 | 1.11E-08 | 0.011 | -0.079 | 0.018 | 1.24E-05 | 0.012 | -0.076 | 0.011 | 4.64E-13 |
| rs34427075 | 6:34730395 | C/T | SNRPC | synonymous | 0.014 | -0.117 | 0.010 | 9.21E-33 | 0.016 | -0.139 | 0.012 | 9.59E-31 | 0.015 | -0.126 | 0.008 | 3.45E-60 |
| rs33966734 | 6:41903798 | C/A | CCND3 | stop sained | 0.013 | -0.140 | 0.017 | 5.51E-17 | 0.011 | -0.101 | 0.018 | 3.41E-08 | 0.012 | -0.122 | 0.012 | 1.28E-22 |
| rs17277546 | 7:99489571 | G/A | TRIM4 | 3′UTR | 0.049 | 0.034 | 0.005 | 3.28E-10 | 0.052 | 0.038 | 0.007 | 2.26E-07 | 0.050 | 0.035 | 0.004 | 1.40E-17 |
| rs7636 | 7:100490077 | G/A | ACHE | synonymous | 0.043 | -0.037 | 0.006 | 8.59E-10 | 0.035 | -0.019 | 0.009 | 2.92E-02 | 0.040 | -0.031 | 0.005 | 2.98E-10 |
| rsl7480616 | 7:135123060 | G/C | CNOT4 | missense | 0.028 | 0.060 | 0.007 | 2.31E-17 | 0.030 | 0.054 | 0.009 | 5.04E-10 | 0.029 | 0.058 | 0.005 | 3.90E-26 |
| rs3136797 | 8:42226805 | C/G | POLB | missense | 0.018 | 0.044 | 0.009 | 1.95E-06 | 0.021 | 0.026 | 0.010 | 1.30E-02 | 0.019 | 0.036 | 0.007 | 1.88E-07 |
| rs11575580 | 9:34660864 | C/T | ILURA | missense | 0.016 | -0.064 | 0.009 | 5.20E-13 | 0.020 | -0.030 | 0.011 | 4.42E-03 | 0.018 | -0.050 | 0.007 | 4.01E-13 |
| rs921122 | 9:95063947 | C/T | NOL8 | missense | 0.039 | 0.041 | 0.009 | 2.56E-06 | 0.040 | 0.018 | 0.008 | 3.45E-02 | 0.040 | 0.029 | 0.006 | 3.33E-06 |
| rs41274586 | 10:79580976 | G/A | DLG5 | missense | 0.017 | -0.058 | 0.009 | 2.72E-11 | 0.017 | -0.076 | 0.012 | 5.15E-11 | 0.017 | -0.065 | 0.007 | 7.66E-20 |
| rs41291604 | 10:97919011 | A/G | ZNF518A | missense | 0.040 | 0.031 | 0.006 | 9.94E-08 | 0.040 | 0.022 | 0.008 | 3.05E-03 | 0.040 | 0.028 | 0.005 | 3.91E-09 |
| rs71455793 | 11:65715204 | G/A | TSGAJOIP | missense | 0.039 | -0.058 | 0.006 | 1.82E-21 | 0.046 | -0.072 | 0.007 | 1.41E-23 | 0.042 | -0.064 | 0.005 | 1.52E-43 |
| rs4072796 | 12:7548996 | C/G | CD163L1 | missense | 0.035 | 0.034 | 0.006 | 4.11E-08 | 0.037 | 0.015 | 0.008 | 6.68E-02 | 0.036 | 0.027 | 0.005 | 1.87E-08 |
| rs61743810 | 12:69140339 | G/C | SLC35E3 | missense | 0.022 | -0.047 | 0.008 | 1.13E-09 | 0.023 | -0.036 | 0.010 | 5.UE-04 | 0.022 | -0.043 | 0.006 | 1.29E-11 |
| rs117801489 | 12:104408832 | T/C | GLT8D2 | missense | 0.017 | 0.053 | 0.009 | 8.72E-10 | 0.028 | 0.062 | 0.010 | 5.82E-10 | 0.022 | 0.057 | 0.007 | 1.60E-17 |
| rs2066674 | 13:50842259 | G/A | DLEU1 | intron | 0.044 | 0.073 | 0.006 | 2.33E-37 | 0.041 | 0.084 | 0.008 | 7.02E-25 | 0.043 | 0.077 | 0.005 | 5.66E-57 |
| rsl7880989 | 14:23313633 | G/A | MMP14 | missense | 0.027 | 0.041 | 0.007 | 1.72E-08 | 0.029 | 0.052 | 0.009 | 7.81E-09 | 0.028 | 0.045 | 0.006 | 3.27E-16 |
| rs34354104 | 14:24707479 | G/A | GMPR2 | missense | 0.048 | 0.045 | 0.005 | 3.67E-16 | 0.050 | 0.047 | 0.007 | 1.34E-11 | 0.049 | 0.046 | 0.004 | 2.13E-29 |
| rs117295933 | 14:45403699 | C/A | KLHL28 | missense | 0.016 | -0.045 | 0.009 | 1.55E-06 | 0.025 | -0.036 | 0.010 | 4.13E-04 | 0.020 | -0.041 | 0.007 | 3.05E-09 |
| rs41286548 | 14:70633411 | C/T | SLC8A3 | missense | 0.021 | -0.054 | 0.008 | 2.49E-11 | 0.026 | -0.045 | 0.009 | 2.02E-06 | 0.023 | -0.050 | 0.006 | 2.03E-16 |
| rs28929474 | 14:94844947 | C/T | SERPINA1 | missense | 0.018 | 0.124 | 0.009 | 1.39E-45 | 0.019 | 0.139 | 0.011 | 2.50E-34 | 0.019 | 0.130 | 0.007 | 1.72E-75 |
| rs41286560 | 14:101349454 | G/T | RTL1 | missense | 0.024 | -0.050 | 0.007 | 1.17E-11 | 0.028 | -0.033 | 0.009 | 2.12E-04 | 0.026 | -0.044 | 0.006 | 2.50E-15 |
| rs116858574 | 15:34520687 | T/C | EMC4 | missense | 0.014 | 0.047 | 0.010 | 1.16E-06 | 0.014 | 0.028 | 0.012 | 2.19E-02 | 0.014 | 0.040 | 0.008 | 1.60E-07 |
| rs34815962 | 15:72462255 | C/T | GRAMD2 | missense | 0.019 | 0.073 | 0.009 | 8.72E-17 | 0.023 | 0.074 | 0.010 | 3.66E-13 | 0.021 | 0.073 | 0.007 | 1.28E-27 |
| rs16942341 | 15:89388905 | C/T | AC AN | synonymous | 0.026 | -0.129 | 0.007 | 4.30E-72 | 0.028 | -0.146 | 0.009 | 1.08E-56 | 0.027 | -0.135 | 0.006 | 3.79E-130 |
| rs61733564 | 16:4812705 | A/G | ZNF500 | missense | 0.032 | 0.056 | 0.007 | 8.61E-17 | 0.032 | 0.044 | 0.009 | 2.34E-07 | 0.032 | 0.051 | 0.005 | 2.89E-21 |
| rsl13388806 | 16:24804954 | A/T | TNRC6A | missense | 0.040 | 0.036 | 0.006 | 1.08E-09 | 0.047 | 0.041 | 0.008 | 1.65E-07 | 0.043 | 0.038 | 0.005 | 1.90E-15 |
| rs8052655 | 16:67409180 | G/A | LRRC36 | missense | 0.043 | -0.054 | 0.006 | 1.08E-18 | 0.043 | -0.055 | 0.008 | 3.91E-13 | 0.043 | -0.054 | 0.005 | 6.40E-31 |
| rs77542162 | 17:67081278 | A/G | ABCA6 | missense | 0.017 | 0.049 | 0.010 | 2.17E-06 | 0.023 | 0.051 | 0.010 | 5.58E-07 | 0.020 | 0.050 | 0.007 | 5.57E-12 |
| rs77169818 | 18:74980601 | A/T | GALRl | missense | 0.047 | -0.048 | 0.006 | 3.60E-18 | 0.038 | -0.035 | 0.008 | 3.64E-05 | 0.044 | -0.044 | 0.005 | 5.11E-19 |
| rs3208856 | 19:45296806 | C/T | CBLC | missense | 0.034 | 0.036 | 0.007 | 1.48E-07 | 0.034 | 0.021 | 0.008 | 1.19E-02 | 0.034 | 0.030 | 0.005 | 2.96E-08 |
| rs4252548 | 19:55879672 | C/T | IL11 | missense | 0.026 | -0.114 | 0.007 | 1.02E-57 | 0.022 | -0.101 | 0.010 | 2.28E-23 | 0.025 | -0.110 | 0.006 | 5.32E-81 |
| rs147110934 | 19:55993436 | G/T | ZNF628 | missense | 0.021 | -0.084 | 0.010 | 2.28E-18 | 0.022 | -0.098 | 0.011 | 1.17E-18 | 0.022 | -0.090 | 0.007 | 6.33E-34 |
| rs77885044 | 22:28501414 | C/T | TTC28 | missense | 0.012 | -0.067 | 0.010 | 9.47E-11 | 0.017 | -0.069 | 0.012 | 3.24E-09 | 0.014 | -0.068 | 0.008 | 3.93E-19 |
| rs147348682 | 22:42095658 | T/G | MEII | missense | 0.025 | 0.041 | 0.007 | 2.25E-08 | 0.034 | 0.024 | 0.009 | 6.59E-03 | 0.029 | 0.034 | 0.006 | 3.70E-10 |
Supplementary Material
Acknowledgments
A full list of acknowledgments appears in the Supplementary Information. Part of this work was conducted using the UK Biobank resource.
Footnotes
Supplementary Information: Supplementary Information is linked to the online version of the paper at www.nature.com/nature.
Author Contributions: Writing Group (wrote and edited manuscript): Panos Deloukas, Timothy M. Frayling, Mariaelisa Graff, Joel N. Hirschhorn, Guillaume Lettre, Ken Sin Lo, Yingchang Lu, Eirini Marouli, M. Carolina Medina-Gomez, Fernando Rivadeneira. All authors contributed and discussed the results, and commented on the manuscript.
Data preparation group (checked and prepared data from contributing cohorts for meta-analyses and replication): Tonu Esko, Mariaelisa Graff, Heather Highland, Anne Justice, Tugce Karaderi, Ken Sin Lo, Adam E. Locke, Yingchang Lu, Eirini Marouli, Nicholas G.D. Masca, M. Carolina Medina-Gomez, Poorva Mudgal, Maggie C.Y. Ng, Manuel A. Rivas, Claudia Schurmann, Kathy Stirrups, Valérie Turcot, Sailaja Vedantam, Thomas W. Winkler, Kristin L. Young. This work was done under the auspices of the GIANT, CHARGE, BBMRI, UK ExomeChip, and GOT2D consortia.
Height meta-analyses (discovery and replication, single-variant and gene-based): Panos Deloukas, Timothy M. Frayling, Mariaelisa Graff, Joel N. Hirschhorn, Guillaume Lettre, Daijiang J. Liu, Ken Sin Lo, Yingchang Lu, Eirini Marouli, M. Carolina Medina-Gomez, Fernando Rivadeneira, Andrew R. Wood.
UK Biobank-based integration of height association signals group and heritability analyses: Panos Deloukas, Timothy M. Frayling, Guillaume Lettre, Zoltán Kutalik, Ken Sin Lo, Eirini Marouli, Sina Rüeger, Andrew R. Wood.
Pleiotropy working group: Gonçalo Abecasis, Michael Boehnke, James P. Cook, Panos Deloukas, Fotios Drenos, Jose C. Florez, Heather Highland, Sekar Kathiresan, Cecilia M. Lindgren, Dajiang J. Liu, Ruth J.F. Loos, Anubha Mahajan, Eirini Marouli, Mark I. McCarthy, Patricia B. Munroe, Gina M. Peloso, John R. B. Perry, Katherine S. Ruth, Cristen J. Willer.
Biological and clinical enrichment, and pathway analyses: Rebecca S. Fine, Joel N. Hirschhorn, Zoltán Kutalik, David Lamparter, Guillaume Lettre, Ken Sin Lo, Tune H. Pers.
Functional characterization of STC2: Troels R. Kjaer, Claus Oxvig.
Author Information: Summary genetic association results are available on the GIANT website: http://portals.broadinstitute.org/collaboration/giant/index.php/GIANT_consortium.
The authors declare no competing financial interests.
References
- 1.Fisher RA. The Correlation Between Relatives on the Supposition of Mendelian Inheritance. Transactions of the Royal Society of Edinburgh. 1918;52:399–433. [Google Scholar]
- 2.Silventoinen K, et al. Heritability of adult body height: a comparative study of twin cohorts in eight countries. Twin Res. 2003;6:399–408. doi: 10.1375/136905203770326402. [DOI] [PubMed] [Google Scholar]
- 3.Wood AR, et al. Defining the role of common variation in the genomic and biological architecture of adult human height. Nat Genet. 2014;46:1173–1186. doi: 10.1038/ng.3097. [DOI] [PMC free article] [PubMed] [Google Scholar]
- 4.Flannick J, et al. Loss-of-function mutations in SLC30A8 protect against type 2 diabetes. Nat Genet. 2014;46:357–363. doi: 10.1038/ng.2915. [DOI] [PMC free article] [PubMed] [Google Scholar]
- 5.Steinthorsdottir V, et al. Identification of low-frequency and rare sequence variants associated with elevated or reduced risk of type 2 diabetes. Nat Genet. 2014;46:294–298. doi: 10.1038/ng.2882. [DOI] [PubMed] [Google Scholar]
- 6.Gudmundsson J, et al. A study based on whole-genome sequencing yields a rare variant at 8q24 associated with prostate cancer. Nat Genet. 2012;44:1326–1329. doi: 10.1038/ng.2437. [DOI] [PMC free article] [PubMed] [Google Scholar]
- 7.Sidore C, et al. Genome sequencing elucidates Sardinian genetic architecture and augments association analyses for lipid and blood inflammatory markers. Nat Genet. 2015;47:1272–1281. doi: 10.1038/ng.3368. [DOI] [PMC free article] [PubMed] [Google Scholar]
- 8.Danjou F, et al. Genome-wide association analyses based on whole-genome sequencing in Sardinia provide insights into regulation of hemoglobin levels. Nat Genet. 2015;47:1264–1271. doi: 10.1038/ng.3307. [DOI] [PMC free article] [PubMed] [Google Scholar]
- 9.Zuk O, et al. Searching for missing heritability: designing rare variant association studies. Proc Natl Acad Sci U S A. 2014;111:E455–464. doi: 10.1073/pnas.1322563111. [DOI] [PMC free article] [PubMed] [Google Scholar]
- 10.Yang J, et al. Genetic variance estimation with imputed variants finds negligible missing heritability for human height and body mass index. Nat Genet. 2015;47:1114–1120. doi: 10.1038/ng.3390. [DOI] [PMC free article] [PubMed] [Google Scholar]
- 11.Grove ML, et al. Best practices and joint calling of the HumanExome BeadChip: the CHARGE Consortium. PloS one. 2013;8:e68095. doi: 10.1371/journal.pone.0068095. [DOI] [PMC free article] [PubMed] [Google Scholar]
- 12.Kryukov GV, Pennacchio LA, Sunyaev SR. Most rare missense alleles are deleterious in humans: implications for complex disease and association studies. Am J Hum Genet. 2007;80:727–739. doi: 10.1086/513473. [DOI] [PMC free article] [PubMed] [Google Scholar]
- 13.Tennessen JA, et al. Evolution and functional impact of rare coding variation from deep sequencing of human exomes. Science. 2012;337:64–69. doi: 10.1126/science.1219240. [DOI] [PMC free article] [PubMed] [Google Scholar]
- 14.Lanktree MB, et al. Meta-analysis of Dense Genecentric Association Studies Reveals Common and Uncommon Variants Associated with Height. Am J Hum Genet. 2011;88:6–18. doi: 10.1016/j.ajhg.2010.11.007. [DOI] [PMC free article] [PubMed] [Google Scholar]
- 15.Pers TH, et al. Biological interpretation of genome-wide association studies using predicted gene functions. Nat Commun. 2015;6:5890. doi: 10.1038/ncomms6890. [DOI] [PMC free article] [PubMed] [Google Scholar]
- 16.Lamparter D, Marbach D, Rueedi R, Kutalik Z, Bergmann S. Fast and Rigorous Computation of Gene and Pathway Scores from SNP-Based Summary Statistics. PLoS Comput Biol. 2016;12:e1004714. doi: 10.1371/journal.pcbi.1004714. [DOI] [PMC free article] [PubMed] [Google Scholar]
- 17.Schwartz NB, Domowicz M. Chondrodysplasias due to proteoglycan defects. Glycobiology. 2002;12:57R–68R. doi: 10.1093/glycob/12.4.57r. [DOI] [PubMed] [Google Scholar]
- 18.Wei HS, Wei HL, Zhao F, Zhong LP, Zhan YT. Glycosyltransferase GLT8D2 positively regulates ApoB100 protein expression in hepatocytes. Int J Mol Sci. 2013;14:21435–21446. doi: 10.3390/ijms141121435. [DOI] [PMC free article] [PubMed] [Google Scholar]
- 19.Ito H, et al. Molecular cloning and biological activity of a novel lysyl oxidase-related gene expressed in cartilage. J Biol Chem. 2001;276:24023–24029. doi: 10.1074/jbc.M100861200. [DOI] [PubMed] [Google Scholar]
- 20.Wakahara T, et al. Fibin, a novel secreted lateral plate mesoderm signal, is essential for pectoral fin bud initiation in zebrafish. Dev Biol. 2007;303:527–535. doi: 10.1016/j.ydbio.2006.11.041. [DOI] [PubMed] [Google Scholar]
- 21.Kawano Y, Kypta R. Secreted antagonists of the Wnt signalling pathway. J Cell Sci. 2003;116:2627–2634. doi: 10.1242/jcs.00623. [DOI] [PubMed] [Google Scholar]
- 22.Mastaitis J, et al. Loss of SFRP4 Alters Body Size, Food Intake, and Energy Expenditure in Diet-Induced Obese Male Mice. Endocrinology. 2015;156:4502–4510. doi: 10.1210/en.2015-1257. [DOI] [PubMed] [Google Scholar]
- 23.Jepsen MR, et al. Stanniocalcin-2 inhibits mammalian growth by proteolytic inhibition of the insulin-like growth factor axis. J Biol Chem. 2015;290:3430–3439. doi: 10.1074/jbc.M114.611665. [DOI] [PMC free article] [PubMed] [Google Scholar]
- 24.Dauber A, et al. Mutations in pregnancy-associated plasma protein A2 cause short stature due to low IGF-I availability. EMBO Mol Med. 2016 doi: 10.15252/emmm.201506106. [DOI] [PMC free article] [PubMed] [Google Scholar]
- 25.Lango Allen H, et al. Hundreds of variants clustered in genomic loci and biological pathways affect human height. Nature. 2010;467:832–838. doi: 10.1038/nature09410. [DOI] [PMC free article] [PubMed] [Google Scholar]
- 26.Karaplis AC, et al. Inactivating mutation in the human parathyroid hormone receptor type 1 gene in Blomstrand chondrodysplasia. Endocrinology. 1998;139:5255–5258. doi: 10.1210/endo.139.12.6522. [DOI] [PubMed] [Google Scholar]
- 27.Sims NA, et al. Interleukin-11 receptor signaling is required for normal bone remodeling. J Bone Miner Res. 2005;20:1093–1102. doi: 10.1359/JBMR.050209. [DOI] [PubMed] [Google Scholar]
- 28.Takeuchi Y, et al. Interleukin-11 as a stimulatory factor for bone formation prevents bone loss with advancing age in mice. J Biol Chem. 2002;277:49011–49018. doi: 10.1074/jbc.M207804200. [DOI] [PubMed] [Google Scholar]
- 29.Fuchsberger C, et al. The genetic architecture of type 2 diabetes. Nature. 2016;536:41–47. doi: 10.1038/nature18642. [DOI] [PMC free article] [PubMed] [Google Scholar]
- 30.Bulik-Sullivan BK, et al. LD Score regression distinguishes confounding from polygenicity in genome-wide association studies. Nat Genet. 2015;47:291–295. doi: 10.1038/ng.3211. [DOI] [PMC free article] [PubMed] [Google Scholar]
- 31.Goldstein JI, et al. zCall: a rare variant caller for array-based genotyping: genetics and population analysis. Bioinformatics. 2012;28:2543–2545. doi: 10.1093/bioinformatics/bts479. [DOI] [PMC free article] [PubMed] [Google Scholar]
- 32.Liu DJ, et al. Meta-analysis of gene-level tests for rare variant association. Nat Genet. 2014;46:200–204. doi: 10.1038/ng.2852. [DOI] [PMC free article] [PubMed] [Google Scholar]
- 33.Winkler TW, Day FR. Quality control and conduct of genome-wide association meta-analyses. 2014;9:1192–1212. doi: 10.1038/nprot.2014.071. [DOI] [PMC free article] [PubMed] [Google Scholar]
- 34.Yang J, et al. Genomic inflation factors under polygenic inheritance. European Journal of Human Genetics. 2011;19:807–812. doi: 10.1038/ejhg.2011.39. [DOI] [PMC free article] [PubMed] [Google Scholar]
- 35.Feng S, Liu D, Zhan X, Wing MK, Abecasis GR. RAREMETAL: fast and powerful meta-analysis for rare variants. Bioinformatics (Oxford, England) 2014;30:2828–2829. doi: 10.1093/bioinformatics/btu367. [DOI] [PMC free article] [PubMed] [Google Scholar]
- 36.Yang J, et al. Conditional and joint multiple-SNP analysis of GWAS summary statistics identifies additional variants influencing complex traits. Nature genetics. 2012;44:369–S363. doi: 10.1038/ng.2213. [DOI] [PMC free article] [PubMed] [Google Scholar]
- 37.Loh PR, et al. Efficient Bayesian mixed-model analysis increases association power in large cohorts. Nat Genet. 2015;47:284–290. doi: 10.1038/ng.3190. [DOI] [PMC free article] [PubMed] [Google Scholar]
- 38.Pasaniuc B, et al. Fast and accurate imputation of summary statistics enhances evidence of functional enrichment. Bioinformatics. 2014;30:2906–2914. doi: 10.1093/bioinformatics/btu416. [DOI] [PMC free article] [PubMed] [Google Scholar]
- 39.Moayyeri A, Hammond CJ, Valdes AM, Spector TD. Cohort Profile: TwinsUK and healthy ageing twin study. Int J Epidemiol. 2013;42:76–85. doi: 10.1093/ije/dyr207. [DOI] [PMC free article] [PubMed] [Google Scholar]
- 40.Boyd A, et al. Cohort Profile: the ‘children of the 90s’--the index offspring of the Avon Longitudinal Study of Parents and Children. Int J Epidemiol. 2013;42:111–127. doi: 10.1093/ije/dys064. [DOI] [PMC free article] [PubMed] [Google Scholar]
- 41.Willer CJ, Li Y, Abecasis GR. METAL: Fast and efficient meta-analysis of genomewide association scans. Bioinformatics. 2010;26:2190–2191. doi: 10.1093/bioinformatics/btq340. [DOI] [PMC free article] [PubMed] [Google Scholar]
- 42.Purcell SM, et al. A polygenic burden of rare disruptive mutations in schizophrenia. Nature. 2014;506:185–190. doi: 10.1038/nature12975. [DOI] [PMC free article] [PubMed] [Google Scholar]
- 43.Wu MC, et al. Rare-variant association testing for sequencing data with the sequence kernel association test. American journal of human genetics. 2011;89:82–93. doi: 10.1016/j.ajhg.2011.05.029. [DOI] [PMC free article] [PubMed] [Google Scholar]
- 44.Price AL, et al. Pooled association tests for rare variants in exon-resequencing studies. Am J Hum Genet. 2010;86:832–838. doi: 10.1016/j.ajhg.2010.04.005. [DOI] [PMC free article] [PubMed] [Google Scholar]
- 45.Nikpay M, et al. A comprehensive 1,000 Genomes-based genome-wide association meta-analysis of coronary artery disease. Nat Genet. 2015;47:1121–1130. doi: 10.1038/ng.3396. [DOI] [PMC free article] [PubMed] [Google Scholar]
- 46.Fehrmann RS, et al. Gene expression analysis identifies global gene dosage sensitivity in cancer. Nat Genet. 2015;47:115–125. doi: 10.1038/ng.3173. [DOI] [PubMed] [Google Scholar]
- 47.Frey BJ, Dueck D. Clustering by passing messages between data points. Science. 2007;315:972–976. doi: 10.1126/science.1136800. [DOI] [PubMed] [Google Scholar]
- 48.Overgaard MT, et al. Expression of recombinant human pregnancy-associated plasma protein-A and identification of the proform of eosinophil major basic protein as its physiological inhibitor. The Journal of biological chemistry. 2000;275:31128–31133. doi: 10.1074/jbc.M001384200. [DOI] [PubMed] [Google Scholar]
- 49.Gyrup C, Oxvig C. Quantitative analysis of insulin-like growth factor-modulated proteolysis of insulin-like growth factor binding protein-4 and -5 by pregnancy-associated plasma protein-A. Biochemistry. 2007;46:1972–1980. doi: 10.1021/bi062229i. [DOI] [PubMed] [Google Scholar]
- 50.Oxvig C, Sand O, Kristensen T, Kristensen L, Sottrup-Jensen L. Isolation and characterization of circulating complex between human pregnancy-associated plasma protein-A and proform of eosinophil major basic protein. Biochimica et biophysica acta. 1994;1201:415–423. doi: 10.1016/0304-4165(94)90071-x. [DOI] [PubMed] [Google Scholar]
Associated Data
This section collects any data citations, data availability statements, or supplementary materials included in this article.
Supplementary Materials
Data Availability Statement
Summary genetic association results are available on the GIANT website: http://portals.broadinstitute.org/collaboration/giant/index.php/GIANT_consortium.