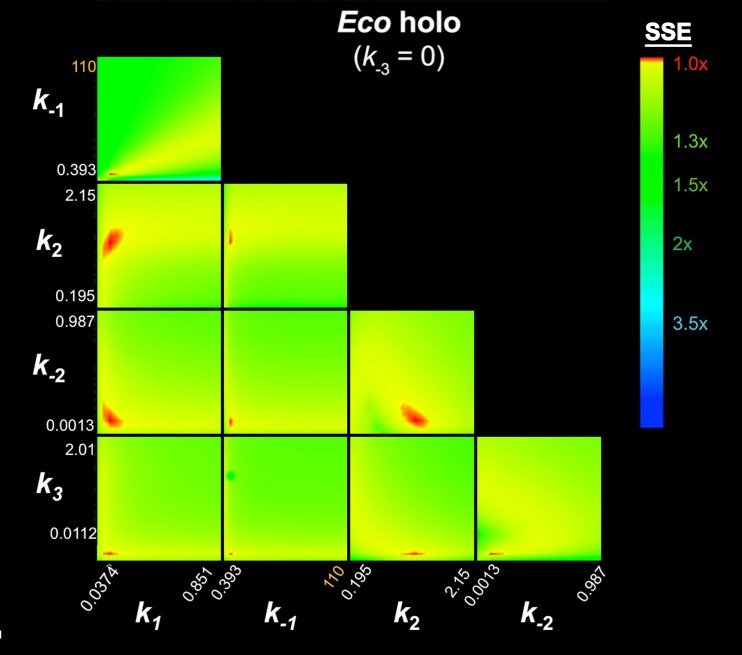
Appendix 1—figure 3. FitSpace calculation for Eco holo (k-3 = 0).
The results of the contour confidence analysis for Eco holo (parameters listed in Table 1) with k-3 fixed at 0. Each panel represents a grid where two kinetic parameters were varied systematically. For example, the upper left panel shows the result of systematically varying k1 from 3.74 × 10⁷ to 8.51 × 10⁸ M−1s−1 (x-axis) and k-1 from 0.393 to 110 s−1 (y-axis). At each point, the values of k1 and k-1 were fixed, then the other parameters (k2, k-2, k3) were refined against the data (the fluorescence progress curves; Figure 3A). The resulting sum squared error (SSE) is normalized by the minimum SSE (SSEmin) and plotted as a heat map. The minimum SSE (normalized by itself, so with a value of 1) is red in the heat map, higher SSE values are color-coded as shown. Each panel shows that the optimal pair of parameter values are restricted to a small red area, indicating the parmeters are constrained by the data.

