
Figure 2. Prognostic impact of gene mutations.
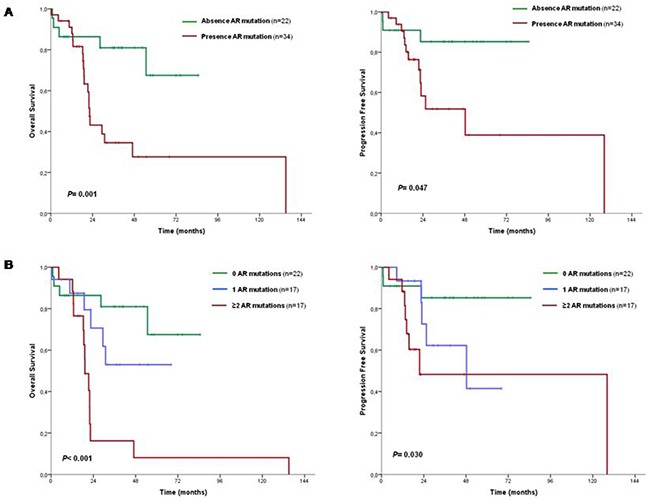
A. OS and PFS curves according to presence or absence of an adverse risk gene; B. OS and PFS curves according to number of mutations in an adverse risk gene. See Table 3 for 3-year percentage overall survival and progression free survival and confidence intervals. AR mutations: adverse risk gene mutations (ASXL1, EZH2, NRAS, SRSF2).