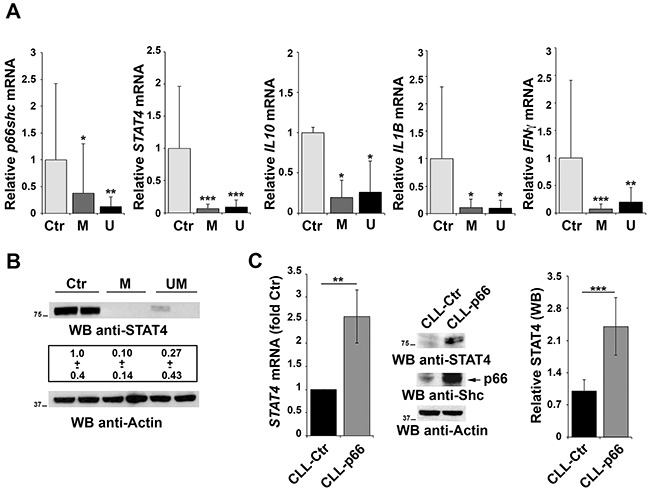
Figure 5. Impaired STAT4 expression in primary CLL B cells.

A. qRT-PCR analysis of p66shc, STAT4, IL10, IL1β and IFNγ mRNA in purified peripheral B cells from either healthy donors (Ctr, n=9) or CLL patients with mutated (M; n=15) or unmutated (U; n=15) IGHV. B. Representative immunoblot analysis of STAT4 in 2 healthy donors, 2 M-CLL and 2 U-CLL patients. The numbers below the representative blot refer to the quantification of STAT4 immunoreactive band in B-cell lysates from 10 M-CLL, 9 U-CLL and 6 healthy controls, of which at least 1 was included in each gel as reference. C. qRT-PCR analysis of STAT4 mRNA in CLL B cells nucleofected with either empty vector (CLL-Ctr) or an expression construct encoding p66Shc (CLL-p66). The relative abundance of STAT4 transcript was determined on triplicate samples from each patient using the ΔΔCt method and is expressed as the normalized fold expression (mean±SD; empty vector controls taken as 1 for all CLL samples). All samples (n=6) were checked for reconstitution of p66shc expression by qRT-PCR (data not shown). A representative immunoblot of STAT4 and p66Shc is shown on the right. Filters were reprobed for actin as loading control. The histogram shows the quantification of STAT4 in B-cell lysates from 3 reconstituted CLL samples. ***P≤ 0.001; **P≤0.01; and *P≤0.05.
