
Figure 3. Knockdown and overexpression of galectin-1 in N-HSCs.
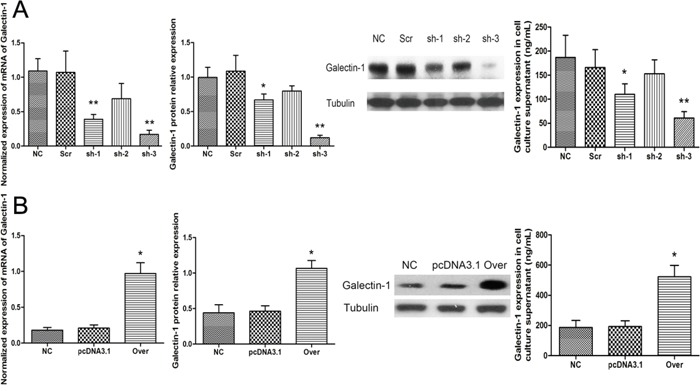
After the cells were transfected, qPCR (n = 3), western blot (30μg per lane, n = 3) and ELISA (20,000 HSCs per well, n = 4) were used to analyse galectin-1 knockdown A. and overexpression B. in HSCs. Data are shown as the means (± SD) of triplicates. *P < 0.05, **P < 0.01. NC, negative control group; Scr, non-targeting scrambled sequence group; sh, small hairpin RNA sequence transfection group; pcDNA3.1, negative control group; Over, galectin-1 overexpression group.