

Abstract
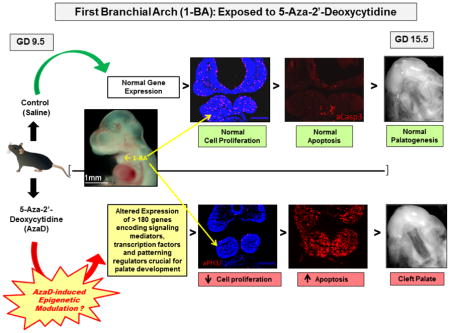
In this study, we identify gene targets and cellular events mediating the teratogenic action(s) of 5-Aza-2′-deoxycytidine (AzaD), an inhibitor of DNA methylation, on secondary palate development. Exposure of pregnant mice (on gestation day (GD) 9.5) to AzaD for 12 hrs resulted in the complete penetrance of cleft palate (CP) in fetuses. Analysis of cells of the embryonic first branchial arch (1-BA), in fetuses exposed to AzaD, revealed: 1) significant alteration in expression of genes encoding several morphogenetic factors, cell cycle inhibitors and regulators of apoptosis; 2) a decrease in cell proliferation; and, 3) an increase in apoptosis. Pyrosequencing of selected genes, displaying pronounced differential expression in AzaD-exposed 1-BAs, failed to reveal significant alterations in CpG methylation levels in their putative promoters or gene bodies. CpG methylation analysis suggested that the effects of AzaD on gene expression were likely indirect.
Keywords: 5-Aza-2′-deoxycytidine, Embryo, DNA methylation, Cleft palate, Apoptosis, Proliferation
Graphical Abstract
1. INTRODUCTION
In the United States approximately 6,800 babies are born annually with orofacial clefts, such as cleft lip with or without cleft palate (CL/P), and isolated cleft palate (CP) [1,2]. Without proper treatment, such orofacial anomalies often result in feeding and speech impediments, dental abnormalities, hearing loss, ear infections and breathing difficulties. In addition, the affected individuals, owing to their appearance, endure diverse social, emotional and psychological challenges [3].
Palatal clefting primarily occurs as the result of anomalous morphogenesis of the secondary palate. The maxillomandibular prominences of the first branchial arch (1-BA) give rise to various structures of the embryonic orofacial region (e.g. maxilla, mandible, and lateral portions of upper lip) including the palatal processes, precursors of the secondary palate or roof of the oral cavity [4]. The embryology of this process is similar in humans and mice. The critical events include emergence of the bilateral palatal processes as oral projections from the maxillary prominences, reorientation of these processes from a vertical position, lateral to the tongue, to a horizontal position above the tongue, and finally, fusion of these processes to each other along their anterior–posterior length forming the definite secondary palate [5].
Morphogenesis of the orofacial region (including the secondary palate) is reliant, in part, on the migration of neural crest cells derived from the neuroectoderm of rhombomeres 1–3 [6] into the first two branchial arches, and diversification of neural crest cell fates [7]. Since the 1-BAs serve as the palatal precursor tissue, precise regulation of expression of genes and the downstream cellular processes they guide within these tissues is essential for normal development of the secondary palate. Numerous studies using animal models have documented that anomalous 1-BA development results in CP [8–12]. Indeed, altered Wnt [11] or Shh [13] signaling in the 1-BA, both pivotal for normal development of the 1-BA, results in CP. Similarly, defects in development of the 1-BAs are also thought to contribute to craniofacial dysmorphologies that accompany Apert, Pierre Robin and Treacher Collins syndromes [14,15].
Numerous environmental factors such as nutritional deficiencies, exposure to cigarette smoke, alcohol, drugs, pesticides, and microbial infection, have been implicated in the etiology of orofacial dysmorphologies [16–21]. This allows for the hypothesis that a potential epigenetic mechanism by which some of these environmental factors elicit tissue dysmorphology is aberrant gene methylation. Support for such a notion comes from documentation of an epigenetic role of the clf2 gene in the multifactorial etiology of cleft lip and palate [22], and significant CpG island- and global DNA hypomethylation during retinoic acid-induced CP [23].
Epigenetic processes alter gene expression during embryogenesis and mediate heritable activation or silencing of genes in specific cell lineages [24–26] without modifying DNA sequences. Such processes include, but are not limited to, DNA methylation, microRNA (miRNA) function, and histone modification. Mammalian DNA methylation, occurring predominantly at cytosine residues within CpG dinucleotides, typically regulates the expression of specific genes through a transcriptional repression process catalyzed by a family of active DNA methyltransferases (DNMTs) and transcriptional regulators, collectively known as methyl-CpG-binding proteins [27,28]. The cytidine analogue, 5-Aza-2′-deoxycytidine (AzaD), is a potent DNA methylation inhibitor, and teratogen. By forming covalent adducts with cellular DNMT1, AzaD-substituted DNA inhibits DNMT1 activity and triggers demethylation of genomic DNA [29,30].
AzaD has been extensively employed to investigate the role of DNA methylation in regulating gene expression during embryogenesis [31–35]. AzaD treatment of murine fetuses on GD 9.0 has been reported to induce palatal clefting [36,37]. The current studies examining presumptive epigenetic and cellular mechanisms underlying the pathogenesis of AzaD-induced CP, identified key genes encoding several morphogenetic factors, signaling mediators, cell cycle inhibitors and pro-apoptotic factors targeted by AzaD in the developing 1-BAs.
2. MATERIALS AND METHODS
2.1 Animals
Mouse (ICR strain) husbandry and developmental staging of embryos was conducted as described previously [38]. All procedures for the humane use and handling of mice were approved by the University of Louisville Institutional Animal Care and Use Committee and encompass guidelines as set out in the European Commission Directive 86/609/EEC for animal experimentation.
2.2 5-Aza-2′-deoxycytidine Dosing Regimen and Tissue Collection
5-Aza-2′-deoxycytidine was obtained from Sigma Chemical Co., St. Louis, MO. AzaD dosage (1 mg/kg; [37]) was based on the average dam weight on GD 9.5 and was administered in sterile PBS solution. Control embryos were dosed with an equal volume of sterile PBS (vehicle). AzaD or vehicle was delivered via single intraperitoneal injection to pregnant females on GD 9.5 and embryos were collected on GD-15.5 and -17.5. For individual TaqMan quantitative real-time PCR (qRT-PCR) and for TaqMan array card-based gene expression profiling, 1-BAs of AzaD- or vehicle exposed embryos were microdissected 6, 9 and 12 hours post-exposure and pooled for analyses (Figure 6). These three treatment periods were selected on the basis of preliminary data (TaqMan qRT-PCR and immunocytochemistry) that demonstrated: (1) significant, temporal, and differential expression of several genes, and (2) a striking temporal decrease in cell proliferation and marked increase in apoptosis within tissue of the 1-BA. 1-BA tissue from three independent pools of 12 to 15 staged embryos was collected, total RNA and genomic DNA extracted (AllPrep DNA/RNA Mini Kit; Qiagen Inc., Valencia, CA), and stored at −80°C. Whole embryos were also collected 6, 9 and 12 hours post-treatment, fixed in 4% paraformaldehyde (PFA), embedded in OCT (optimal cutting temperature compound, Tissue-Tek 4583, Sakura Finetek USA, Inc., Torrance, CA), frozen at −80°C, cryosectioned and processed as described by Oh et al. [39], either for staining with hematoxylin and eosin, or immunostaining with phospho-histone-H3 or activated caspase-3 antibody, to assess cell proliferation or apoptosis, respectively.
Figure 6. Photomicrographs of embryos exposed in utero on GD 9.5 to 1 mg/kg AzaD or vehicle, for 6, 9 and 12 hours.

(A) The region demarcated by the black line was excised from AzaD- or vehicle-exposed embryos for extraction of total RNA and genomic DNA. (B), (D) and (F) represent 6, 9 and 12 hour AzaD-exposed embryos, respectively; (C), (E) and (G) represent 6, 9 and 12 hour vehicle-exposed embryos, respectively. 1-BA = first branchial arch; 2-BA = second branchial arch.
2.3 “Fetal Phenotyping” and Identification of Palate Phenotype
On GD 15.5 and 17.5, dams exposed to AzaD or vehicle, were euthanized by carbon dioxide asphyxiation followed by cervical dislocation. Uterine horns were exteriorized, and the number and location of implantations and resorptions were recorded. Fetuses were removed from the uterus, blotted, weighed, measured for crown–rump length, and inspected for gross external anomalies. Palatal development and/or degree of palate fusion was assessed by removing the lower jaw for direct visualization of the palate.
2.4 Immunohistochemistry
Embryos exposed in utero (on GD 9.5 for 6, 9 and 12 hours) to either AzaD (1mg/kg) or vehicle, were fixed in 4% PFA, washed in PBS, cryoprotected in sucrose (5–10% in PBS), incubated overnight at 4°C in 20% sucrose, immersed and embedded in OCT. Eight μm coronal sections of the embryos were cut using a Leica CM1900 cryostat (Leica Inc., Bannockburn, IL) and mounted on Superfrost/Plus microscope slides (Fisher Scientific, Pittsburgh, PA, USA). Tissue sections were washed, permeabilized in 0.1% Tween 20, and blocked in 0.1% Tween 20/1.0% BSA/5% FBS (in PBS) for 30 min at 37°C. Sections were immunostained overnight at 4°C with a 1:500 dilution of rabbit anti-phospho Histone H3 (Upstate-Millipore, Billerica, MA) for evaluation of proliferation, or rabbit anti-activated caspase 3 (Cell Signaling Technology Inc., Danvers, MA) for evaluation of apoptosis. Sections were then washed in PBS and goat anti-rabbit AF-594 secondary antibody (Molecular Probes - Life Technologies, Grand Island, NY) at a 1:200 dilution and blocking solution was applied to the sections for 60 min at 37°C. Cellular DNA was counterstained with 300 nM 4′-6′-diamidino-2-phenylindole (DAPI) (Molecular Probes - Life Technologies) and mounted under Fluoromount-G (Southern Biotech, Birmingham, Alabama) to preserve fluorescence. Tissue sections were visualized and photographed with a Nikon Eclipse TE 2000-U microscope equipped with epifluorescence optics. Fluorescent signal intensity was measured using the MetaMorph 6.5 software (Universal Imaging Inc., Downingtown, PA). To assess proliferation and apoptosis in the 1-BAs, the integrated intensity of fluorescence was measured (within the same viewing field using the MetaMorph software) utilizing triplicate sections per embryo. These experiments were performed using independent and comparable sections (in triplicate) derived from AzaD - or vehicle-exposed embryos from each treatment group (6, 9 and 12 hr).
2.5 Gene Expression Profiling and TaqMan® Quantitative Real-Time PCR
In order to establish a temporal gene expression signature of developing 1-BA tissue exposed in utero to AzaD, total RNA was extracted from microdissected 1-BAs (the region demarcated by the black line in Figure 6A) of embryos exposed to AzaD or PBS (vehicle) for 6, 9 or 12 hours. The quality and quantity of total RNA were determined using an Agilent 2100 Bioanalyzer (Agilent Technologies, Foster City, CA, USA). RNA Integrity Numbers of all the RNA samples were between 9.0 and 10.0. cDNA, synthesized from total RNA using the SuperScript® VILO™ cDNA Synthesis Kit (Life Technologies, Grand Island, NY, USA) was hybridized to custom-made, 384-well TaqMan Low-Density Array (TLDA) fluidic cards and gene expression profiling was performed using the ViiA7 Real-Time PCR System according to the manufacturer’s instructions (Applied Biosystems - Life Technologies, Grand Island, NY, USA). These array cards contain probe-primers for 379 genes (Table S2-“TLDA plate-Gene list”) encoding regulators of cell cycle/proliferation, apoptosis, signal transduction, growth/differentiation and transcription. Analysis was performed on 3 independent sets of cDNA (total RNA) and gene expression levels were normalized to the expression of the housekeeping gene β-actin. Raw data were acquired and processed with the DataAssist Software utilizing the comparative CT (ΔΔCT) method (Applied Biosystems - Life Technologies). Individual gene expression analysis was performed by TaqMan qRT-PCR (to validate the results of TLDA-card based gene expression profiling) as described [40].
2.6 Methylation Analysis
Pyrosequencing was performed as previously described using the Qiagen PyroMark Q24 instrument [41]. Methylation levels of CpG residues in putative promoters (regions extending up to ~1 kb from the translational start site) and gene bodies of 10 selected genes (Cdkn1a, Caspase 3, Fas, Tnf, E2f1, E2f2, FoxC2, FoxE1, Ptch1 and Shox2) exhibiting significant differential expression were determined in AzaD- and vehicle-treated 1-BAs. Samples for pyrosequencing were derived from no less than 2 independently amplified PCR templates. A list of primers used for DNA amplification and pyrosequencing of the selected genes is presented in Table S2 (“Primers for pyrosequencing”).
2.7 Pathway Analysis
In order to establish an overview of different signaling and biological pathways impacted in 1-BA tissues by in utero AzaD exposure, Ingenuity Pathway Analysis (IPA; Ingenuity Systems, Redwood City, CA) was performed, as previously reported [38], on differentially expressed genes within AzaD-exposed (12-hr) 1-BAs.
2.8 Statistical Analyses
The data set from TLDA-card based gene expression analysis contains 379 genes. Each gene has 9 and 8 samples for AzaD and vehicle (PBS), respectively; i.e., three replicates at 6, 9, and 12 hours from murine embryonic orofacial tissues treated with AzaD and vehicle (except for the 9 hour vehicle sample which had only two replicates). Before identifying differentially expressed genes between AzaD and vehicle at each time point, data pre-processing was performed. This included normalization and missing value imputation of gene expression data. For normalization, gene expression levels (Cycle threshold; CT) were normalized using the internal control gene (β-actin). Normalized expression levels were calculated by subtracting the CT of β-actin from the CT of the target gene. Genes with more than 3 missing entries in each treatment were removed and the remaining missing values in the data set were imputed using the K-nearest neighbor imputation scheme [42]. This resulted in, a total of 373 genes. After data pre-processing, genes that were differentially expressed when comparing AzaD- and vehicle-treated samples at each time point were identified by fitting to a hierarchical linear model using the limma package [43] and performing hypothesis tests of interest using contrasts (e.g., AzaD vs. vehicle at 6 hours, 9 hours, and 12 hours) for each gene. Fold change, moderated t-statistic, and unadjusted and FDR adjusted p-values were calculated for each gene for each comparison. Genes with unadjusted p-values below 0.05 were considered as being differentially expressed. To classify the patterns of gene expression levels between AzaD and vehicle, overall F-test was performed to detect differentially expressed genes with significant change between AzaD and vehicle across three time points. Differentially expressed genes were classified according to their patterns of gene expression levels over time. The R package limma [44] from the Bioconductor project (http://www.bioconductor.org) was used for all statistical analysis.
Independent single-tube TaqMan qRT-PCR assays were performed as described earlier to assess the expression of a selected set of genes in order to validate the results of the array cards. P-values of <0.05 were considered as indicative of statistical significance. Each experiment was conducted at least three times with comparable results.
3. RESULTS
3.1 Effect of in utero AzaD exposure on embryo growth and development of the murine secondary palate
Treatment of pregnant females with 1 mg/kg AzaD on GD 9.5 did not result in any adverse maternal outcomes as assessed by absence of both weight loss and lethality (data not shown). Similar to studies conducted by others [36,37], statistically significant decreases in average fetal weight and crown-rump length were observed at later stages of embryonic development (GD 15.5 and 17.5, data not shown). Importantly, a single dose of 1 mg/kg AzaD administered on GD 9.5 resulted in 100% cleft palate (Figure 1).
Figure 1. Photomicrographs of ventral views and coronal sections of the developing orofacial region of GD-15.5 mouse fetuses exposed in utero on GD 9.5 to AzaD.

Photomicrographs of ventral views: (A) 1 mg/kg, 5-Aza-2′-deoxycytidine (AzaD); (B) vehicle (PBS). UL = upper lip; P1 = primary palate; P2 = secondary palate. H&E stained coronal sections: (C) displays a failure of palate shelf elevation in AzaD-exposed GD 15.5 fetuses; (D) displays palate fusion in vehicle-exposed GD 15.5 fetuses (control). PS = palatal shelf; OC = oral cavity; T = tongue; P = palate.
3.2 Effect of in utero AzaD exposure on cellular proliferation within the developing first branchial arches
Since AzaD is known to inhibit cell proliferation [36, 33], we investigated whether the decreased fetal weight and crown-rump length in AzaD-exposed embryos was due to reduced cellular proliferation. Phosphorylation of histone H3 is tightly correlated with chromosome condensation during mitosis [45,46] and therefore a good indicator of cell proliferation. Immunochemical staining with the anti-phospho-histone H3 (aPH3) antibody revealed a marked reduction in cell proliferation (PH3 positive cells) in embryos exposed to AzaD when compared to those exposed to vehicle (Figure 2). Pronounced and time-dependent reductions in cellular proliferation within the developing 1-BAs of 6-, 9- and 12-hr AzaD-exposed embryos were also evident (Figures 3A and 3B). Quantification of integrated intensity of PH3 fluorescence within the 1-BAs revealed a statistically significant diminution in cell proliferation in embryos exposed to AzaD in comparison to their vehicle-exposed counterparts at each time point examined (Figure 3B). This suggests that the observed growth retardation in AzaD-exposed embryos could be due to reduction in cellular proliferation.
Figure 2. In utero exposure to AzaD for 12 hours markedly reduces cell proliferation throughout the developing embryo.

Embryos exposed in utero on GD 9.5 to 1 mg/kg AzaD or vehicle (PBS) for 12 hours, were collected and cryopreserved for frontal/coronal sectioning. Cellular proliferation was evaluated via immunostaining with the anti-phospho-histone H3 (aPH3) antibody. Representative photomicrographs of embryos labeled with aPH3 antibody (in red) are shown. Nuclei were counterstained with DAPI (blue). 1-BA-mx = maxillary component of the 1-BA; 1-BA-mb = mandibular component of the 1-BA. Scale bar=200μm.
Figure 3. In utero exposure of embryos to AzaD reduces cell proliferation within the first branchial arches.

Embryos exposed in utero on GD 9.5 to 1 mg/kg AzaD or vehicle for 6, 9 or 12 hours, were collected and cryopreserved for frontal/coronal sectioning. Cellular proliferation was evaluated via immunostaining with the anti-phospho-histone H3 (aPH3) antibody. (A) Representative photomicrographs of 1-BAs labeled with aPH3 antibody (red); nuclei were counterstained with DAPI (blue). Embryos were exposed to AzaD or vehicle for: 6 hours (A1); 9 hours (A2); and 12 hours (A3). (B) Bar graphs represent quantitative assessment of cellular proliferation within the 1-BAs, as determined by measuring the intensities of PH3 fluorescence using the Metamorph 6.5 software: embryos exposed to AzaD or vehicle for: 6 hours (B1); 9 hours (B2); and 12 hours (B3). Data represent analysis of 3 sections per embryo for 3 embryos per treatment group, per time of exposure. 1-BA-mx = maxillary component of the 1-BA; 1-BA-mb = mandibular component of the 1-BA. * p<0.05, Scale bar=200μm.
3.3 Effect of in utero AzaD exposure on apoptosis within the developing first branchial arches
To assess AzaD-induced apoptosis within 1-BAs, frontal/coronal sections of embryos from AzaD- or vehicle-injected dams for 6-, 9- or 12-hours, were immunostained with anti-activated caspase-3 antibodies. These antibodies recognize the active form of caspase 3 which plays an essential role in apoptosis. Figure 4 illustrates that AzaD significantly increased apoptosis throughout the developing embryo including the 1-BAs where the extent of apoptosis was markedly increased with time of exposure (Figures 5A and 5B).
Figure 4. In utero exposure to AzaD for 12 hours markedly enhances apoptosis throughout the developing embryo.

Embryos exposed in utero on GD 9.5 to 1 mg/kg AzaD or vehicle for 12 hours, were collected and cryopreserved for frontal/coronal sectioning. Cellular apoptosis was evaluated via immunostaining with the anti-activated caspase 3 (aCasp3) antibody. Representative photomicrographs of embryos labeled with aCasp3 antibody (in red) are shown. Nuclei were counterstained with DAPI (blue). 1-BA-mx = maxillary component of the 1-BA; 1-BA-mb = mandibular component of the 1-BA. Scale bar=200μm.
Figure 5. In utero exposure of embryos to AzaD enhances apoptosis within the first branchial arches.

Embryos exposed in utero on GD 9.5 to 1 mg/kg AzaD or vehicle (PBS) for 6, 9 or 12 hours, were collected and cryopreserved for frontal/coronal sectioning. Apoptosis was evaluated via immunostaining with the anti-activated caspase 3 (aCasp3) antibody. (A) Representative photomicrographs of 1-BAs labeled with aCasp3 antibody (in red). Embryos were exposed to AzaD or vehicle for: 6 hours (A1); 9 hours (A2); and 12 hours (A3). (B) The bar graphs represent quantitative assessment of apoptosis within the 1-BA, as determined by measuring the intensities of aCasp3 fluorescence using the Metamorph 6.5 software: embryos exposed to AzaD or vehicle for: 6 hours (B1); 9 hours (B2); and 12 hours (B3). Data represent analysis of 3 sections per embryo for 3 embryos per treatment group, per time of exposure. 1-BA-mx = maxillary component of the 1-BA; 1-BA-mb = mandibular component of the 1-BA. * p<0.05, Scale bar=200μm.
3.4 Effect of in utero AzaD exposure on the expression of genes encoding regulators of proliferation, apoptosis and palate development within the first branchial arches
AzaD altered the expression of ~40 genes after 6- and 9-hr and >180 genes after 12-hr exposure (Tables 1, 2, and 3). The number of upregulated genes increased with the time of exposure to AzaD. Specifically, expression of 10, 27 and 148 separate genes was upregulated following 6-, 9- and 12 hr exposures, respectively. Expression profiling analysis, particularly following the 12-hr AzaD exposure, revealed that genes encoding several members of the TGFβ superfamily, including Tgfβr2, Tgfβr3, Acvr1c, Acvr2b, Bmp-4,-6,-7,-8b, Gdf-7/-10/-11/-15, and Smad-2/-3/-5/-9, and members of the Wnt-β-catenin family (e.g. Wnt-1/-3/-3a/-7a/-8a/-8b/-9a/-16, Fzd-1/-2/-3/-4/-7/-8/-10, Dvl-1/-2/-3, Tcf7, and Sfrp5) were significantly upregulated in the 1-BAs (Table 3). These two signaling cascades are known to play critical roles in orofacial morphogenesis [4]. AzaD also induced differential regulation of several genes encoding regulators of cell cycle/proliferation (e.g. Ccnd1/-d2/-e1, Cdkn1a/-1b/-2a/-2b/-2d, Cdk1/-2/-6/-7, Cdc25a, E2f1/-2/-3/-4, Rbl1, and Myc) and apoptosis (e.g. Apaf1, Bax, Bid, Fas, Ikbkg, Nfkb2, Rela, Tnf, Tnfrsf1a, Tnfrsf10b, Trp53, Mapk8 (Jnk1) and Mapk9 (Jnk2)) within the 1-BAs (Tables 1, 2, and 3). Genes encoding three cyclin dependent kinase (Cdk) inhibitors (Cdkn1a, -2a and -2b; inhibitors of cell proliferation) were markedly upregulated in 1-BAs following AzaD exposure. Cdkn1a displayed a consistent ~7.0-fold upregulation following 6-, 9- and 12-hr exposures, and Cdkn2b exhibited 3.5- and 9.2-fold upregulation following 9- and 12-hr exposures, respectively (Tables 1, 2, and 3). Genes encoding a number of pro-apoptotic factors were also strikingly upregulated in 1-BAs following AzaD exposure. Specifically, Fas (Tnfr6), Tnf, and Tnfrsf10b demonstrated 8.4- and 16.5-fold, 3.6- and 19.4-fold, and 3.6- and 6.5-fold upregulation following 9- and 12-hr exposures, respectively (Tables 2, and 3). This activation of genes encoding various inhibitors of proliferation and pro-apoptotic factors is consistent with the immunohistochemical demonstration of reduction in cell proliferation and enhanced apoptosis within the developing 1-BA tissues following in utero AzaD exposure (Figures 3 and 5, respectively). Ingenuity Pathway Analysis further supported these findings by highlighting cellular processes and signaling cascades (cell cycle, apoptosis, FGF, Wnt, SHH and TGFβ superfamily) (Table S1) populated by differentially expressed genes within the AzaD-exposed (12-hr) 1-BAs (Table 3). Finally, AzaD significantly altered expression of genes encoding a number of transcriptional regulators, documented to be crucial for normal palate development: examples include Meox2, Shox2, Foxc2, Foxe1, Vax1, Lhx6, Tbx22, and Satb2 (Tables 1, 2, and 3).
Table 1.
Genes Differentially Expressed within 1st Branchial Arches Following 6 hour in utero Exposure to 1 mg/kg AzaD on GD 9.5.
| Gene Symbol | Entrez gene name | TaqMan Assay ID | Fold Changea AzaD vs. Vehicle |
p-value |
|---|---|---|---|---|
| Cdkn1a | Cyclin-dependent kinase inhibitor 1A (p21, Cip1) | Mm04205640_g1 | 6.53 | 0.00 |
| Ngfr | Nerve growth factor receptor | Mm01309638_m1 | 4.69 | 0.00 |
| Ltbp2 | Latent transforming growth factor beta binding protein 2 | Mm00522058_m1 | 3.61 | 0.01 |
| Ltbp4 | Latent transforming growth factor beta binding protein 4 | Mm00723631_m1 | 3.44 | 0.00 |
| Fst | Follistatin | Mm00514982_m1 | 3.17 | 0.00 |
| Pygo2 | Pygopus family PHD finger 2 | Mm03031056_s1 | 3.16 | 0.01 |
| Gdf5 | Growth differentiation factor 5 | Mm00433564_m1 | 2.83 | 0.01 |
| Mmp15 | Matrix metallopeptidase 15 (membrane-inserted) | Mm00485062_m1 | 2.82 | 0.01 |
| E2f1 | E2F transcription factor 1 | Mm00432936_m1 | 2.36 | 0.02 |
| Ltbp3 | Latent transforming growth factor beta binding protein 3 | Mm00521855_m1 | 2.20 | 0.03 |
| Bmpr1b | Bone morphogenetic protein receptor, type IB | Mm00432117_m1 | −2.12 | 0.03 |
| Flnb | Filamin B, beta | Mm01311723_m1 | −2.13 | 0.04 |
| Cdh1 | Cadherin 1, type 1, E-cadherin (epithelial) | Mm01247357_m1 | −2.19 | 0.03 |
| Bmp5 | Bone morphogenetic protein 5 | Mm00432091_m1 | −2.20 | 0.04 |
| Lhx6 | LIM homeobox 6 | Mm01333348_m1 | −2.31 | 0.04 |
| Atr | ATR serine/threonine kinase | Mm01223626_m1 | −2.36 | 0.04 |
| Ephb1 | EPH receptor B1 | Mm00557961_m1 | −2.37 | 0.04 |
| Btrc | Beta-transducin repeat containing E3 ubiquitin protein ligase | Mm00477680_m1 | −2.39 | 0.02 |
| Acvr1 | Activin A receptor, type I | Mm01331069_m1 | −2.43 | 0.02 |
| Dvl2 | Dishevelled segment polarity protein 2 | Mm00432899_m1 | −2.44 | 0.04 |
| Mmp16 | Matrix metallopeptidase 16 (membrane-inserted) | Mm01210646_m1 | −2.55 | 0.04 |
| Crebbp | CREB binding protein | Mm01342452_m1 | −2.58 | 0.04 |
| Dact1 | Dishevelled-binding antagonist of beta-catenin 1 | Mm00458118_m1 | −2.76 | 0.04 |
| Csnk1g3 | Casein kinase 1, gamma 3 | Mm00514183_m1 | −2.93 | 0.01 |
| Pbx1 | Pre-B-cell leukemia homeobox 1 | Mm04207617_m1 | −2.95 | 0.04 |
| Fgfr2 | Fibroblast growth factor receptor 2 | Mm01269930_m1 | −2.99 | 0.01 |
| Ctgf | Connective tissue growth factor | Mm01192933_g1 | −3.18 | 0.01 |
| Creb1 | Camp responsive element binding protein 1 | Mm00501607_m1 | −3.19 | 0.03 |
| Apc | Adenomatous polyposis coli | Mm00545872_m1 | −3.24 | 0.02 |
| Sox2 | SRY (sex determining region Y)-box 2 | Mm03053810_s1 | −3.28 | 0.03 |
| Hdac9 | Histone deacetylase 9 | Mm01293999_m1 | −3.53 | 0.02 |
| Wif1 | WNT inhibitory factor 1 | Mm00442355_m1 | −3.55 | 0.00 |
| Efnb2 | Ephrin-B2 | Mm01215897_m1 | −3.63 | 0.00 |
| Cdkn1b | Cyclin-dependent kinase inhibitor 1B (p27, Kip1) | Mm00438168_m1 | −3.90 | 0.01 |
| Ccnh | Cyclin H | Mm00445740_m1 | −4.07 | 0.04 |
| Cntn1 | Contactin 1 | Mm00514374_m1 | −4.47 | 0.00 |
| Nfkb1 | Nuclear factor of kappa light polypeptide gene enhancer in B-cells 1 | Mm00476361_m1 | −4.75 | 0.04 |
| Rock1 | Rho-associated, coiled-coil containing protein kinase 1 | Mm00485745_m1 | −4.77 | 0.02 |
| Ltbp1 | Latent transforming growth factor beta binding protein 1 | Mm00498255_m1 | −5.07 | 0.00 |
| Rbl1 | Retinoblastoma-like 1 | Mm01250721_m1 | −5.43 | 0.00 |
Gene expression from first branchial arch (1-BA) tissue from each of 6 hour 5-Aza-2′-deoxycytidine (AzaD)- and vehicle (PBS)-exposed embryos were filtered, and the average fold change for each gene was calculated for AzaD vs. Vehicle 1-BA tissue. Only those genes that demonstrated a statistically significant (adjusted p < 0.05) increase or decrease in expression for the AzaD vs. Vehicle expression comparison, were included in this table. Note that AzaD vs. Vehicle means that expression following 6 hour exposure to vehicle (PBS) was utilized as the baseline. Thus, negative numbers indicate a decrease in expression, while positive figures indicate an increase in expression
Table 2.
Genes Differentially Expressed within 1st Branchial Arches Following 9 hour in utero Exposure to 1 mg/kg AzaD on GD 9.5.
| Gene Symbol | Entrez gene name | TaqMan Assay ID | Fold Changea AzaD vs. Vehicle |
p-value |
|---|---|---|---|---|
| Ltbp2 | Latent transforming growth factor beta binding protein 2 | Mm00522058_m1 | 12.62 | 0.00 |
| Acta1 | Actin, alpha 1, skeletal muscle | Mm00808218_g1 | 8.63 | 0.00 |
| Fas | Fas cell surface death receptor | Mm01204974_m1 | 8.42 | 0.00 |
| Cdkn1a | Cyclin-dependent kinase inhibitor 1A (p21, Cip1) | Mm04205640_g1 | 6.92 | 0.00 |
| Il17f | Interleukin 17F | Mm00521423_m1 | 4.37 | 0.03 |
| Mmp9 | Matrix metallopeptidase 9 (gelatinase B, 92kda gelatinase, 92kda type IV collagenase) | Mm00442991_m1 | 4.30 | 0.00 |
| Gdf15 | Growth differentiation factor 15 | Mm00442228_m1 | 3.96 | 0.00 |
| Fst | Follistatin | Mm00514982_m1 | 3.85 | 0.00 |
| Tnf | Tumor necrosis factor | Mm00443260_g1 | 3.63 | 0.00 |
| Tnfrsf10b | Tumor necrosis factor receptor superfamily, member 10a | Mm00457866_m1 | 3.58 | 0.00 |
| Cdkn2b | Cyclin-dependent kinase inhibitor 2B (p15, inhibits CDK4) | Mm00483241_m1 | 3.50 | 0.01 |
| Wnt7a | Wingless-type MMTV integration site family, member 7A | Mm00437354_m1 | 3.43 | 0.01 |
| Sfrp5 | Secreted frizzled-related protein 5 | Mm01194236_m1 | 3.23 | 0.02 |
| Has1 | Hyaluronan synthase 1 | Mm03048195_m1 | 3.21 | 0.02 |
| Amhr2 | Anti-Mullerian hormone receptor, type II | Mm00513847_m1 | 3.01 | 0.02 |
| Wnt9a | Wingless-type MMTV integration site family, member 9A | Mm00460518_m1 | 2.95 | 0.01 |
| Icam1 | Intercellular adhesion molecule 1 | Mm00516023_m1 | 2.81 | 0.01 |
| Lefty1 | Left-right determination factor 1 | Mm03053915_s1 | 2.51 | 0.04 |
| Amh | Anti-Mullerian hormone | Mm00431795_g1 | 2.33 | 0.01 |
| Cd44 | CD44 molecule (Indian blood group) | Mm01277163_m1 | 2.30 | 0.02 |
| Sfrp4 | Secreted frizzled-related protein 4 | Mm00840104_m1 | 2.26 | 0.02 |
| Rplp2 | Ribosomal protein, large, P2 | Mm00782638_s1 | 2.24 | 0.02 |
| Nodal | Nodal growth differentiation factor | Mm00443040_m1 | 2.12 | 0.03 |
| Wisp1 | WNT1 inducible signaling pathway protein 1 | Mm00457574_m1 | 2.10 | 0.05 |
| Thbs3 | Thrombospondin 3 | Mm00449802_m1 | 2.09 | 0.03 |
| Meox2 | Mesenchyme homeobox 2 | Mm00801881_m1 | 2.08 | 0.05 |
| Ngf | Nerve growth factor (beta polypeptide) | Mm00443039_m1 | 1.79 | 0.04 |
| Frzb | Frizzled-related protein | Mm00441378_m1 | −1.98 | 0.04 |
| Wnt7b | Wingless-type MMTV integration site family, member 7B | Mm01301717_m1 | −2.11 | 0.03 |
| Prdm16 | PR domain containing 16 | Mm00712556_m1 | −2.31 | 0.02 |
| Bmp3 | Bone morphogenetic protein 3 | Mm00557790_m1 | −2.83 | 0.01 |
| Cntn1 | Contactin 1 | Mm00514374_m1 | −3.03 | 0.01 |
| Dlx5 | Distal-less homeobox 5 | Mm00438430_m1 | −3.21 | 0.01 |
| Zic3 | Zic family member 3 | Mm00494362_m1 | −5.17 | 0.00 |
| Tbx22 | T-box 22 | Mm00467433_m1 | −7.18 | 0.01 |
| Zic1 | Zic family member 1 | Mm00656094_m1 | −9.85 | 0.00 |
| Vax1 | Ventral anterior homeobox 1 | Mm00494120_m1 | −12.99 | 0.00 |
| Mmp10 | Matrix metallopeptidase 10 (stromelysin 2) | Mm01168399_m1 | −20.51 | 0.02 |
Gene expression from first branchial arch (1-BA) tissue from each of 9 hour 5-Aza-2′-deoxycytidine (AzaD)- and vehicle (PBS)-exposed embryos were filtered, and the average fold change for each gene was calculated for AzaD vs. Vehicle 1-BA tissue. Only those genes that demonstrated a statistically significant (adjusted p < 0.05) increase or decrease in expression for the AzaD vs. Vehicle expression comparison, were included in this table. Note that AzaD vs. Vehicle means that expression following 9 hour exposure to vehicle (PBS) was utilized as the baseline. Thus, negative numbers indicate a decrease in expression, while positive figures indicate an increase in expression.
Table 3.
Genes Differentially Expressed within 1st Branchial Arches Following 12 hour in utero Exposure to 1 mg/kg AzaD on GD 9.5.
| Gene Symbol | Entrez gene name | TaqMan Assay ID | Fold Changea AzaD vs. Vehicle |
p-value |
|---|---|---|---|---|
| Acvr1c | Activin A receptor, type IC | Mm03023957_m1 | 60.33 | 0.00 |
| Ltbp2 | Latent transforming growth factor beta binding protein 2 | Mm00522058_m1 | 26.25 | 0.00 |
| Fst | Follistatin | Mm00514982_m1 | 22.03 | 0.00 |
| Gdf15 | Growth differentiation factor 15 | Mm00442228_m1 | 20.55 | 0.00 |
| Tnf | Tumor necrosis factor | Mm00443260_g1 | 19.43 | 0.00 |
| Amhr2 | Anti-Mullerian hormone receptor, type II | Mm00513847_m1 | 16.73 | 0.00 |
| Fas | Fas cell surface death receptor | Mm01204974_m1 | 16.53 | 0.00 |
| Cntn1 | Contactin 1 | Mm00514374_m1 | 13.80 | 0.00 |
| Mmp8 | Matrix metallopeptidase 8 (neutrophil collagenase) | Mm00439509_m1 | 10.57 | 0.00 |
| Wnt3a | Wingless-type MMTV integration site family, member 3A | Mm00437337_m1 | 9.84 | 0.00 |
| Cdkn2b | Cyclin-dependent kinase inhibitor 2B (p15, inhibits CDK4) | Mm00483241_m1 | 9.16 | 0.00 |
| Foxc2 | Forkhead box C2 (MFH-1, mesenchyme forkhead 1) | Mm00546194_s1 | 8.38 | 0.00 |
| Il17f | Interleukin 17F | Mm00521423_m1 | 8.21 | 0.00 |
| Spp1 | Secreted phosphoprotein 1 | Mm00436767_m1 | 8.01 | 0.00 |
| Wnt1 | Wingless-type MMTV integration site family, member 1 | Mm01300555_g1 | 7.36 | 0.00 |
| Sfrp5 | Secreted frizzled-related protein 5 | Mm01194236_m1 | 7.00 | 0.00 |
| Cdkn1a | Cyclin-dependent kinase inhibitor 1A (p21, Cip1) | Mm04205640_g1 | 6.82 | 0.00 |
| Adamts8 | ADAM metallopeptidase with thrombospondin type 1 motif, 8 | Mm00479220_m1 | 6.72 | 0.00 |
| Tnfrsf10b | Tumor necrosis factor receptor superfamily, member 10a | Mm00457866_m1 | 6.48 | 0.00 |
| Mmp9 | Matrix metallopeptidase 9 (gelatinase B, 92kda gelatinase, 92kda type IV collagenase) | Mm00442991_m1 | 6.21 | 0.00 |
| Nodal | Nodal growth differentiation factor | Mm00443040_m1 | 5.91 | 0.00 |
| Wnt8b | Wingless-type MMTV integration site family, member 8B | Mm00442107_m1 | 5.86 | 0.00 |
| Wnt9a | Wingless-type MMTV integration site family, member 9A | Mm00460518_m1 | 5.78 | 0.00 |
| Amh | Anti-Mullerian hormone | Mm00431795_g1 | 5.77 | 0.00 |
| Gli1 | GLI family zinc finger 1 | Mm00494654_m1 | 5.74 | 0.00 |
| Tgfa | Transforming growth factor, alpha | Mm00446232_m1 | 5.44 | 0.00 |
| Wnt7a | Wingless-type MMTV integration site family, member 7A | Mm00437354_m1 | 5.33 | 0.00 |
| Bid | BH3 interacting domain death agonist | Mm00432073_m1 | 5.30 | 0.00 |
| Wnt8a | Wingless-type MMTV integration site family, member 8A | Mm01157914_g1 | 5.25 | 0.00 |
| Gdf10 | Growth differentiation factor 10 | Mm01220860_m1 | 5.23 | 0.00 |
| Wisp1 | WNT1 inducible signaling pathway protein 1 | Mm00457574_m1 | 5.22 | 0.00 |
| Nog | Noggin | Mm01297833_s1 | 4.90 | 0.00 |
| E2f1 | E2F transcription factor 1 | Mm00432936_m1 | 4.34 | 0.00 |
| Dvl1 | Dishevelled segment polarity protein 1 | Mm00438592_m1 | 4.24 | 0.00 |
| Bax | BCL2-associated X protein | Mm00432051_m1 | 4.23 | 0.00 |
| Ptch2 | Patched 2 | Mm00436047_m1 | 4.11 | 0.00 |
| Cdkn2a | Cyclin-dependent kinase inhibitor 2A | Mm00494449_m1 | 3.99 | 0.00 |
| Vtn | Vitronectin | Mm00495976_m1 | 3.95 | 0.00 |
| Tcof1 | Treacher Collins-Franceschetti syndrome 1 | Mm00448977_m1 | 3.90 | 0.00 |
| Chrd | Chordin | Mm00438203_m1 | 3.82 | 0.00 |
| Myc | V-myc avian myelocytomatosis viral oncogene homolog | Mm00487804_m1 | 3.77 | 0.00 |
| Ccnd2 | Cyclin D2 | Mm00438070_m1 | 3.72 | 0.00 |
| Inhba | Inhibin, beta A | Mm00434339_m1 | 3.63 | 0.00 |
| Ptch1 | Patched 1 | Mm00436026_m1 | 3.63 | 0.00 |
| Bmp8b | Bone morphogenetic protein 8b | Mm00432115_g1 | 3.62 | 0.00 |
| Ski | SKI proto-oncogene | Mm00448744_m1 | 3.53 | 0.00 |
| Gdf7 | Growth differentiation factor 7 | Mm04213617_sH | 3.50 | 0.00 |
| Fzd1 | Frizzled class receptor 1 | Mm00445405_s1 | 3.45 | 0.00 |
| Hhip | Hedgehog interacting protein | Mm00469580_m1 | 3.42 | 0.00 |
| Shox2 | Short stature homeobox 2 | Mm00443183_m1 | 3.38 | 0.00 |
| Tcf7 | Transcription factor 7, T cell specific | Mm00493445_m1 | 3.29 | 0.02 |
| Icam1 | Intercellular adhesion molecule 1 | Mm00516023_m1 | 3.28 | 0.00 |
| Fzd8 | Frizzled class receptor 8 | Mm00433419_s1 | 3.25 | 0.00 |
| Cdk6 | Cyclin-dependent kinase 6 | Mm01311342_m1 | 3.22 | 0.00 |
| Bmp4 | Bone morphogenetic protein 4 | Mm00432087_m1 | 3.16 | 0.00 |
| Thbs3 | Thrombospondin 3 | Mm00449802_m1 | 3.14 | 0.00 |
| Gusb | Glucuronidase, beta | Mm00446953_m1 | 3.13 | 0.00 |
| Bmper | BMP binding endothelial regulator | Mm01175806_m1 | 3.10 | 0.00 |
| Pecam1 | Platelet/endothelial cell adhesion molecule 1 | Mm01242584_m1 | 3.07 | 0.00 |
| Has1 | Hyaluronan synthase 1 | Mm03048195_m1 | 3.07 | 0.02 |
| Wnt3 | Wingless-type MMTV integration site family, member 3 | Mm00437336_m1 | 3.02 | 0.01 |
| Fgf4 | Fibroblast growth factor 4 | Mm03053741_s1 | 3.02 | 0.01 |
| Tnfrsf25 | Tumor necrosis factor receptor superfamily, member 25 | Mm01263821_m1 | 2.98 | 0.01 |
| Cd44 | CD44 molecule (Indian blood group) | Mm01277163_m1 | 2.91 | 0.00 |
| Rela | V-rel avian reticuloendotheliosis viral oncogene homolog A | Mm00501346_m1 | 2.91 | 0.00 |
| Nfkb2 | Nuclear factor of kappa light polypeptide gene enhancer in B-cells 2 (p49/p100) | Mm00479810_g1 | 2.89 | 0.00 |
| Cdc25a | Cell division cycle 25A | Mm00483162_m1 | 2.88 | 0.00 |
| Fzd7 | Frizzled class receptor 7 | Mm00433409_s1 | 2.88 | 0.00 |
| Apaf1 | Apoptotic peptidase activating factor 1 | Mm01223702_m1 | 2.88 | 0.00 |
| Ccne1 | Cyclin E1 | Mm00432367_m1 | 2.81 | 0.00 |
| Rplp2 | Ribosomal protein, large, P2 | Mm00782638_s1 | 2.81 | 0.01 |
| Gapdh | Glyceraldehyde-3-phosphate dehydrogenase | Mm99999915_g1 | 2.79 | 0.00 |
| Tnfrsf1a | Tumor necrosis factor receptor superfamily, member 1A | Mm00441883_g1 | 2.73 | 0.01 |
| Slc9a3r1 | Solute carrier family 9, subfamily A (NHE3, cation proton antiporter 3), member 3 regulator 1 | Mm00488865_m1 | 2.73 | 0.03 |
| Col2a1 | Collagen, type II, alpha 1 | Mm01309565_m1 | 2.68 | 0.01 |
| Adamts1 | ADAM metallopeptidase with thrombospondin type 1 motif, 1 | Mm00477355_m1 | 2.62 | 0.01 |
| Meox2 | Mesenchyme homeobox 2 | Mm00801881_m1 | 2.60 | 0.01 |
| Fzd2 | Frizzled class receptor 2 | Mm02524776_s1 | 2.58 | 0.01 |
| Bmp7 | Bone morphogenetic protein 7 | Mm00432102_m1 | 2.54 | 0.01 |
| Ikbkg | Inhibitor of kappa light polypeptide gene enhancer in B-cells, kinase gamma | Mm00494927_m1 | 2.51 | 0.01 |
| Senp2 | SUMO1/sentrin/SMT3 specific peptidase 2 | Mm00472489_m1 | 2.50 | 0.02 |
| Tnc | Tenascin C | Mm00495662_m1 | 2.49 | 0.01 |
| Foxe1 | Forkhead box E1 (thyroid transcription factor 2) | Mm00845374_s1 | 2.47 | 0.02 |
| Zic1 | Zic family member 1 | Mm00656094_m1 | 2.46 | 0.02 |
| Axin2 | Axin 2 | Mm00443610_m1 | 2.46 | 0.01 |
| Tgfbr3 | Transforming growth factor, beta receptor III | Mm00803538_m1 | 2.45 | 0.02 |
| Csnk1g1 | Casein kinase 1, gamma 1 | Mm00557447_m1 | 2.44 | 0.01 |
| Cdk2 | Cyclin-dependent kinase 2 | Mm00443947_m1 | 2.43 | 0.01 |
| Axin1 | Axin 1 | Mm01299063_m1 | 2.43 | 0.01 |
| Zic4 | Zic family member 4 | Mm00657066_m1 | 2.42 | 0.04 |
| Chd7 | Chromodomain helicase DNA binding protein 7 | Mm01219527_m1 | 2.40 | 0.01 |
| Dvl2 | Dishevelled segment polarity protein 2 | Mm00432899_m1 | 2.40 | 0.02 |
| Ccnd1 | Cyclin D1 | Mm00432359_m1 | 2.38 | 0.01 |
| Tgfbr2 | Transforming growth factor, beta receptor II (70/80kda) | Mm00436977_m1 | 2.38 | 0.03 |
| Porcn | Porcupine homolog (Drosophila) | Mm00450406_m1 | 2.38 | 0.02 |
| Sp1 | Sp1 transcription factor | Mm00489039_m1 | 2.37 | 0.03 |
| Smad3 | SMAD family member 3 | Mm01170760_m1 | 2.37 | 0.02 |
| Pvrl1 | Poliovirus receptor-related 1 (herpesvirus entry mediator C) | Mm00445392_m1 | 2.36 | 0.02 |
| Gdf11 | Growth differentiation factor 11 | Mm01159973_m1 | 2.33 | 0.01 |
| Trp53 | Tumor protein p53 | Mm01731290_g1 | 2.33 | 0.01 |
| Bmp1 | Bone morphogenetic protein 1 | Mm00802220_m1 | 2.33 | 0.04 |
| Acvr2b | Activin A receptor, type IIB | Mm01348449_m1 | 2.31 | 0.02 |
| Mmp14 | Matrix metallopeptidase 14 (membrane-inserted) | Mm00485054_m1 | 2.31 | 0.02 |
| Fbxw11 | F-box and WD repeat domain containing 11 | Mm00460241_m1 | 2.30 | 0.01 |
| Fgfr1 | Fibroblast growth factor receptor 1 | Mm00438930_m1 | 2.28 | 0.01 |
| Dkk3 | Dickkopf WNT signaling pathway inhibitor 3 | Mm00443800_m1 | 2.28 | 0.02 |
| Pygo2 | Pygopus family PHD finger 2 | Mm03031056_s1 | 2.25 | 0.05 |
| Tle4 | Transducin-like enhancer of split 4 | Mm01195172_m1 | 2.24 | 0.01 |
| Itga5 | Integrin, alpha 5 (fibronectin receptor, alpha polypeptide) | Mm00439797_m1 | 2.22 | 0.03 |
| Col11a1 | Collagen, type XI, alpha 1 | Mm00483387_m1 | 2.22 | 0.02 |
| Cdkn2d | Cyclin-dependent kinase inhibitor 2D (p19, inhibits CDK4) | Mm00486943_m1 | 2.21 | 0.01 |
| Dvl3 | Dishevelled segment polarity protein 3 | Mm00432914_m1 | 2.19 | 0.02 |
| Smad2 | SMAD family member 2 | Mm00487530_m1 | 2.18 | 0.03 |
| Ikbkb | Inhibitor of kappa light polypeptide gene enhancer in B-cells, kinase beta | Mm01222247_m1 | 2.18 | 0.02 |
| Csnk2b | Casein kinase 2, beta polypeptide | Mm00487216_m1 | 2.17 | 0.02 |
| Hprt | Hypoxanthine phosphoribosyltransferase 1 | Mm00446968 | 2.17 | 0.04 |
| Hdac7 | Histone deacetylase 7 | Mm00469527_m1 | 2.17 | 0.03 |
| Fzd3 | Frizzled class receptor 3 | Mm00445423_m1 | 2.16 | 0.02 |
| Hdac4 | Histone deacetylase 4 | Mm01299557_m1 | 2.16 | 0.01 |
| Mmp15 | Matrix metallopeptidase 15 (membrane-inserted) | Mm00485062_m1 | 2.16 | 0.03 |
| Ephb6 | EPH receptor B6 | Mm00432456_m1 | 2.14 | 0.02 |
| Csnk1g2 | Casein kinase 1, gamma 2 | Mm00506098_m1 | 2.14 | 0.02 |
| Gsk3a | Glycogen synthase kinase 3 alpha | Mm01719731_g1 | 2.14 | 0.02 |
| Kmt2b | Lysine (K)-specific methyltransferase 2B | Mm01175395_g1 | 2.14 | 0.05 |
| Bcl2 | B-cell CLL/lymphoma 2 | Mm00477631_m1 | 2.09 | 0.04 |
| Fadd | Fas (TNFRSF6)-associated via death domain | Mm00438861_m1 | 2.09 | 0.03 |
| Csnk2a2 | Casein kinase 2, alpha prime polypeptide | Mm01243455_m1 | 2.08 | 0.03 |
| E2f4 | E2F transcription factor 4, p107/p130-binding | Mm00514160_m1 | 2.07 | 0.03 |
| E2f3 | E2F transcription factor 3 | Mm01138833_m1 | 2.07 | 0.03 |
| Tle3 | Transducin-like enhancer of split 3 | Mm00437097_m1 | 2.07 | 0.04 |
| Wnt16 | Wingless-type MMTV integration site family, member 16 | Mm00446420_m1 | 2.07 | 0.02 |
| Hdac5 | Histone deacetylase 5 | Mm01246076_m1 | 2.06 | 0.04 |
| Bcor | BCL6 corepressor | Mm00551516_m1 | 2.06 | 0.03 |
| Ppp2r1a | Protein phosphatase 2, regulatory subunit A, alpha | Mm00772799_m1 | 2.04 | 0.03 |
| Traf2 | TNF receptor-associated factor 2 | Mm00801978_m1 | 2.03 | 0.05 |
| Cdk1 | Cyclin-dependent kinase 1 | Mm00772472_m1 | 2.03 | 0.03 |
| Fzd10 | Frizzled class receptor 10 | Mm00558396_s1 | 2.01 | 0.03 |
| Fn1 | Fibronectin 1 | Mm01256744_m1 | 2.01 | 0.03 |
| E2f2 | E2F transcription factor 2 | Mm00624964_m1 | 2.00 | 0.04 |
| Ctnnd1 | Catenin (cadherin-associated protein), delta 1 | Mm01334599_m1 | 1.99 | 0.03 |
| Bmp6 | Bone morphogenetic protein 6 | Mm01332882_m1 | 1.96 | 0.04 |
| Ppp2cb | Protein phosphatase 2, catalytic subunit, beta isozyme | Mm00479549_m1 | 1.94 | 0.04 |
| B2m | Beta-2-microglobulin | Mm00437762_m1 | 1.93 | 0.04 |
| Fnta | Farnesyltransferase, CAAX box, alpha | Mm00514973_m1 | 1.90 | 0.04 |
| Fzd4 | Frizzled class receptor 4 | Mm00433382_m1 | 1.89 | 0.04 |
| Dcn | Decorin | Mm00514535_m1 | 1.87 | 0.04 |
| Timp3 | TIMP metallopeptidase inhibitor 3 | Mm00441826_m1 | 1.85 | 0.04 |
| Flna | Filamin A, alpha | Mm01187533_m1 | 1.85 | 0.04 |
| Cdk7 | Cyclin-dependent kinase 7 | Mm00802284_m1 | 1.81 | 0.05 |
| Kcnj2 | Potassium inwardly-rectifying channel, subfamily J, member 2 | Mm00434616_m1 | −2.10 | 0.04 |
| Ccnb1 | Cyclin B1 | Mm03053893_gH | −2.18 | 0.04 |
| Wif1 | WNT inhibitory factor 1 | Mm00442355_m1 | −2.21 | 0.02 |
| Satb2 | SATB homeobox 2 | Mm00507331_m1 | −2.35 | 0.03 |
| Fgfr2 | Fibroblast growth factor receptor 2 | Mm01269930_m1 | −2.41 | 0.03 |
| Apc | Adenomatous polyposis coli | Mm00545872_m1 | −2.60 | 0.03 |
| Rhoa | Ras homolog family member A | Mm00834507_g1 | −2.61 | 0.05 |
| Pygo1 | Pygopus family PHD finger 1 | Mm01179015_m1 | −2.68 | 0.01 |
| Csnk1g3 | Casein kinase 1, gamma 3 | Mm00514183_m1 | −2.91 | 0.00 |
| Cxxc4 | CXXC finger protein 4 | Mm01320305_m1 | −2.93 | 0.02 |
| Ep300 | E1A binding protein p300 | Mm00625535_m1 | −2.98 | 0.03 |
| Mapk8 | Mitogen-activated protein kinase 8 | Mm00489514_m1 | −3.00 | 0.02 |
| Ctgf | Connective tissue growth factor | Mm01192933_g1 | −3.01 | 0.01 |
| Tle1 | Transducin-like enhancer of split 1 (E(sp1) homolog, Drosophila) | Mm00495643_m1 | −3.21 | 0.01 |
| Mn1 | Meningioma (disrupted in balanced translocation) 1 | Mm03038457_m1 | −3.24 | 0.00 |
| Pbx1 | Pre-B-cell leukemia homeobox 1 | Mm04207617_m1 | −3.43 | 0.01 |
| Irf6 | Interferon regulatory factor 6 | Mm00516797_m1 | −3.44 | 0.01 |
| Sox2 | SRY (sex determining region Y)- box 2 | Mm03053810_s1 | −3.44 | 0.02 |
| Mstn | Myostatin | Mm01254559_m1 | −3.54 | 0.00 |
| Lhx6 | LIM homeobox 6 | Mm01333348_m1 | −3.73 | 0.00 |
| Skp1a | S-phase kinase-associated protein 1 | Mm00495559_m1 | −3.76 | 0.02 |
| Mapk9 | Mitogen-activated protein kinase 9 | Mm00444239_m1 | −3.86 | 0.01 |
| Cul1 | Cullin 1 | Mm00516318_m1 | −4.10 | 0.00 |
| Smad5 | SMAD family member 5 | Mm01341687_g1 | −4.18 | 0.01 |
| Rbl1 | Retinoblastoma-like 1 | Mm01250721_m1 | −5.91 | 0.00 |
| Smad9 | SMAD family member 9 | Mm00649885_m1 | −6.07 | 0.00 |
| Smurf2 | SMAD specific E3 ubiquitin protein ligase 2 | Mm03024086_m1 | −6.97 | 0.01 |
| Ltbp1 | Latent transforming growth factor beta binding protein 1 | Mm00498255_m1 | −7.16 | 0.00 |
| Ccnh | Cyclin H | Mm00445740_m1 | −7.50 | 0.00 |
| Cdkn1b | Cyclin-dependent kinase inhibitor 1B (p27, Kip1) | Mm00438168_m1 | −8.54 | 0.00 |
| Rock1 | Rho-associated, coiled-coil containing protein kinase 1 | Mm00485745_m1 | −8.92 | 0.00 |
| Vax1 | Ventral anterior homeobox 1 | Mm00494120_m1 | −11.78 | 0.00 |
| Bmp10 | Bone morphogenetic protein 10 | Mm01183889_m1 | −16.28 | 0.02 |
Gene expression from first branchial arch (1-BA) tissue from each of 12 hour 5-Aza-2′-deoxycytidine (AzaD)- and vehicle (PBS)-exposed embryos were filtered, and the average fold change for each gene was calculated for AzaD vs. Vehicle 1-BA tissue. Only those genes that demonstrated a statistically significant (adjusted p < 0.05) increase or decrease in expression for the AzaD vs. Vehicle expression comparison, were included in this table. Note that AzaD vs. Vehicle means that expression following 12 hour exposure to vehicle (PBS) was utilized as the baseline. Thus, negative numbers indicate a decrease in expression, while positive figures indicate an increase in expression.
Results of gene expression profiling were independently validated using TaqMan qRT-PCR [47]. Expression levels of 12 candidate genes, exhibiting differential expression in AzaD-exposed 1-BAs, were quantified and compared to those determined by TaqMan Low-Density Arrays. Expression profiles of all genes tested were found to be in consistent agreement between the two methods (Table 4).
Table 4.
TaqMan Verification of Differentially Expressed Genes in the First Branchial Arches of GD 9.5 Murine Embryos Exposed in utero to 1 mg/kg AzaD or PBS (vehicle) for 6-, 9- and 12-hrs.
| Gene Name | Individual TaqMan Assaya,b,c | Array Card Data | ||||
|---|---|---|---|---|---|---|
| Fold Changed AzaD vs. Vehicle |
Fold Changed AzaD vs. Vehicle |
|||||
| 6 hr | 9 hr | 12 hr | 6 hr | 9 hr | 12 hr | |
| Cdkn1b | −1.30±0.05§ | −1.95±0.02 | −1.20±0.03 | −3.90±0.12 | −4.00±0.80§ | −8.54±0.08 |
|
| ||||||
| Fgfr2 | NC | −1.52±0.05 | −1.54±0.08 | −3.00±0.13 | −2.11±0.82§ | −2.40±0.11 |
|
| ||||||
| Ltbp2 | 1.30±0.53§ | 14.00±0.35 | 11.00±2.02 | 3.60±0.44 | 12.60±1.34 | 26.30±2.65 |
|
| ||||||
| Fas | 6.63±0.89§ | 7.23±1.65 | 34.00±3.14 | 3.01±1.93§ | 8.40±1.17 | 16.50±2.06 |
|
| ||||||
| Sfrp5 | NC | 2.35±0.04 | 7.20±0.84 | NC | 2.26±0.33 | 7.00±0.94 |
|
| ||||||
| Wnt9a | 1.20±0.04 | 1.91±0.12 | 3.14±0.03 | 2.11±0.07§ | 3.00±0.98 | 5.80±1.03 |
|
| ||||||
| Lhx6 | −1.73±0.11 | −4.06±1.05 | −6.15±0.87 | −2.31±0.02 | −2.02±0.99§ | −3.73±0.57 |
|
| ||||||
| Tbx22 | −1.35±0.03§ | −4.40±0.33 | −8.40±1.32 | 3.40±0.07 | −7.20±1.07 | −2.60±0.05 |
|
| ||||||
| Satb2 | −1.33±0.15§ | −1.74±0.35 | −1.90±0.18 | −2.30±0.66 | −3.01±1.76§ | −2.35±0.89 |
|
| ||||||
| Tnfrsf10b | 2.40±0.22§ | 4.90±0.69 | 3.90±0.35 | 2.05±0.04 | 3.60±0.62 | 6.50±1.12 |
|
| ||||||
| Zic1 | NC | −8.90±2.02 | 1.70±0.17 | NC | −9.90±2.01 | 2.50±0.15 |
|
| ||||||
| Ccnh | −1.34±0.02§ | −1.26±0.12 | −1.30±0.01 | −4.70±0.78 | −5.03±2.06§ | −7.50±1.11 |
Gene expression was compared using TaqMan Low-Density Array Fluidic cards and individual (single-tube) TaqMan quantitative real-time PCR as detailed in Materials and Methods.
cDNA samples were prepared from PBS (vehicle control)- and 1 mg/kg AzaD-exposed first branchial arches and subjected to TaqMan® quantitative real-time PCR (qRT-PCR) for each target gene. Analyses were performed in triplicate using data from three independent experiments.
Ct values represent the number of cycles during the exponential phase of amplification necessary to reach a predetermined threshold level of PCR product as measured by fluorescence. The more template present at the start of a reaction, the fewer the cycles required to synthesize enough fluorescent product to be recorded as statistically above background. All data were normalized to the amplification signal from the housekeeping gene, 18S rRNA or β-actin. The ΔCt values represent these normalized signals,
ΔCt = Ct sample − Ct18S rRNA/β-actin. Data presented represent mean ΔCt ± standard deviation over three replicates.
Negative methodological control reactions, which lacked reverse transcriptase, did not amplify any detectable product.
Fold-change (FC) values were determined according to the relationship: FC = 2−ΔΔCt, where ΔΔCt is the difference in ΔCt values between AzaD-exposed 1-BA samples vs. vehicle (PBS)-exposed 1-BA samples [47]. Statistical analysis comparing the two exposures (vehicle and AzaD) was done with one-way ANOVA of the ΔCt values and adjustment for multiple comparisons using Dunnett’s method. 95% confidence intervals for the FC were calculated by taking the appropriate transformation of the 95% confidence limits for the estimated difference in ΔCt values. A negative fold-change value indicates down regulation of gene expression relative to control samples and a positive fold-change value indicates up regulation. NC: represents no change in gene expression. Only those genes that demonstrated a statistically significant (adjusted p < 0.05) increase or decrease in expression for the AzaD vs. vehicle (PBS) expression comparison, were included in this table.
represents fold changes that are not statistically significant (p > 0.05).
3.5 CpG methylation analysis by pyrosequencing
DNA methylation analysis by pyrosequencing was utilized in order to determine if AzaD-induced alterations in CpG methylation levels were associated with altered expression of genes in 12-hr AzaD-treated 1-BAs (Table 3). CpG methylation levels in each of 12 genomic regions (promoters and/or gene bodies) of 10 genes that displayed significant changes in expression levels were determined (Table S2-“pyrosequencing data”). CpG methylation levels in vehicle-treated samples for 9 regions in 8 genes were quite low (<15%), thereby precluding assessment of the effects of AzaD-induced demethylation. However, specific CpG residues in the Cdkn1a promoter and in the promoter and gene body of TNF were moderately to highly methylated in vehicle-treated 1-BAs. Treatment with AzaD had little or no effect on the CpG methylation levels of these residues, except for the methylation of CpG3 in the gene body of TNF which increased from 39% to 52% (highlighted in Table S2-“pyrosequencing data”).
4. DISCUSSION
Previous studies documented clefting of the secondary palate in developing murine fetuses following intrauterine exposure during early gestation (GD 9.0 – 9.5) to the DNA methylation inhibitor and cytidine analog, 5-Aza-2′-deoxycytidine (AzaD) [36,37]. The present study corroborated and extended these results. Murine embryos exposed in utero to 1 mg/kg AzaD on GD 9.5, exhibited nearly 100% cleft palate with palatal processes that were considerably smaller (in comparison to those of the control embryos) and remained vertically oriented on either side of the tongue. Significant temporal (6- to 12-hr) reductions in cellular proliferation and increased apoptosis were clearly evident within the 1-BAs of fetuses exposed in utero to AzaD. Since 1-BAs give rise to structures of the orofacial region including the secondary palate, it is plausible that abnormalities in cellular proliferation and survival within these precursor tissues would adversely affect palatogenesis. Supportive of this premise are data demonstrating that expression of numerous genes encoding regulators of cell proliferation and apoptosis (Table S1), were significantly altered in AzaD-exposed 1-BA tissues (see “Results”). Among these, expression of genes encoding the three Cdk inhibitors (e.g. Cdkn1a, -2a and -2b) was markedly enhanced. This is consistent with the observed AzaD-induced inhibition of cell proliferation within the 1-BAs. Likewise, following in utero AzaD exposure, striking upregulation of genes encoding a number of pro-apoptotic factors (e.g. Fas, Tnf, Tnfrsf10b, Tp53, Bax, Apaf1, Myc and Nfkb2, among others) is also consistent with the observed activation of various apoptosis-inducing canonical cascades (e.g. Apoptosis-, Death receptor-, Myc-mediated apoptosis-, and p53-mediated apoptosis signaling pathways; Table S1). Supportive evidence comes from a previous study reporting AzaD-induced inhibition of proliferation and promotion of apoptosis (via a p53-dependent mechanism) of neural progenitor cells of the fetal CNS [33].
Several earlier studies reinforce the hypothesis that altered cellular proliferation and/or apoptosis within the 1-BA can contribute to palatal clefting [48–50]. Significantly retarded outgrowth (due to compromised cell proliferation) of 1-BA-derived tissues in Wnt9b−/− mice resulted in a failure of physical contact between the facial processes leading to cleft lip and palate [11]. It is now generally accepted that both FGF [51,52] and Wnt [11,53,54] signaling play a crucial role in proliferation and apoptosis during embryonic orofacial morphogenesis. Single-nucleotide polymorphisms, associated with increased risk for nonsyndromic cleft lip and palate (NSCLP), have been identified in genes of the Fgf/Fgfr family [55,56]. Included among these were Fgf4, Fgfr1 and Fgfr2 whose expression in the 1-BAs was significantly modulated by AzaD in the current study; Table S1). Palatal clefting has also been linked to mutation of genes encoding a number of Wnt signaling modulators/effectors [57–59]. In the present study, expression of genes encoding several such proteins (e.g. Wnt-1/-3/-3a/-7a/-8a/-8b/-9a/-16, Axin-1/-2, Dvl-1/-3, Dkk-3, Fzd-1/-2//-3/-4/-7/-8 and -10, among others) in the 1-BAs, was altered by AzaD (Table 3 and Table S1). Findings from the current study (Table S1) thus reinforce the centrality of the FGF and Wnt signaling pathways in palate development.
In utero AzaD exposure activated genes encoding members of the SHH signaling cascade (Tables S1). This canonical pathway plays fundamental roles in governing critical cellular events, (including proliferation and apoptosis) crucial for development of the 1-BA and palate [4]. Indeed, mutation of the PTCH1 gene (which encodes the principal receptor for the Hedgehog signaling pathway) has been linked to palatal clefting [60]. Moreover, the present study revealed that expression of genes encoding members of the Zic family of zinc-finger transcription factors, that function as Gli co-factors in Hedgehog signaling, was also significantly altered in 1-BAs following AzaD exposure. Zic1 and Zic3 were markedly downregulated (9.9- and 5.2-fold, respectively) at 9-hrs (Table 2), whereas, Zic1 and Zic4 were significantly upregulated (2.5- and 2.4-fold, respectively) at 12-hrs (Table 3) after in utero AzaD exposure. Interestingly, Gli- and Zic family of transcription factors have been implicated in abnormal palatogenesis [61]. Genes encoding four members of the SHH pathway, (e.g. Ptch-1/-2, Hhip and Gli1), whose expression has been reported to be associated with palate development [62], were all significantly upregulated in AzaD-exposed 1-BA tissues (Table 3). These findings underscore the presence of an AzaD-induced deregulation of SHH signaling in 1-BAs — potentially contributing to abnormal palatogenesis.
In utero AzaD exposure also activated genes encoding members of the TGFβ superfamily. This family, comprised of TGFβ, BMP, Nodal, Activin and GDF cytokines, execute diverse physiological functions during orofacial development, governing cell proliferation, differentiation, apoptosis and other tissue remodeling processes [4]. The critical role played by members of the TGFβ superfamily in craniofacial development is documented by the spectrum of craniofacial defects exhibited by mice harboring mutations in genes encoding TGFβ/BMP ligands, receptors or their downstream transcriptional regulators, the Smads [63–65]. A recent study reported that overexpression of the inhibitory Smad, Smad7, in neural crest cells repressed both TGFβ and BMP signaling, augmented apoptosis in branchial arches, and resulted in craniofacial anomalies [66]. Mutations in genes encoding a number of TGFβ superfamily members such as, TGFB3 [67], TGFBR1 (ALK5) or TGFBR2 [68], ALK2/ACVR1 [69], ALK3/BMPR1A [70], BMP2 [71], BMP4 [72], BMP7 [73] and GDF11 [74] have been linked to CP formation. In the present study, genes encoding 40 members of the TGFβ superfamily (noted in “Results” and Table S1), were found to be differentially regulated subsequent to in utero AzaD exposure. Inhibitors/regulators of TGFβ/BMP signaling such as, Follistatin, Noggin, and Chordin were significantly activated. AzaD also stimulated genes encoding the TGFβ-specific R-Smads (Smad-2 and -3) and repressed BMP-specific R-Smads (Smad-5 and -9). These findings underscore contrasting action(s) of AzaD on BMP and TGFβ signaling within 1-BAs, and therefore one can hypothesize that AzaD is potentially inhibiting cellular proliferation by enhancing TGFβ signaling (via upregulation of Smad2 and Smad3) and reducing BMP signal transduction (via downregulation of Smad5 and Smad9). These results highlight the possibility that TGFβ superfamily signaling is yet another potential target of AzaD’s teratogenicity, adversely affecting 1-BA and palate development.
The latent TGFβ binding proteins (LTBPs), regulators of secretion and activation of TGFβs, consist of four isoforms: Ltbp1-4. Although, their precise roles in palate development are unclear, mutations in Ltbp4 have been shown to be associated with craniofacial anomalies [75,76]. In the present study, AzaD exposure had a notable effect on the expression of all four Ltbp genes within 1-BAs: dramatic and consistent upregulation of Ltbp2 (3.6-/12.6-/26.3-fold at 6-/9-/12hr, respectively), significant downregulation of Ltbp1 (5.1- and 7.2-fold at 6- and 12-hr, respectively) and considerable upregulation of Ltbp3 and Ltbp4 (2.2- and 3.4-fold at 6 hr, respectively) (Tables 1, 2 and 3). Significant and substantial differential expression of the 4 Ltbp genes point to abnormal secretion and activation of the TGFβs in AzaD-exposed 1-BA tissues, which could contribute to anomalous palatogenesis.
In addition to the aforementioned growth factors and associated signaling mediators, expression of numerous genes encoding transcriptional regulators was significantly altered in 1-BA tissues following in utero AzaD exposure. Among these, documented to be crucial for palate development, were Foxc2, Foxe1, Shox2, Meox2, Tbx22, and Pbx. Mutations in the genes encoding two Forkhead transcription factors (Foxc2 and Foxe1) have been linked to syndromic and non-syndromic CP, respectively [77,78]. Following 12-hr in utero exposure, AzaD significantly stimulated the expression of both of these genes (Table 3). Proper bone and cartilage formation are critical to normal craniofacial development. Given that bone formation and chondrogenesis are both regulated in part by the functions of both Foxc2 [79] and Foxe1 [80], and that polymorphisms in both of these transcription factors have been linked to facial clefts [81–83], this provides added importance to these two transcription factors as foci for AzaD induced cleft palate. Adding weight to such linkage is the observation that FOXE1 functionally targets MSX1 and TGFβ3 [84], both of which play key roles in development of the palate.
Spatially oriented anterior/posterior gene networks have been shown to exist in the developing palate [85]. Indeed, localized expression and function of several anterior- (Shox2 and Msx1) and posterior- (Barx1, Meox2 and Tbx22) specific transcriptional regulators are thought to be responsible for the anterior-posterior patterning vital to morphogenesis of the secondary palate [86,87]. In the present study, AzaD significantly modulated expression of genes encoding several of these transcription factors, upregulating Shox2 (Table 3) and Meox2 (Tables 2 and 3), and downregulating Tbx22 (Table 2), within 1-BAs. This suggests the ability of AzaD to alter genes involved in patterning during 1-BA and palate development.
AzaD exposure significantly downregulated three other genes (Satb2, Vax1 and Lhx6) (Tables 2, 3 and 4) documented to play pivotal roles during palate development. Loss of function of Satb2 (encoding SATB2, a regulator of transcription and chromatin remodeling) results in increased apoptosis in the craniofacial mesenchyme [88]. Our data demonstrating an AzaD-induced cleft palate and down regulation of Satb2 and a coincident increase in apoptosis are consistent with these results. AzaD-induced clefting and down regulation of two LIM homeodomain transcription factors, Lhx6 and Lhx7, in the 1-BA is also consonant with palatal clefting seen in mice lacking both Lhx6 and Lhx7 [8].
Histone modifications have increasingly been cited as contributory in directing gene expression during orofacial ontogenesis [89,90]. Mice harboring mutations in genes encoding histone acetyltransferases (HATs), such as CBP/CREBBP [90] and MYST4 [91], as well as histone deacetylases (HDACs) such as HDAC4 [92], present with palatal dysmorphologies. Our data, demonstrating AzaD-induced clefting and increase in expression of HDACs (Hdac4, Hdac5, and Hdac7) (Table 3) and diminished expression of HATs (Crebbp, Ep300) (Tables 1 and 3, respectively) are consistent with these findings. Increased expression of HDAC would result in increased removal of acetyl groups from histones, allowing the histones to wrap the DNA more tightly with subsequent decrease in transcriptional activation. Decreased expression of histone acetyltransferases (HATs) would likewise result in a decrease in transcriptional activation by diminishing addition of acetyl groups onto histones. This allows the suggestion that AzaD exposure resulted, via two separate mechanisms, in a generalized diminution of transcriptional activation in the embryonic 1-BA.
Expression of several genes (Wnt3, Fzd10, Dvl1, Dvl3, Axin2 and Cdkn2a, among others) activated within 1-BAs subsequent to in utero AzaD exposure, have been documented by others to be modulated via methylation [93]. In order to ascertain if CpG methylation levels in the putative promoters (or gene bodies) of these genes were altered, CpG methylation analysis (pyrosequencing) was performed on 12 genic regions in 10 selected genes displaying some of the most pronounced gene expression changes. Surprisingly, CpG methylation levels remained essentially unaffected by AzaD treatment (Table S2-“pyrosequencing data”). These observations suggest that the effects of AzaD on the expression of the 182 differentially expressed genes in 1-BAs are likely indirect and/or may be due to the fact that the 1-BAs were exposed to the drug only briefly (12 hr). To explore this idea more comprehensively, Methyl Capture-Seq was performed to assess the epigenome of 1-BAs exposed in utero for 12-hr to AzaD or vehicle. The results of this analysis are presented in a following study [94].
5. CONCLUSIONS
A number of critical genes were found to be differentially expressed in 1-BA tissues following 12-hr in utero AzaD exposure. Data presented in the current study suggest a number of possible molecular targets by which AzaD can result in abnormal development of the secondary palate. These include genes that regulate cellular processes (cellular proliferation, cellular apoptosis) and signaling pathways (Shh and TGFβ) known to play roles in palatal ontogeny. Also included are transcription regulators shown to modulate development of the palate (Foxc2, Foxe1, Shox2, Meox2, Tbx22, Pbx1, Satb2, Vax1 and Lhx6) and genes involved in morphogenetic patterning of the palate (Shox2, Meox2, Tbx22). Since AzaD is a potent inhibitor of global DNA methylation, our initial assumption was that differential expression of these genes was functionally linked to alterations in DNA methylation. Analysis of promoter associated CGIs and/or gene bodies of selected differentially expressed genes, exhibiting the largest changes in fold expression, did not, however, reveal significant alterations of methylation of these regions. This suggests the possibility that these genes could be modulated indirectly – e.g., by epigenetic regulation of upstream regulators (e.g., ncRNAs and transcription factors). Indeed, a recent study by Blattler et al. [95] supports this notion. Thus, to more comprehensively assess the demethylating effects of AzaD on the 1-BA epigenome, MethylCap-Seq (MCS) analysis was performed and the results of AzaD-treated 1-BAs were compared to that of vehicle-treated 1-BAs. Findings from this study are presented separately [94].
Supplementary Material
Highlights.
5-Aza-2′-deoxycytidine (AzaD) exposure induces cleft palate in mouse embryos.
AzaD reduces proliferation and induces apoptosis in first branchial arch (1-BA).
AzaD-exposed 1-BA tissues exhibit significant changes in gene expression.
Changes in gene expression are likely not due to promoter demethylation.
Acknowledgments
Grant Sponsor and Grant Numbers:
Funding: Research reported in this publication was supported in part by an Institutional Development Award (IDeA) from the National Institute of General Medical Sciences of the National Institutes of Health under grant number P20GM103453, HD053509, DE018215, and DE021460.
The authors thank Ms. Hyejeong Jang and Dr. Lisa Sandell for assistance with bioinformatics and immunohistochemistry, respectively.
Abbreviations
- aCasp3
anti- activated caspase 3
- aPH3
anti-phosphohistone H3
- 1-BA
First branchial arch
- AzaD
5-Aza-2′-deoxycytidine
- CGI
CpG island
- CP
Cleft palate
- CL/P
Cleft lip with or without cleft palate
- DAPI
4′-6′-diamidino-2-phenylindole
- FBS
Fetal bovine serum
- GD
Gestational day
- IPA
Ingenuity Pathway Analysis
- MCS
MethylCap-Sequencing
- NSCLP
Non syndromic cleft lip and cleft palate
- PFA
Paraformaldehyde
- qRT-PCR
Quantitative real-time PCR
- TLDA
Taqman Low-density arrays
Footnotes
Conflict of Interest Statement:
The authors declare that there are no conflicts of interest.
Publisher's Disclaimer: This is a PDF file of an unedited manuscript that has been accepted for publication. As a service to our customers we are providing this early version of the manuscript. The manuscript will undergo copyediting, typesetting, and review of the resulting proof before it is published in its final citable form. Please note that during the production process errors may be discovered which could affect the content, and all legal disclaimers that apply to the journal pertain.
References
- 1.Yazdy MM, Honein MA, Rasmussen SA, Frias JL. Priorities for future public health research in orofacial clefts. Cleft Palate Craniofac J. 2007;44:351–357. doi: 10.1597/06-233.1. [DOI] [PubMed] [Google Scholar]
- 2.Mossey PA, Little J, Munger RG, Dixon MJ, Shaw WC. Cleft lip and palate. Lancet. 2009;374:1773–1785. doi: 10.1016/S0140-6736(09)60695-4. [DOI] [PubMed] [Google Scholar]
- 3.Wehby GL, Cassell CH. The impact of orofacial clefts on quality of life and healthcare use and costs. Oral Dis. 2010;16:3–10. doi: 10.1111/j.1601-0825.2009.01588.x. [DOI] [PMC free article] [PubMed] [Google Scholar]
- 4.Greene RM, Pisano MM. Palate morphogenesis: Current understanding and future directions. Birth Defects Res C Embryo Today. 2010;90:133–154. doi: 10.1002/bdrc.20180. [DOI] [PMC free article] [PubMed] [Google Scholar]
- 5.Bush JO, Jiang R. Palatogenesis: morphogenetic and molecular mechanisms of secondary palate development. Development. 2012;139:231–243. doi: 10.1242/dev.067082. [DOI] [PMC free article] [PubMed] [Google Scholar]
- 6.Kontges G, Lumsden A. Rhombencephalic neural crest segmentation is preserved throughout craniofacial ontogeny. Development. 1996;122:3229–3242. doi: 10.1242/dev.122.10.3229. [DOI] [PubMed] [Google Scholar]
- 7.Jheon AH, Schneider RA. The cells that fill the bill: neural crest and the evolution of craniofacial development. J Dent Res. 2009;88:12–21. doi: 10.1177/0022034508327757. [DOI] [PMC free article] [PubMed] [Google Scholar]
- 8.Denaxa M, Sharpe PT, Pachnis V. The LIM homeodomain transcription factors Lhx6 and Lhx7 are key regulators of mammalian dentition. Dev Biol. 2009;333:324–336. doi: 10.1016/j.ydbio.2009.07.001. [DOI] [PMC free article] [PubMed] [Google Scholar]
- 9.Chung J, Grant RI, Kaplan DR, Irwin MS. Special AT-rich binding protein-2 (SATB2) differentially affects disease-causing p63 mutant proteins. J Biol Chem. 2011;286:40671–40680. doi: 10.1074/jbc.M111.271189. [DOI] [PMC free article] [PubMed] [Google Scholar]
- 10.Jin YR, Turcotte TJ, Crocker AL, Han XH, Yoon JK. The canonical Wnt signaling activator, R-spondin2, regulates craniofacial patterning and morphogenesis within the branchial arch through ectodermal-mesenchymal interaction. Dev Biol. 2011;352:1–13. doi: 10.1016/j.ydbio.2011.01.004. [DOI] [PMC free article] [PubMed] [Google Scholar]
- 11.Jin YR, Han XH, Taketo MM, Yoon JK. Wnt9b-dependent FGF signaling is crucial for outgrowth of the nasal and maxillary processes during upper jaw and lip development. Development. 2012;139:1821–1830. doi: 10.1242/dev.075796. [DOI] [PMC free article] [PubMed] [Google Scholar]
- 12.Lu S, Lu LY, Liu MF, Yuan QJ, Sham MH, Guan XY, Huang JD. Cerebellar defects in Pdss2 conditional knockout mice during embryonic development and in adulthood. Neurobiol Dis. 2012;45:219–233. doi: 10.1016/j.nbd.2011.08.006. [DOI] [PubMed] [Google Scholar]
- 13.Bertolacini CD, Ribeiro-Bicudo LA, Petrin A, Richieri-Costa A, Murray JC. Clinical findings in patients with GLI2 mutations-phenotypic variability. Clin Genet. 2012;81:70–75. doi: 10.1111/j.1399-0004.2010.01606.x. [DOI] [PMC free article] [PubMed] [Google Scholar]
- 14.Marszalek B, Wojcicki P, Kobus K, Trzeciak WH. Clinical features, treatment and genetic background of Treacher Collins syndrome. J Appl Genet. 2002;43:223–233. [PubMed] [Google Scholar]
- 15.Senggen E, Laswed T, Meuwly JY, Maestre LA, Jaques B, Meuli R, Gudinchet F. First and second branchial arch syndromes: multimodality approach. Pediatr Radiol. 2011;41:549–561. doi: 10.1007/s00247-010-1831-3. [DOI] [PubMed] [Google Scholar]
- 16.Juriloff DM, Harris MJ. Mouse genetic models of cleft lip with or without cleft palate. Birth Defects Res A Clin Mol Teratol. 2008;82:63–77. doi: 10.1002/bdra.20430. [DOI] [PubMed] [Google Scholar]
- 17.Zhu H, Kartiko S, Finnell RH. Importance of gene-environment interactions in the etiology of selected birth defects. Clin Genet. 2009;75:409–423. doi: 10.1111/j.1399-0004.2009.01174.x. [DOI] [PubMed] [Google Scholar]
- 18.Seelan RS, Mukhopadhyay P, Pisano MM, Greene RM. Developmental epigenetics of the murine secondary palate. ILAR J. 2012;53:240–252. doi: 10.1093/ilar.53.3-4.240. [DOI] [PMC free article] [PubMed] [Google Scholar]
- 19.Vieira AR. Genetic and environmental factors in human cleft lip and palate. Front Oral Biol. 2012;16:19–31. doi: 10.1159/000337521. [DOI] [PubMed] [Google Scholar]
- 20.Kohli SS, Kohli VS. A comprehensive review of the genetic basis of cleft lip and palate. J Oral Maxillofac Pathol. 2012;16:64–72. doi: 10.4103/0973-029X.92976. [DOI] [PMC free article] [PubMed] [Google Scholar]
- 21.Rahimov F, Jugessur A, Murray JC. Genetics of nonsyndromic orofacial clefts. Cleft Palate Craniofac J. 2012;49:73–91. doi: 10.1597/10-178. [DOI] [PMC free article] [PubMed] [Google Scholar]
- 22.Plamondon JA, Harris MJ, Mager DL, Gagnier L, Juriloff DM. The clf2 gene has an epigenetic role in the multifactorial etiology of cleft lip and palate in the A/WySn mouse strain. Birth Defects Res A Clin Mol Teratol. 2011;91:716–727. doi: 10.1002/bdra.20788. [DOI] [PubMed] [Google Scholar]
- 23.Kuriyama M, Udagawa A, Yoshimoto S, Ichinose M, Sato K, Yamazaki K, Matsuno Y, Shiota K, Mori C. DNA methylation changes during cleft palate formation induced by retinoic acid in mice. Cleft Palate Craniofac J. 2008;45:545–551. doi: 10.1597/07-134.1. [DOI] [PubMed] [Google Scholar]
- 24.Mason K, Liu Z, Aguirre-Lavin T, Beaujean N. Chromatin and epigenetic modifications during early mammalian development. Anim Reprod Sci. 2012;134:45–55. doi: 10.1016/j.anireprosci.2012.08.010. [DOI] [PubMed] [Google Scholar]
- 25.Ma JY, Liang XW, Schatten H, Sun QY. Active DNA demethylation in mammalian preimplantation embryos: new insights and new perspectives. Mol Hum Reprod. 2012;18:333–340. doi: 10.1093/molehr/gas014. [DOI] [PubMed] [Google Scholar]
- 26.Leeb M, Wutz A. Establishment of epigenetic patterns in development. Chromosoma. 2012;121:251–262. doi: 10.1007/s00412-012-0365-x. [DOI] [PMC free article] [PubMed] [Google Scholar]
- 27.Bogdanovic O, Veenstra GJ. DNA methylation and methyl-CpG binding proteins: developmental requirements and function. Chromosoma. 2009;118:549–565. doi: 10.1007/s00412-009-0221-9. [DOI] [PMC free article] [PubMed] [Google Scholar]
- 28.Defossez PA, Stancheva I. Biological functions of methyl-CpG-binding proteins. Prog Mol Biol Transl Sci. 2011;101:377–398. doi: 10.1016/B978-0-12-387685-0.00012-3. [DOI] [PubMed] [Google Scholar]
- 29.Christman JK. 5-AZA-cytidine and 5-AZA-2/-deoxycytidine as inhibitors of DNA methylation: mechanistic studies and their implications for cancer therapy. Oncogene. 2002;21:5483–5495. doi: 10.1038/sj.onc.1205699. [DOI] [PubMed] [Google Scholar]
- 30.Wang Y, Liu C, Guo QL, Yan JQ, Zhu XY, Huang CS, Zou WY. Intrathecal 5-azacytidine inhibits global DNA methylation and methyl-CpG-binding protein 2 expression and alleviates neuropathic pain in rats following chronic constriction injury. Brain Res. 2011;1418:64–69. doi: 10.1016/j.brainres.2011.08.040. [DOI] [PubMed] [Google Scholar]
- 31.Zagris N, Podimatas T. 5-Azacytidine changes gene expression and causes developmental arrest of early chick embryo. Int J Dev Biol. 1994;38:741–744. [PubMed] [Google Scholar]
- 32.Ueno M, Katayama K, Yasoshima A, Nakayama H, Doi K. 5-Azacytidine (5AzC)-induced histopathological changes in the central nervous system of rat fetuses. Exp Toxicol Pathol. 2002;54:91–96. doi: 10.1078/0940-2993-00239. [DOI] [PubMed] [Google Scholar]
- 33.Ueno M, Katayama K, Yamauchi H, Nakayama H, Doi K. Cell cycle and cell death regulation of neural progenitor cells in the 5-azacytidine (5AzC)-treated developing fetal brain. Exp Neurol. 2006;198:154–166. doi: 10.1016/j.expneurol.2005.11.024. [DOI] [PubMed] [Google Scholar]
- 34.Tsuji Y, Kato Y, Tsunoda Y. The developmental potential of mouse somatic cell nuclear-transferred oocytes treated with trichostatin A and 5-aza-2′-deoxycytidine. Zygote. 2009;17:109–115. doi: 10.1017/S0967199408005133. [DOI] [PubMed] [Google Scholar]
- 35.Yu JN, Xue CY, Wang XG, Lin F, Liu CY, Lu FZ, Liu HL. 5-AZA-2′-deoxycytidine (5-AZA-CdR) leads to down-regulation of Dnmt1o and gene expression in preimplantation mouse embryos. Zygote. 2009;17:137–145. doi: 10.1017/S0967199408005169. [DOI] [PubMed] [Google Scholar]
- 36.Rogers JM, Francis BM, Sulik KK, Alles AJ, Massaro EJ, Zucker RM, Elstein KH, Rosen MB, Chernoff N. Cell death and cell cycle perturbation in the developmental toxicity of the demethylating agent, 5-aza-2′-deoxycytidine. Teratology. 1994;50:332–339. doi: 10.1002/tera.1420500504. [DOI] [PubMed] [Google Scholar]
- 37.Branch S, Franci BM, Brownie CF, Chernoff N. Teratogenic effects of the demethylating agent 5-aza-2′-deoxycytidine in the Swiss Webster mouse. Toxicology. 1996;112:37–43. doi: 10.1016/0300-483x(96)88183-2. [DOI] [PubMed] [Google Scholar]
- 38.Mukhopadhyay P, Brock G, Appana S, Webb C, Greene RM, Pisano MM. MicroRNA gene expression signatures in the developing neural tube. Birth Defects Res A Clin Mol Teratol. 2011;91:744–762. doi: 10.1002/bdra.20819. [DOI] [PMC free article] [PubMed] [Google Scholar]
- 39.Oh WJ, Westmoreland JJ, Summers R, Condie BG. Cleft palate is caused by CNS dysfunction in Gad1 and Viaat knockout mice. PLoS One. 2010;5:e9758. doi: 10.1371/journal.pone.0009758. [DOI] [PMC free article] [PubMed] [Google Scholar]
- 40.Mukhopadhyay P, Brock G, Webb C, Pisano MM, Greene RM. Strain-specific modifier genes governing craniofacial phenotypes. Birth Defects Res A Clin Mol Teratol. 2012;94:162–175. doi: 10.1002/bdra.22890. [DOI] [PMC free article] [PubMed] [Google Scholar]
- 41.Seelan RS, Appana SN, Mukhopadhyay P, Warner DR, Brock GN, Pisano MM, Greene RM. Developmental profiles of the murine palatal methylome. Birth Defects Res A Clin Mol Teratol. 2013;97:171–186. doi: 10.1002/bdra.23126. [DOI] [PMC free article] [PubMed] [Google Scholar]
- 42.Troyanskaya O, Cantor M, Sherlock G, Brown P, Hastie T, Tibshirani R, Botstein D, Altman RB. Missing value estimation methods for DNA microarrays. Bioinformatics. 2001;17:520–525. doi: 10.1093/bioinformatics/17.6.520. [DOI] [PubMed] [Google Scholar]
- 43.Smyth GK. Linear models and empirical bayes methods for assessing differential expression in microarray experiments. Stat Appl Genet Mol Biol. 2004;3 doi: 10.2202/1544-6115.1027. Article 3. [DOI] [PubMed] [Google Scholar]
- 44.Smyth G. Limma: linear models for microarray data. In: Gentleman R, Carey V, Dudoit S, Irizarry R, Huber W, editors. Bioinformatics and computational biology solutions using R and Bioconductor. Springer; New York: 2005. pp. 397–420. [Google Scholar]
- 45.Hendzel MJ, Wei Y, Mancini MA, Van Hooser A, Ranalli T, Brinkley BR, Bazett-Jones DP, Allis CD. Mitosis-specific phosphorylation of histone H3 initiates primarily within pericentromeric heterochromatin during G2 and spreads in an ordered fashion coincident with mitotic chromosome condensation. Chromosoma. 1997;106:348–360. doi: 10.1007/s004120050256. [DOI] [PubMed] [Google Scholar]
- 46.Preuss U, Landsberg G, Scheidtmann KH. Novel mitosis-specific phosphorylation of histone H3 at Thr11 mediated by Dlk/ZIP kinase. Nucleic Acids Res. 2003;31:878–885. doi: 10.1093/nar/gkg176. [DOI] [PMC free article] [PubMed] [Google Scholar]
- 47.Gibson UE, Heid CA, Williams PM. A novel method for real time quantitative RT-PCR. Genome Res. 1996;6:995–1001. doi: 10.1101/gr.6.10.995. [DOI] [PubMed] [Google Scholar]
- 48.Thomas T, Kurihara H, Yamagishi H, Kurihara Y, Yazaki Y, Olson EN, Srivastava D. A signaling cascade involving endothelin-1, dHAND and msx1 regulates development of neural-crest-derived branchial arch mesenchyme. Development. 1998;125:3005–3014. doi: 10.1242/dev.125.16.3005. [DOI] [PubMed] [Google Scholar]
- 49.Yanagisawa H, Clouthier DE, Richardson JA, Charité J, Olson EN. Targeted deletion of a branchial arch-specific enhancer reveals a role of dHAND in craniofacial development. Development. 2003;130:1069–1078. doi: 10.1242/dev.00337. [DOI] [PubMed] [Google Scholar]
- 50.Xiong W, He F, Morikawa Y, Yu X, Zhang Z, Lan Y, Jiang R, Cserjesi P, Chen Y. Hand2 is required in the epithelium for palatogenesis in mice. Dev Biol. 2009;330:131–141. doi: 10.1016/j.ydbio.2009.03.021. [DOI] [PMC free article] [PubMed] [Google Scholar]
- 51.Iwata J, Tung L, Urata M, Hacia JG, Pelikan R, Suzuki A, Ramenzoni L, Chaudhry O, Parada C, Sanchez-Lara PA, Chai Y. Fibroblast growth factor 9 (FGF9)-pituitary homeobox 2 (PITX2) pathway mediates transforming growth factor β (TGFβ) signaling to regulate cell proliferation in palatal mesenchyme during mouse palatogenesis. J Biol Chem. 2012;287:2353–2263. doi: 10.1074/jbc.M111.280974. [DOI] [PMC free article] [PubMed] [Google Scholar]
- 52.Wu W, Gu S, Sun C, He W, Xie X, Li X, Ye W, Qin C, Chen Y, Xiao J, Liu C. Altered FGF signaling pathways impair cell proliferation and elevation of palate shelves. PLoS One. 2015;10:e0136951. doi: 10.1371/journal.pone.0136951. [DOI] [PMC free article] [PubMed] [Google Scholar]
- 53.Feng C, Xu Z, Li Z, Zhang D, Liu Q, Lu L. Down-regulation of Wnt10a by RNA interference inhibits proliferation and promotes apoptosis in mouse embryonic palatal mesenchymal cells through Wnt/β-catenin signaling pathway. J Physiol Biochem. 2013;69:855–863. doi: 10.1007/s13105-013-0262-7. [DOI] [PubMed] [Google Scholar]
- 54.Kurosaka H, Iulianella A, Williams T, Trainor PA. Disrupting hedgehog and WNT signaling interactions promotes cleft lip pathogenesis. J Clin Invest. 2014;124:1660–1671. doi: 10.1172/JCI72688. [DOI] [PMC free article] [PubMed] [Google Scholar]
- 55.Riley BM, Mansilla MA, Ma J, Daack-Hirsch S, Maher BS, Raffensperger LM, Russo ET, Vieira AR, Dodé C, Mohammadi M, Marazita ML, Murray JC. Impaired FGF signaling contributes to cleft lip and palate. Proc Natl Acad Sci USA. 2007;104:4512–4517. doi: 10.1073/pnas.0607956104. [DOI] [PMC free article] [PubMed] [Google Scholar]
- 56.Wang H, Zhang T, Wu T, Hetmanski JB, Ruczinski I, Schwender H, Liang KY, Murray T, Fallin MD, Redett RJ, Raymond GV, Jin SC, Chou YH, Chen PK, Yeow V, Chong SS, Cheah FS, Jee SH, Jabs EW, Scott AF, Beaty TH. The FGF and FGFR gene family and risk of cleft lip with or without cleft palate. Cleft Palate Craniofac J. 2013;50:96–103. doi: 10.1597/11-132. [DOI] [PMC free article] [PubMed] [Google Scholar]
- 57.Juriloff DM, Harris MJ, McMahon AP, Carroll TJ, Lidral AC. Wnt9b is the mutated gene involved in multifactorial nonsyndromic cleft lip with or without cleft palate in A/WySn mice, as confirmed by a genetic complementation test. Birth Defects Res A Clin Mol Teratol. 2006;76:574–579. doi: 10.1002/bdra.20302. [DOI] [PubMed] [Google Scholar]
- 58.Menezes R, Letra A, Kim AH, Küchler EC, Day A, Tannure PN, Gomes da Motta L, Paiva KB, Granjeiro JM, Vieira AR. Studies with Wnt genes and nonsyndromic cleft lip and palate. Birth Defects Res A Clin Mol Teratol. 2010;88:995–1000. doi: 10.1002/bdra.20720. [DOI] [PMC free article] [PubMed] [Google Scholar]
- 59.Yu H, Ye X, Guo N, Nathans J. Frizzled 2 and frizzled 7 function redundantly in convergent extension and closure of the ventricular septum and palate: evidence for a network of interacting genes. Development. 2012;139:4383–4394. doi: 10.1242/dev.083352. [DOI] [PMC free article] [PubMed] [Google Scholar]
- 60.Cobourne MT, Xavier GM, Depew M, Hagan L, Sealby J, Webster Z, Sharpe PT. Sonic hedgehog signalling inhibits palatogenesis and arrests tooth development in a mouse model of the nevoid basal cell carcinoma syndrome. Dev Biol. 2009;331:38–49. doi: 10.1016/j.ydbio.2009.04.021. [DOI] [PMC free article] [PubMed] [Google Scholar]
- 61.Wannasilp N, Solomon BD, Warren-Mora N, Clegg NJ, Delgado MR, Lacbawan F, Hu P, Winder TL, Roessler E, Muenke M. Holoprosencephaly in a family segregating novel variants in ZIC2 and GLI2. Am J Med Genet A. 2011;155A:860–864. doi: 10.1002/ajmg.a.33903. [DOI] [PubMed] [Google Scholar]
- 62.Rice R, Connor E, Rice DP. Expression patterns of Hedgehog signalling pathway members during mouse palate development. Gene Expr Patterns. 2006;6:206–212. doi: 10.1016/j.modgep.2005.06.005. [DOI] [PubMed] [Google Scholar]
- 63.Nie X, Luukko K, Kettunen P. BMP signaling in craniofacial development. Int J Dev Biol. 2006;50:511–521. doi: 10.1387/ijdb.052101xn. [DOI] [PubMed] [Google Scholar]
- 64.Iwata J, Parada C, Chai Y. The mechanism of TGF-β signaling during palate development. Oral Dis. 2011;17:733–744. doi: 10.1111/j.1601-0825.2011.01806.x. [DOI] [PMC free article] [PubMed] [Google Scholar]
- 65.Parada C, Chai Y. Roles of BMP signaling pathway in lip and palate development. Front Oral Biol. 2012;16:60–70. doi: 10.1159/000337617. [DOI] [PMC free article] [PubMed] [Google Scholar]
- 66.Tang S, Snider P, Firulli AB, Conway SJ. Trigenic neural crest-restricted Smad7 over-expression results in congenital craniofacial and cardiovascular defects. Dev Biol. 2010;344:233–247. doi: 10.1016/j.ydbio.2010.05.004. [DOI] [PMC free article] [PubMed] [Google Scholar]
- 67.Kaartinen V, Voncken JW, Shuler C, Warburton D, Bu D, Heisterkamp N, Groffen J. Abnormal lung development and cleft palate in mice lacking TGF-beta 3 indicates defects of epithelial-mesenchymal interaction. Nat Genet. 1995;11:415–421. doi: 10.1038/ng1295-415. [DOI] [PubMed] [Google Scholar]
- 68.Loeys BL, Chen J, Neptune ER, Judge DP, Podowski M, Holm T, Meyers J, Leitch CC, Katsanis N, Sharifi N, Xu FL, Myers LA, Spevak PJ, Cameron DE, De Backer J, Hellemans J, Chen Y, Davis EC, Webb CL, Kress W, Coucke P, Rifkin DB, De Paepe AM, Dietz HC. A syndrome of altered cardiovascular, craniofacial, neurocognitive and skeletal development caused by mutations in TGFBR1 or TGFBR2. Nat Genet. 2005;37:275–281. doi: 10.1038/ng1511. [DOI] [PubMed] [Google Scholar]
- 69.Dudas M, Sridurongrit S, Nagy A, Okazaki K, Kaartinen V. Craniofacial defects in mice lacking BMP type I receptor Alk2 in neural crest cells. Mech Dev. 2004;121:173–182. doi: 10.1016/j.mod.2003.12.003. [DOI] [PubMed] [Google Scholar]
- 70.Liu W, Sun X, Braut A, Mishina Y, Behringer RR, Mina M, Martin JF. Distinct functions for Bmp signaling in lip and palate fusion in mice. Development. 2005;132:1453–1461. doi: 10.1242/dev.01676. [DOI] [PubMed] [Google Scholar]
- 71.Sahoo T, Theisen A, Sanchez-Lara PA, Marble M, Schweitzer DN, Torchia BS, Lamb AN, Bejjani BA, Shaffer LG, Lacassie Y. Microdeletion 20p12.3 involving BMP2 contributes to syndromic forms of cleft palate. Am J Med Genet A. 2011;155A:1646–1653. doi: 10.1002/ajmg.a.34063. [DOI] [PMC free article] [PubMed] [Google Scholar]
- 72.Chen Q, Wang H, Hetmanski JB, Zhang T, Ruczinski I, Schwender H, Liang KY, Fallin MD, Redett RJ, Raymond GV, Wu Chou YH, Chen PK, Yeow V, Chong SS, Cheah FS, Jabs EW, Scott AF, Beaty TH. BMP4 was associated with NSCL/P in an Asian population. PLoS One. 2012;7:e35347. doi: 10.1371/journal.pone.0035347. [DOI] [PMC free article] [PubMed] [Google Scholar]
- 73.Wyatt AW, Osborne RJ, Stewart H, Ragge NK. Bone morphogenetic protein 7 (BMP7) mutations are associated with variable ocular, brain, ear, palate, and skeletal anomalies. Hum Mutat. 2010;31:781–787. doi: 10.1002/humu.21280. [DOI] [PubMed] [Google Scholar]
- 74.Rot I, Kablar B. Role of skeletal muscle in palate development. Histol Histopathol. 2013;28:1–13. doi: 10.14670/HH-28.1. [DOI] [PubMed] [Google Scholar]
- 75.Altman CR, Chang C, Muñoz-Sanjuán I, Bell E, Heke M, Rifkin DB, Brivanlou AH. The latent-TGFbeta-binding-protein-1 (LTBP-1) is expressed in the organizer and regulates nodal and activin signaling. Dev Biol. 2002;248:118–127. doi: 10.1006/dbio.2002.0716. [DOI] [PubMed] [Google Scholar]
- 76.Urban Z, Hucthagowder V, Schürmann N, Todorovic V, Zilberberg L, Choi J, Sens C, Brown CW, Clark RD, Holland KE, Marble M, Sakai LY, Dabovic B, Rifkin DB, Davis EC. Mutations in LTBP4 cause a syndrome of impaired pulmonary, gastrointestinal, genitourinary, musculoskeletal, and dermal development. Am J Hum Genet. 2009;85:593–605. doi: 10.1016/j.ajhg.2009.09.013. [DOI] [PMC free article] [PubMed] [Google Scholar]
- 77.Brice G, Mansour S, Bell R, Collin JR, Child AH, Brady AF, Sarfarazi M, Burnand KG, Jeffery S, Mortimer P, Murday VA. Analysis of the phenotypic abnormalities in lymphoedema-distichiasis syndrome in 74 patients with FOXC2 mutations or linkage to 16q24. J Med Genet. 2002;39:478–483. doi: 10.1136/jmg.39.7.478. [DOI] [PMC free article] [PubMed] [Google Scholar]
- 78.Nikopensius T, Kempa I, Ambrozaitytė L, Jagomägi T, Saag M, Matulevičienė A, Utkus A, Krjutškov K, Tammekivi V, Piekuse L, Akota I, Barkane B, Krumina A, Klovins J, Lace B, Kučinskas V, Metspalu A. Variation in FGF1, FOXE1, and TIMP2 genes is associated with nonsyndromic cleft lip with or without cleft palate. Birth Defects Res A Clin Mol Teratol. 2011;91:218–225. doi: 10.1002/bdra.20791. [DOI] [PubMed] [Google Scholar]
- 79.Kim SH, Cho KW, Choi HS, Park SJ, Rhee Y, Jung HS, Lim SK. The forkhead transcription factor Foxc2 stimulates osteoblast differentiation. Biochem Biophys Res Commun. 2009;386:532–536. doi: 10.1016/j.bbrc.2009.06.071. [DOI] [PubMed] [Google Scholar]
- 80.Nakada C, Iida A, Tabata Y, Watanabe S. SForkhead transcription factor foxe1 regulates chondrogenesis in zebrafish. J Exp Zool B Mol Dev Evol. 2009;312:827–840. doi: 10.1002/jez.b.21298. [DOI] [PubMed] [Google Scholar]
- 81.Bahuau M, Houdayer C, Tredano M, Soupre V, Couderc R, Vazquez MP. FOXC2 truncating mutation in distichiasis, lymphedema, and cleft palate. Clin Genet. 2002;62:470–473. doi: 10.1034/j.1399-0004.2002.620608.x. [DOI] [PubMed] [Google Scholar]
- 82.Lennon CJ, Birkeland AC, Nuñez JA, Su GH, Lanzano P, Guzman E, Celis K, Eisig SB, Hoffman D, Rendon MT, Ostos H, Chung WK, Haddad J. Association of candidate genes with nonsyndromic clefts in Honduran and Colombian populations. Laryngoscope. 2012;122:2082–2087. doi: 10.1002/lary.23394. [DOI] [PubMed] [Google Scholar]
- 83.Yin X, Zhang H, Zhu Z, Wang H, Du Y, Li S, Zhang Z, Fan W, Pan Y. FOXE1 polymorphisms and non-syndromic orofacial cleft susceptibility in a Chinese Han population. Oral Dis. 2016;22:274–279. doi: 10.1111/odi.12435. [DOI] [PubMed] [Google Scholar]
- 84.Venza I, Visalli M, Parrillo L, De Felice M, Teti D, Venza M. MSX1 and TGF-beta3 are novel target genes functionally regulated by FOXE1. Hum Mol Genet. 2011;20:1016–1025. doi: 10.1093/hmg/ddq547. [DOI] [PubMed] [Google Scholar]
- 85.Smith TM, Lozanoff S, Iyyanar PP, Nazarali AJ. Molecular signaling along the anterior-posterior axis of early palate development. Front Physiol. 2012;3:488. doi: 10.3389/fphys.2012.00488. [DOI] [PMC free article] [PubMed] [Google Scholar]
- 86.Yu L, Gu S, Alappat S, Song Y, Yan M, Zhang X, Zhang G, Jiang Y, Zhang Z, Zhang Y, Chen Y. Shox2-deficient mice exhibit a rare type of incomplete clefting of the secondary palate. Development. 2005;132:4397–4406. doi: 10.1242/dev.02013. [DOI] [PubMed] [Google Scholar]
- 87.Jin JZ, Ding J. Analysis of Meox-2 mutant mice reveals a novel postfusion-based cleft palate. Dev Dyn. 2006;235:539–546. doi: 10.1002/dvdy.20641. [DOI] [PubMed] [Google Scholar]
- 88.Britanova O, Depew MJ, Schwark M, Thomas BL, Miletich I, Sharpe P, Tarabykin V. Satb2 haploinsufficiency phenocopies 2q32-q33 deletions, whereas loss suggests a fundamental role in the coordination of jaw development. Am J Hum Genet. 2006;79:668–678. doi: 10.1086/508214. [DOI] [PMC free article] [PubMed] [Google Scholar]
- 89.Jin B, Tao Q, Peng J, Soo HM, Wu W, Ying J, Fields CR, Delmas AL, Liu X, Qiu J, Robertson KD. DNA methyltransferase 3B (DNMT3B) mutations in ICF syndrome lead to altered epigenetic modifications and aberrant expression of genes regulating development, neurogenesis and immune function. Hum Mol Genet. 2008;17:690–709. doi: 10.1093/hmg/ddm341. [DOI] [PubMed] [Google Scholar]
- 90.Demeer B, Andrieux J, Receveur A, Morin G, Petit F, Julia S, Plessis G, Martin-Coignard D, Delobel B, Firth HV, Thuresson AC, Lanco Dosen S, Sjörs K, Le Caignec C, Devriendt K, Mathieu-Dramard M. Duplication 16p13.3 and the CREBBP gene: confirmation of the phenotype. Eur J Med Genet. 2013;56:26–31. doi: 10.1016/j.ejmg.2012.09.005. [DOI] [PubMed] [Google Scholar]
- 91.Kraft M, Cirstea IC, Voss AK, Thomas T, Goehring I, Sheikh BN, Gordon L, Scott H, Smyth GK, Ahmadian MR, Trautmann U, Zenker M, Tartaglia M, Ekici A, Reis A, Dörr HG, Rauch A, Thiel CT. Disruption of the histone acetyltransferase MYST4 leads to a Noonan syndrome-like phenotype and hyperactivated MAPK signaling in humans and mice. J Clin Invest. 2011;121:3479–3491. doi: 10.1172/JCI43428. [DOI] [PMC free article] [PubMed] [Google Scholar]
- 92.DeLaurier A, Nakamura Y, Braasch I, Khanna V, Kato H, Wakitani S, Postlethwait JH, Kimmel CB. Histone deacetylase-4 is required during early cranial neural crest development for generation of the zebrafish palatal skeleton. BMC Dev Biol. 2012;12:16. doi: 10.1186/1471-213X-12-16. [DOI] [PMC free article] [PubMed] [Google Scholar]
- 93.Tsang V, Fry RC, Niculescu MD, Rager JE, Saunders J, Paul DS, Zeisel SH, Waalkes MP, Stýblo M, Drobná Z. The epigenetic effects of a high prenatal folate intake in male mouse fetuses exposed in utero to arsenic. Toxicol Appl Pharmacol. 2012;264:439–450. doi: 10.1016/j.taap.2012.08.022. [DOI] [PMC free article] [PubMed] [Google Scholar]
- 94.Seelan RS, Mukhopadhyay P, Warner DR, Pisano MM, Greene RM. Determinants of orofacial clefting II: Effects of 5-Aza-2′-deoxycytidine on gene methylation during development of the first branchial arch. Reprod Toxicol. 2016 doi: 10.1016/j.reprotox.2016.11.020. (submitted as an accompanying paper) [DOI] [PMC free article] [PubMed] [Google Scholar]
- 95.Blattler A, Yao L, Witt H, Guo Y, Nicolet CM, Berman BP, Farnham PJ. Global loss of DNA methylation uncovers intronic enhancers in genes showing expression changes. Genome Biol. 2014;15:469. doi: 10.1186/s13059-014-0469-0. [DOI] [PMC free article] [PubMed] [Google Scholar]
Associated Data
This section collects any data citations, data availability statements, or supplementary materials included in this article.