Abstract
Eukaryotic cells heavily depend on adenosine triphosphate (ATP) generated by oxidative phosphorylation (OXPHOS) within mitochondria. ATP is the major energy currency molecule, which fuels cell to carry out numerous processes, including growth, differentiation, transportation and cell death among others (Khakh and Burnstock, 2009). Therefore, ATP levels can serve as a metabolic gauge for cellular homeostasis and survival (Artal-Sanz and Tavernarakis, 2009; Gomes et al., 2011; Palikaras et al., 2015). In this protocol, we describe a method for the determination of intracellular ATP levels using a bioluminescence approach in the nematode Caenorhabditis elegans.
Keywords: Ageing, ATP, Caenorhabditis elegans, Energy homeostasis, Luciferase, Metabolism, Mitochondria
Background
Mitochondria-derived ATP plays a crucial role in a variety of cellular and metabolic processes. Therefore, several methods have been developed to measure the levels of this important metabolite (Drew and Leeuwenburgh, 2003; Khan, 2003; Lagido et al., 2001; Vives-Bauza et al., 2007). In 1947, McElroy proposed the use of firefly bioluminescence to determine intracellular ATP levels, when he uncovered the essential role of ATP in light production (McElroy, 1947). The development of cloning and recombinant protein technology facilitated the development of the firefly luciferase assay to determine ATP levels (de Wet et al., 1985). Firefly luciferase, a monomeric 61 kD enzyme, catalyzes the oxidation of luciferin, which emits light at 560 nm. When ATP is the limiting factor of the enzymatic reaction, the intensity of light is proportional to the concentration of ATP. Thus, the use of a luminometer permits the detection of light intensity and subsequently the determination of ATP levels. In this protocol, we describe a method for ATP quantification using a bioluminescence approach in C. elegans.
Materials and Reagents
1.5 ml tube
Greiner Petri dishes (60 x 15 mm) (Greiner Bio One, catalog number: 628161)
Toothpick
L4 larvae
C. elegans strains (wild type [N2] and pink-1[tm1779])
Escherichia coli OP50 strain (obtained from the Caenorhabditis Genetics Center)
Liquid nitrogen
Lyophilized ATP (provided with ATP bioluminescence assay kit CLS II) (Roche Diagnostics, catalog number: 11699695001)
Distilled water
Pierce™ BCA Protein Assay Kit (Thermo Fisher Scientific, Thermo Scientific™, catalog number: 23225)
Glue
70% of EtOH
ATP bioluminescence assay kit CLS II (Roche Diagnostics, catalog number: 11699695001)
Sodium chloride (NaCl) (EMD Millipore, catalog number: 1064041000)
Bacto™ peptone (BD, catalog number: 211677)
Streptomycin (Sigma-Aldrich, catalog number: S-6501)
Agar (Sigma-Aldrich, catalog number: 05040)
Cholesterol stock solution (SERVA Electrophoresis, catalog number: 17101.01)
Calcium chloride (CaCl2) (Sigma-Aldrich, catalog number: C-5080)
Magnesium sulfate (MgSO4) (Sigma-Aldrich, catalog number: M-7506)
Nystatin stock solution (Sigma-Aldrich, catalog number: N-3503)
Potassium dihydrogen phosphate (KH2PO4) (EMD Millipore, catalog number: 1048731000)
Na2HPO4 (EMD Millipore, catalog number: 1065860500)
K2HPO4
Potassium chloride (KCl) (Sigma-Aldrich, catalog number: P-5405)
Phosphate buffer (1 M; sterile, see Recipes)
Nematode growth medium (NGM) agar plates (see Recipes)
M9 buffer (see Recipes)
Equipment
Dissecting stereomicroscope (Olympus, model: SMZ645)
Incubators for stable temperature (AQUA®LYTIC incubator 20 °C)
TD-20/20 luminometer (Turner Designs, model: 2020-000)
Tabletop centrifuge (Eppendorf, model: 5424)
Freezers (Siemens, -20 °C; So-Low Environmental Euipment, model: So-Low Ultra C85-22 horizontal -80 °C freezer)
Heat plate
Hot pot
Software
Microsoft Office 2011 Excel (Microsoft Corporation, Redmond, USA)
Procedure
-
Preparation of a synchronized nematode population
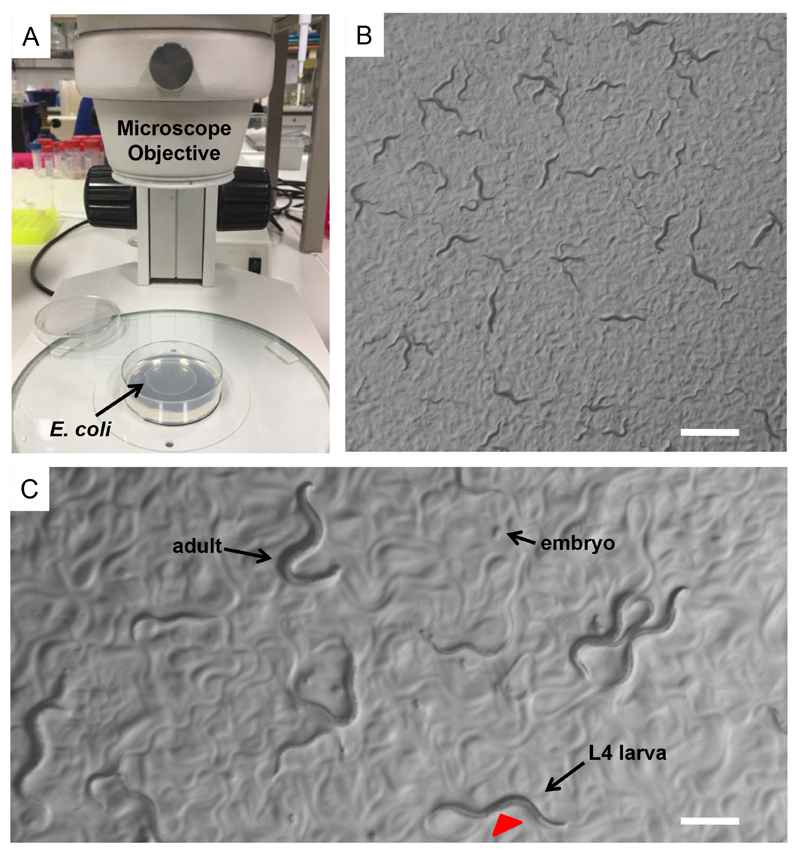
Select L4 larvae of each strain by using a dissecting stereomicroscope. Place 4-6 L4 larvae on a freshly Escherichia coli (OP50) seeded NGM plate (Figures 1A-1C). Use at least three plates for each nematode strain.
Incubate the nematodes at the standard temperature of 20 °C.
Four days later the plates contain mixed animals population.
Synchronize nematodes by picking L4 larvae of each strain under a dissecting stereomicroscope and transfer them onto separate freshly E. coli (OP50) seeded plates (Figures 1A-1C).
Add 20-25 L4 larvae per plate. For each experimental condition, use at least five plates.
-
Preparation of nematodes samples
Use an eyebrow/eyelash hair and collect 50-100 adult animals in 50 μl of M9 buffer in a 1.5 ml tube (see Note 1).
Use the same number of animals of each strain during sample preparation.
Freeze the samples in liquid nitrogen.
Store the samples at -80 °C until further analysis.
Immerse frozen worms in boiling water for 15 min.
Place the samples on ice for 5 min.
Spin down samples at 14,800 x g for 10 min at 4 °C.
Transfer sample supernatants into new 1.5 ml tubes.
Dilute sample supernatants tenfold by adding water before measurement.
Keep the samples on ice or store them at -20 °C.
-
Preparation of working solutions (ATP standards and luciferase reagent)
-
ATP standards
Dissolve lyophilized ATP by adding the appropriate volume of distilled water to get final concentration of 10 mg/ml or 16.5 mM (see Note 2).
Store ATP standard solution at -20 °C. ATP standard solutions are stable for at least one week.
-
Dilute ATP standards by serial dilutions in the range of 10 to 1 x 10⁻⁴ µM. Prepare serial dilutions of one ATP standard solution using distilled water to generate the ATP standard curve.
Note: Diluted ATP standards solutions are stable for 8 h at 4 °C. Store them at -20 °C for longer periods of time.
-
Luciferase reagent
Dissolve lyophilized luciferase by adding 10 ml of distilled water.
Incubate dissolved luciferase for 5 min at 4 °C.
Gentle swirl the bottle and mix for a homogeneous solution. Avoid shaking.
Store luciferase reagent at -20 °C (see Note 3).
-
-
Determination of ATP levels
Add 100 μl of each sample or ATP standard in a 1.5 ml tube. Use a sample containing M9 buffer as blank (no ATP). For each sample or ATP standard, use at least 3 replicates.
Add 100 μl luciferase reagent to the sample/standard (see Note 4).
Incubate for 10 sec at room temperature.
Measure and record ATP levels of the sample/standard by using TD-20/20 luminometer.
Prepare and measure the next sample/standard. Repeat steps D1-D4.
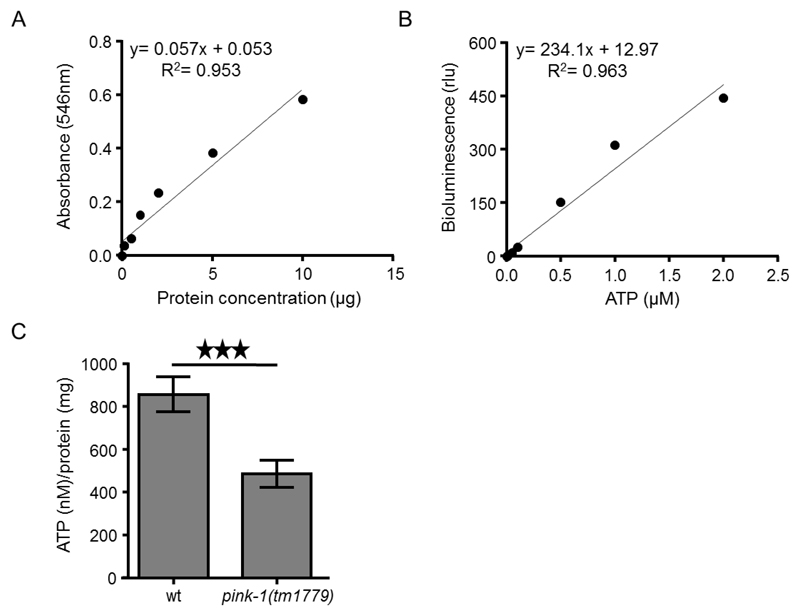
Transfer supernatants (solubilized proteins; obtained during step B8) of each sample into new 1.5 ml tubes and measure protein concentration using a standard protein kit, such as Pierce™ BCA Protein Assay Kit, following the instructions of the manufacturer (Figure 2A).
Open and review the recorded data (obtained during steps D4 and D6) in Microsoft Office 2011 Excel.
Subtract the value of the ATP blank sample form the raw data.
Prepare ATP standard curve by using the concentrations of ATP standards and their respective bioluminescence values.
Calculate the ATP content of each sample by using a log-log plot of the ATP standard curve data (Figure 2B).
Divided the ATP levels (obtained during step D10) with the total protein amount (nM/mg; obtained in step D6) in Microsoft Office 2011 Excel software.
Subject the data to further and more advanced statistical analysis (Figure 2C).
Figure 1. Caenorhabditis elegans.
A. E. coli (OP50) seeded NGM plates on the base of a dissecting stereomicroscope. Bacterial lawn is visible on the surface of the agar. B. A mix population of C. elegans nematodes observed through the dissecting stereomicroscope. Nematodes leave tracks on the plate surface indicating their movements on the bacterial lawn. Scale bar = 1 mm. C. During development worms increase in size throughout four larval stages (L1, L2, L3 and L4). L4 hermaphrodite nematodes can be distinguished by the developing vulva (red arrowhead), which is a clear half circle in the center of the ventral side. Scale bar = 0.5 mm.
Figure 2. Intracellular measurement of ATP levels in C. elegans.
A. Typical standard curve of bovine serum albumin (BSA) by using BCA protein determination assay. B. ATP standard curve using ATP bioluminescence assay kit CLS II. ATP dilutions were assayed with luciferase reagent in TD-20/20 luminometer. C. ATP levels are decreased in PINK-1 depleted nematodes (***P < 0.001; unpaired t-test). Error bars denote SEM.
Data analysis
For each strain or condition, use at least 100 animals to obtain more accurate results.
For each experiment, the same number of nematodes should be examined for each strain and condition.
Each assay should be repeated at least three (3) times.
Use the Student’s t-test with a significance cut-off level of P < 0.05 for comparisons between two groups.
Use the one-factor (ANOVA) variance analysis and correct by the post hoc Bonferroni test for multiple comparisons.
Notes
Take a toothpick and glue an eyebrow/eyelash hair to the tip of it. Let it dry at room temperature. Then, use this tool to pick nematodes. Before using the eyebrow/eyelash hair always sterilize it by using 70% of EtOH.
Each bottle of lyophilized ATP contains approximately 10 mg (> 98% purity; Mr: 605.2; ATP bioluminescence assay kit CLS II).
Each freeze/thaw cycle reduces luciferase activity. Therefore, a. Avoid repeated freezing and thawing; b. Prepare aliquots of luciferase (1 ml); c. Set up a new ATP standard curve after each freeze/thaw cycle.
Luciferase activity is influenced by extreme pH values. The optimal pH value for the luciferase reaction is between 7.6-8.0.
Recipes
-
Phosphate buffer (1 M)
For 1 L, dissolve 102.2 g KH2PO4 and 57.06 g K2HPO4 in distilled water and fill up to 1 L. This is a 1 M solution, pH 6.0
Autoclave and keep at room temperature
-
Nematode growth medium (NGM) agar plates
Mix 3 g NaCl, 2.5 g Bacto™ peptone, 0.2 g streptomycin, 17 g agar and add 900 ml distilled water. Autoclave
Let cool to 55-60 °C
Add 1 ml cholesterol stock solution, 1 ml 1 M CaCl2, 1 ml 1 M MgSO4, 1 ml nystatin stock solution, 25 ml sterile 1 M phosphate buffer, pH 6.0, and distilled sterile water up to 1 L
Pour about 8 ml medium per Petri dish and leave to solidify
Store the plates at 4 °C until used
-
M9 buffer
Dissolve 3 g KH2PO4, 6 g Na2HPO4, 5 g NaCl in 1 L distilled water. Autoclave
Let cool and add 1 ml 1 M MgSO4 (sterile)
Store M9 buffer at 4 °C
Acknowledgments
This work was funded by grants from the European Research Council (ERC), the European Commission 7th Framework Programme and Bodossaki Foundation Postdoctoral Research Fellowship. The protocol has been adapted from Palikaras et al. (2015), Nature 521, 525-528.
References
- 1.Artal-Sanz M, Tavernarakis N. Prohibitin couples diapause signalling to mitochondrial metabolism during ageing in C. elegans. Nature. 2009;461(7265):793–797. doi: 10.1038/nature08466. [DOI] [PubMed] [Google Scholar]
- 2.de Wet JR, Wood KV, Helinski DR, DeLuca M. Cloning of firefly luciferase cDNA and the expression of active luciferase in Escherichia coli. Proc Natl Acad Sci U S A. 1985;82(23):7870–7873. doi: 10.1073/pnas.82.23.7870. [DOI] [PMC free article] [PubMed] [Google Scholar]
- 3.Drew B, Leeuwenburgh C. Method for measuring ATP production in isolated mitochondria: ATP production in brain and liver mitochondria of Fischer-344 rats with age and caloric restriction. Am J Physiol Regul Integr Comp Physiol. 2003;285(5):R1259–1267. doi: 10.1152/ajpregu.00264.2003. [DOI] [PubMed] [Google Scholar]
- 4.Gomes LC, Di Benedetto G, Scorrano L. During autophagy mitochondria elongate, are spared from degradation and sustain cell viability. Nat Cell Biol. 2011;13(5):589–598. doi: 10.1038/ncb2220. [DOI] [PMC free article] [PubMed] [Google Scholar]
- 5.Khakh BS, Burnstock G. The double life of ATP. Sci Am. 2009;301(6):84–90. 92. doi: 10.1038/scientificamerican1209-84. [DOI] [PMC free article] [PubMed] [Google Scholar]
- 6.Khan HA. Bioluminometric assay of ATP in mouse brain: Determinant factors for enhanced test sensitivity. J Biosci. 2003;28(4):379–382. doi: 10.1007/BF02705114. [DOI] [PubMed] [Google Scholar]
- 7.Lagido C, Pettitt J, Porter AJ, Paton GI, Glover LA. Development and application of bioluminescent Caenorhabditis elegans as multicellular eukaryotic biosensors. FEBS Lett. 2001;493(1):36–39. doi: 10.1016/s0014-5793(01)02271-2. [DOI] [PubMed] [Google Scholar]
- 8.McElroy WD. The energy source for bioluminescence in an isolated system. Proc Natl Acad Sci U S A. 1947;33(11):342–345. doi: 10.1073/pnas.33.11.342. [DOI] [PMC free article] [PubMed] [Google Scholar]
- 9.Palikaras K, Lionaki E, Tavernarakis N. Coordination of mitophagy and mitochondrial biogenesis during ageing in C. elegans. Nature. 2015;521(7553):525–528. doi: 10.1038/nature14300. [DOI] [PubMed] [Google Scholar]
- 10.Vives-Bauza C, Yang L, Manfredi G. Assay of mitochondrial ATP synthesis in animal cells and tissues. Methods Cell Biol. 2007;80:155–171. doi: 10.1016/S0091-679X(06)80007-5. [DOI] [PubMed] [Google Scholar]


