

Abstract
Objective
To examine age–period–cohort effects on trends in gestational diabetes mellitus (GDM) prevalence in the US, and to evaluate how these trends have affected the rates of stillbirth and large for gestational age (LGA)/macrosomia.
Design
Retrospective cohort study.
Setting
USA, 1979–2010.
Population
Over 125 million pregnancies (3 337 284 GDM cases) associated with hospitalisations.
Methods
Trends in GDM prevalence were examined via weighted Poisson models to parse out the extent to which GDM trends can be attributed to maternal age, period of delivery, and maternal birth cohort. Multilevel models were used to assess the contribution of population effects to the rate of GDM. Log-linear Poisson regression models were used to estimate the contributions of the increasing GDM rates to changes in the rates of LGA and stillbirth between 1979–81 and 2008–10.
Main outcome measures
Rates and rate ratios (RRs).
Results
Compared with 1979–1980 (0.3%), the rate of GDM has increased to 5.8% in 2008–10, indicating a strong period effect. Substantial age and modest cohort effects were evident. The period effect is partly explained by period trends in body mass index (BMI), race, and maternal smoking. The increasing prevalence of GDM is associated with a 184% (95% CI 180–188%) decline in the rate of LGA/macrosomia and a 0.75% (95% CI 0.74–0.76) increase in the rate of stillbirths for 2008–10, compared with 1979–81.
Conclusions
The temporal increase in GDM can be attributed to period of pregnancy and age. Increasing BMI appears to partially contribute to the GDM increase in the US.
Keywords: Age–period–cohort analysis, gestational diabetes, temporal trends
Introduction
As one of the most ubiquitous conditions complicating pregnancy, gestational diabetes mellitus (GDM) affects an estimated 8.3% of pregnancies worldwide.1 The prevalence rate of GDM in the US is 3–4%, affecting upwards of 110 000 women annually.2 Women with GDM are more likely to later develop type-II diabetes, and are at increased risk for pre-eclampsia and gestational hypertensive disorders in their subsequent pregnancies.3–5 Women with GDM are also at increased risk of delivering infants that are large for gestational age, and are therefore more likely to be delivered by caesarean and/or suffer birth injury.3,6,7 Children born from these pregnancies are subsequently at increased risk for type-II diabetes and obesity later in life.7,8 Recent research has also demonstrated an association between GDM and an increased risk of autism spectrum disorders.9
With five international workshops on GDM held since 1979, the screening and diagnostic criteria have evolved over the past several decades. The definition of GDM from the inaugural conference as ‘carbohydrate intolerance of variable severity recognised for the first time in pregnancy’ was updated in 1998 to include impaired glucose tolerance as additional criteria for GDM.10,11 The changing criteria for GDM have also complicated the interpretation of prior epidemiological studies.
Although studies have examined temporal changes in the prevalence of GDM,2,12,13 to our knowledge none have sought to identify the extent to which these trends can be attributed to the year the mother was born (birth cohort), the year the infant was delivered (period), and maternal age. Parsing out the factors that contribute to the temporal trends is important in order to identify the contribution of cultural and environmental changes to trends in GDM across maternal birth cohorts and infant birth periods. Furthermore, there are known racial disparities for GDM,2 making it important to examine variation in the contribution of each of these factors by race, when possible.
The objectives of this study were to: (1) conduct an age– period–cohort (APC) analysis to examine the extent to which each of the age, period, and cohort components has contributed to temporal changes in the prevalence of GDM from 1979 to 2010 in the US; (2) identify the contribution of trends in body mass index (BMI) and other population factors to the increasing prevalence of GDM; and (3) quantify how changes in the prevalence of GDM are associated with rates of stillbirths and infants large for gestational age or with macrosomia. We frame these analyses with an examination of the timing of changes in trends with implementation of and changes in GDM screening and diagnostic criteria, and also include secondary analyses of the above trends stratified by race.
Methods
Cohort
Using the National Hospital Discharge Survey (NHDS) database, we identified deliveries associated with GDM via ICD9 coding (delivery, V27.0–V27.9; gestational diabetes, 648.8x). NHDS data are publicly available annually from 1965 to 2010, and include data on short-term inpatient hospital stays in the US. Further discussion of data collection methods has been provided elsewhere.2,14 To adjust for the sampling design and to obtain national estimates, the frequency weighting provided on the NHDS data sets were applied to all analyses. Cohort composition was restricted to deliveries occurring from 1979 onwards; prior to 1979, all diagnoses in the NHDS data were coded based on the International Classification of Diseases, revision 8 (ICD-8), which did not distinguish pregestational from gestational diabetes. Furthermore, the first international workshop on GDM was held in 1980, making this a reasonable starting time for our study. Women younger than 15 years of age and women aged 50 years and older were excluded from the analysis. We also excluded women with pregestational but not gestational diabetes to maintain the reference group as truly non-diabetic. As these data are completely de-identified and publicly available, we did not seek ethics approval from an institutional review board.
Covariates
Covariates considered from the NHDS database include race (white, black, other), single marital status, multiple births (singleton/multiple), chronic hypertension (ICD-9 codes 642.00–642.24), gestational hypertension (ICD-9 codes 642.30–642.34), pre-eclampsia (ICD-9 codes 642.40–642.49; 642.50–642.54; 642.70–642.74; 642.90–642.94), and insurance status (Medicaid, self-pay, private, other). Hospital-level covariates included hospital ownership (proprietary, government, non-profit), region (Northeast, Midwest, South, West), and number of beds (<100, 100–199, 200–299, 300–499, ≥500). Hispanic origin was unavailable; data on race were unavailable for 20.5% of women in the NHDS.
Age–period–cohort models
In order to quantify the contributions of maternal age, maternal birth cohort, and period of delivery to trends in GDM, an APC analysis was implemented.15 Parsing out the contributions of each of these three factors enables us to identify the sources of variation that underlie the trends in gestational diabetes over the past 31 years. Birth cohort is a linear function of age and period (cohort = period – age), rendering traditional regression analyses with all three covariates inestimable because of the collinearity introduced. The APC model used for the present analysis iteratively introduces parameters to model the temporal age, period, and cohort trends via log-linear Poisson regression.16,17 This iterative process begins by including a linear term for maternal age, then estimating the drift and curvature parameters related to period and cohort effects. The drift parameter is the estimate of the effect that can be attributed to the sum of the linear period and cohort effects. The curvature parameter accounts for deviations from linearity; its parameter estimates represent the direction and magnitude of the trend that is uniquely attributable to each of the two effects. Each of the age, period, and cohort effects were fitted with a natural spline transformation with six knots. With this parameterisation, the age effects were interpreted as the prevalence rates of GDM for the reference period (1985) and reference cohort (1960). APC modelling was performed in R 3.1.1 (https://www.r-project.org/) via the apc.fit function of the EPI package.15
Multilevel model
We created hierarchical APC models in SAS 9.4 PROC GLIMMIX (SAS Institute, Cary, NC, USA) to estimate whether trends in maternal characteristics were associated with the observed period and cohort effects of GDM in these data. Cohort-level summaries by period and cohort of the covariates listed above on the NHDS data set were considered. Unfortunately, maternal BMI and smoking status were not recorded in the NHDS data, but we were able to adjust for the population-level trends in BMI and smoking by using average BMI and smoking data available from the National Health and Nutrition Examination Survey (NHANES) for the years under study, where available.18 In NHANES, we computed the smoking rates among pregnant women in the US from 1989 to 2012. Data for smoking specifically by maternal birth cohort were unavailable. Trends in BMI were recorded as the percentage of women that were considered obese (BMI ≥ 30.0 kg/m2) by period and cohort.
These hierarchical models used maternal age as a fixed effect, and allowed a random intercept that was cross-classified by time period and birth cohort (yearly categorical variables). We then regressed these intercepts on average levels of maternal characteristics by period and cohort (where available) in order to estimate the association between those characteristics and the observed period and cohort trends, as described by Yang and colleagues.19
Contribution of GDM to perinatal outcomes
We assessed the extent to which trends in GDM prevalence rates are associated with changes in rates of large for gestational age (LGA; ICD-9 codes 766.1× and 775.0×) or macrosomia (ICD-9 codes 656.6×, 766.0×, and 766.1×), and stillbirths (ICD-9 code 656.4×). LGA births are traditionally defined as newborns with a birthweight above the 90th percentile for gestational age. Similarly, macrosomia is defined as infants with a birthweight >4000 g. We used log-linear models with these outcomes as the dependent variable and period of delivery as the primary independent predictor, categorised into 1979–81 and 2008–10. From this model we estimated the predicted rates of the outcome (stillbirth and LGA/macrosomia) in 1979–81 and 2008–10, and computed the rate ratios (RRs), comparing later years with earlier years. We used the same model to obtain the adjusted predicted rates (and the RRs) adjusted for covariates of maternal age, race, marital status, region, and multiple births, as well as the adjusted predicted rates (and the RRs) adjusted for covariates and GDM. From the adjusted predicted rates, we computed the percentage relative change in stillbirth and LGA/macrosomia rates in 2008–10 with the rates in 1979–81 as the reference. We then calculated the difference in the relative percentage changes from the model adjusted for covariates and the model adjusted for covariates plus GDM. This estimate is interpreted as the contribution of the change in GDM prevalence rates to changes in LGA rates between 2008–10 and 1979–81, a methodology applied based on previous work by Ananth and Vintzileos.20
Secondary and sensitivity analysis
To further investigate variability in the relationship among maternal age, period, and cohort factors with GDM, we examined the APC effects stratified by race (white and black) and region (Northeast, Midwest, South, and West). We also ran an additional APC analysis that was restricted to singleton births as a sensitivity analysis.
Results
We identified 124 352 115 deliveries after excluding 365 584 women younger than 15 years of age or older than 50 years of age, and 867 576 women with pregestational diabetes only. In this cohort, 2.7% (n = 3 337 284) of women were diagnosed with GDM. Among cases of GDM, 51.8% where among white women and 10.8% of cases were among black women, with 37.4% of cases among women with race listed as other or unknown (Table 1). White women have a slightly higher risk of GDM (RR 1.06, 95% CI 1.06–1.06). Race was classified as ‘Other’ for only 6.7% of women in our cohort, making cases of GDM for other racial groups too small for further robust analysis.
Table 1.
Distribution of maternal characteristics based on GDM in the US, 1979–2010
| Non-diabetic | Gestational diabetes
|
||
|---|---|---|---|
| n (%) | n (%) | RR (95% CI) | |
| Number of pregnancies | 121 014 831 (97.3) | 3 337 284 (2.7) | |
| Maternal age (years) mean (standard deviation) | 26.6 (5.9) | 30.3 (5.8) | – |
| 15–19 | 15 086 449 (12.5) | 103 446 (3.1) | 0.35 (0.35–0.35) |
| 20–24 | 32 899 603 (27.2) | 470 553 (14.1) | 0.72 (0.71–0.72) |
| 25–29 | 35 545 382 (29.4) | 895 897 (26.8) | 1.00 (ref.) |
| 30–34 | 25 274 029 (20.9) | 1 032 733 (30.9) | 1.29 (1.29–1.29) |
| 35–39 | 10 195 395 (8.4) | 648 866 (19.4) | 1.88 (1.88–1.89) |
| 40–44 | 1 882 979 (1.6) | 175 053 (5.2) | 3.25 (3.23–3.26) |
| 45–49 | 130 994 (0.1) | 10 736 (0.3) | 3.23 (3.16–3.29) |
| Maternal race | |||
| White | 72 376 093 (59.8) | 1 728 497 (51.8) | 1.00 (ref.) |
| Black | 16 103 700 (13.3) | 361 944 (10.8) | 0.95 (0.95–0.95) |
| Other | 7 916 333 (6.5) | 366 963 (11.0) | 1.78 (1.77–1.78) |
| Unknown | 24 618 705 (20.3) | 879 880 (26.4) | 1.33 (1.33–1.33) |
| Marital status | |||
| Married | 58 095 707 (48.0) | 1 476 600 (44.2) | 1.00 (ref.) |
| Single | 27 213 018 (22.5) | 595 197 (17.8) | 0.90 (0.90–0.90) |
| Unknown | 35 706 106 (29.5) | 1 265 487 (37.9) | 1.21 (1.21–1.21) |
| Multiple births | 1 653 477 (1.4) | 70 528 (2.1) | 1.55 (1.54–1.56) |
| Chronic hypertension | 757 996 (0.6) | 99 210 (3.0) | 4.75 (4.72–4.78) |
| Gestational hypertension | 2 290 124 (1.9) | 140 226 (4.2) | 2.22 (2.21–2.23) |
| Pre-eclampsia | |||
| Normotensive | 116 759 421 (93.9) | 3 109 149 (93.2) | 1.00 (ref.) |
| Mild pre-eclampsia | 3 108 084 (2.5) | 164 183 (4.9) | 1.93 (1.93–1.94) |
| Severe pre-eclampsia | 890 955 (0.7) | 38 595 (1.2) | 1.62 (1.60–1.64) |
| Unknown | 256 371 (0.2) | 25 357 (0.8) | – |
95% CI, 95% confidence interval; RR, unadjusted risk ratio.
Age–period–cohort models
Compared with 1979–81, rates of GDM in 2008–10 have increased 23-fold (RR 23.6, 95% CI 23.4–23.9; Figure 1). The distribution of GDM by maternal age with select delivery periods and birth cohorts is shown in Table 2, and in Tables S1A and 1B for white and black women, respectively. Moving from left to right to examine overall trends in GDM for the same delivery period and birth cohort, the GDM rates typically increase with increasing age. For example, the rate of GDM among women aged 15–19 years delivering in 2010 was 1.6%, and increased to 14.3% among women aged 40–44-years delivering in the same period. Furthermore, GDM shows evidence of an increase in prevalence with period. The rate of GDM among women aged 25–29 years was 0.2% for deliveries in 1980, increasing to 6.2% for deliveries in 2010. This increase was evident across all age and race categories (Table 2).
Figure 1.
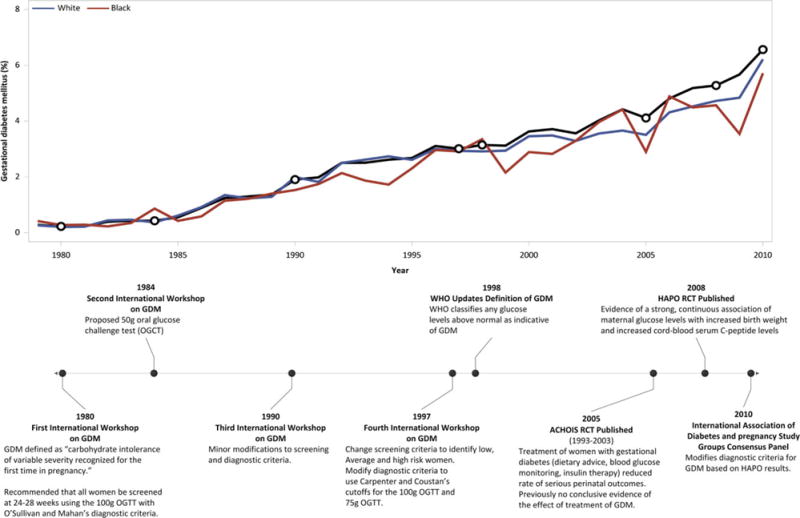
Trends in gestational diabetes over time in the US, from 1979 to 2010. Absolute rates are shown for the overall cohort (black), as well as stratified by white and black women (blue and red lines, respectively). The timeline highlights important events in the history of gestational diabetes diagnosis and screening criteria.
Table 2.
Gestational diabetes rates (%) by maternal age, period, and maternal birth cohorts in the US, 1979–2010
| Period of birth | Maternal age (years)
|
Central maternal birth cohort | |||||
|---|---|---|---|---|---|---|---|
| 15–19 | 20–24 | 25–29 | 30–34 | 35–39 | 40–44 | ||
| 0.8 | 1937 | ||||||
| 1.0 | 3.2 | 1942 | |||||
| 0.3 | 1.2 | 8.9 | 1947 | ||||
| 0.2 | 0.8 | 3.6 | 8.3 | 1952 | |||
| 0.1 | 0.5 | 2.8 | 4.4 | 11.8 | 1957 | ||
| 0.1 | 0.4 | 1.7 | 3.8 | 5.8 | 9.1 | 1962 | |
| 1980 | 0.2 | 1.2 | 2.6 | 5.0 | 8.0 | 14.3 | 1967 |
| 1985 | 0.7 | 1.6 | 3.4 | 5.8 | 11.3 | 1972 | |
| 1990 | 0.6 | 2.5 | 3.8 | 7.9 | 1977 | ||
| 1995 | 0.7 | 2.0 | 6.2 | 1982 | |||
| 2000 | 1.3 | 4.4 | 1987 | ||||
| 2005 | 1.6 | 1992 | |||||
| 2010 | |||||||
The effects of maternal age, delivery period, and maternal birth cohort were simultaneously modelled within an APC framework. Maternal age was strongly associated with GDM, showing similar increases in rates from about 0.1% to almost 5.0% as maternal age increases from 15 to 50 years (Figure 2). Cohort effects demonstrate low rate ratios for GDM, with the exception of women born prior to 1950 and after 1990, where the RRs are increased slightly. Compared with women delivering in 1985, women delivering in 2010 were at an approximately eight-fold risk for being diagnosed with GDM. The fit of the APC models for GDM are shown in the Table S2. All parameters in the model, including age, drift, and period and cohort curvatures provided the best fit.
Figure 2.
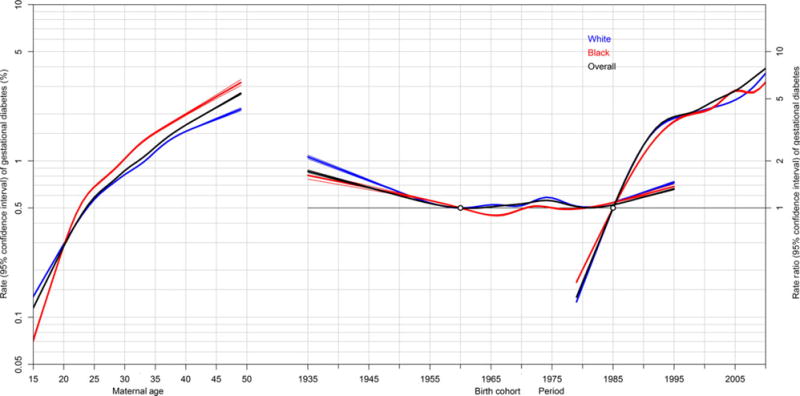
Age–period–cohort effects on gestational diabetes mellitus (GDM) in the US, 1979–2010. Rates with 95% confidence intervals are shown on the left vertical axis for maternal age, and risk ratios with 95% confidence intervals are shown on the right vertical axis for period (1980 as the reference period) and maternal birth cohort (1965 as the reference cohort); USA, 1979–2010. Rates of GDM by maternal age are adjusted for period and birth cohorts, and risk ratios for period and maternal birth cohort effects are adjusted for the other two factors.
Multilevel model results
Results from the multilevel cross-classified random-effects models are consistent with our initial APC analysis (Table S3). The rate of GDM increases with increasing age and with increasing period; cohort effects are modest and often have an RR of less than 2.0. After adjusting for obesity, period, and cohort effects, the variability in the period effect of gestational diabetes became less important (P < 0.001–0.02), and became non-significant after adjusting for obesity, race, and smoking status (P = 0.13). The period effect of smoking itself is non-significant, however. After adjusting for all available covariates, the variability in the cohort effect remained unexplained (P < 0.001).
Contribution of GDM to adverse perinatal outcomes
Stillbirth
The crude rate (per 1000) of stillbirth in 1979–81 was 6.55, and decreased to 3.47 in 2008–10 (RR 0.53, 95% CI 0.52–0.54). This decline became stronger after adjustment for maternal age, race, and region of delivery (North, South, Midwest and West), marital status, and plurality (Table 3). Following further adjustment for the increase in GDM, the RR increased slightly to 0.43 (95% CI 0.43–0.44), indicating that the 23.6-fold increase in GDM from 1979–81 to 2008–10 is associated with a 0.7% increase in the rate of stillbirth. In other words, had the rate of GDM remained unchanged over this period then the rate of stillbirth would have declined by 57.4% (RR 0.43), but instead declined by only 56.7% (RR 0.43), a difference of 0.7%.
Table 3.
Contribution of gestational diabetes to changes in the rates of perinatal outcomes
| Perinatal outcome | Rate (per 1000)
|
Relative change 1979–81 to 2008–10
|
|||
|---|---|---|---|---|---|
| 1979–81 (n = 11 224 085) | 2008–10 (n = 11 981 101) | RR (95% CI) | % change (95% CI) | RD (95% CI) | |
| Stillbirth | |||||
| Crude change | 6.55 | 3.47 | 0.53 (0.52, 0.54) | −47.1 (−47.7, −46.5) | −3.09 (−3.14, −3.03) |
| Change adjusted for confounding factors* | 6.70 | 2.85 | 0.43 (0.42, 0.43) | −57.4 (−58.1, −56.7) | −3.73 (−3.80, −3.66) |
| Plus adjustment for GDM | 6.74 | 3.31 | 0.43 (0.43, 0.44) | −56.7 (−57.4, −55.9) | −3.68 (−3.75, −3.61) |
| Incremental effect of GDM | 0.007 (0.007, 0.008) | 0.7 (0.7, 0.8) | |||
| Large for gestational age/macrosomia | |||||
| Crude change | 0.97 | 22.97 | 23.64 (23.19, 24.09) | 2264 (2219, 2309) | 22.00 (21.91, 22.09) |
| Change adjusted for confounding factors* | 0.91 | 20.07 | 22.10 (21.65, 22.56) | 2110 (2065, 2156) | 20.06 (19.93, 20.18) |
| Plus adjustment for GDM | 0.92 | 18.69 | 20.26 (19.85, 20.68) | 1926 (1885, 1968) | 17.64 (17.5, 17.75) |
| Incremental effect of GDM | −1.84 (−1.80, −1.88) | −184 (−180, −188) | |||
95% CI, 95% confidence interval; RD, risk difference; RR, risk ratio.
Confounding factors include maternal age, race, marital status, region, and multiple births.
LGA/macrosomia
The crude rate (per 1000) of LGA/macrosomia was 0.97 in 1979–81, and increased almost 24-fold (RR 23.64, 95% CI 23.19, 24.09) to 22.97 in 2008–10. The increase was slightly attenuated after adjustment for confounding factors (RR 22.10, 95% CI 21.65–22.56). When these trends were further adjusted for the 23.6-fold increase in GDM over this period, the increase of LGA/macrosomia dropped further to 20.26 (95% CI 19.85–20.68). The increased rate of GDM is associated with a 184% decrease in the number of infants diagnosed as LGA/macrosomia (Table 3).
Secondary and sensitivity analyses
The APC analyses stratified by race portrayed similar effects for white and black women with GDM. Black women had a slightly higher risk with increasing age, but white women had a slightly higher risk by birth cohort (Figure 2). The APC results stratified by four regions (North, Midwest, South, and West) demonstrated patterns largely similar to the overall analyses (Figure S1), although cohort effects were stronger for earlier cohorts in the Midwest and West. Considering only singleton deliveries, the APC results mirrored those of the primary analysis (Figure S2).
Discussion
Main findings
This study suggests three major findings. First, the increasing prevalence of advanced maternal age was a major factor in increasing GDM rates. Second, the period effect is accounted for after adjusting for trends in BMI, race, and smoking prevalence. Finally, with more common diagnosis of GDM, the prevalence of LGA decreased but stillbirth rates remain unaffected.
Strengths and limitations
The strengths of the study include an analysis that is based on one of the largest number of pregnancies in the US. We were able to carry out robust modelling of GDM trends simultaneously adjusting for two of the most important factors for GDM: BMI and maternal smoking. All analyses stratified by maternal race provide further robustness to the overall APC influences on GDM trends.
We do not have data on whether or not all women were screened for GDM. Guidelines on prenatal screening have evolved over time, and there are no records on the NHDS database that indicate if all pregnant women are screened. Therefore, both screened and unscreened women remain in our study, and it is possible that the increase seen in GDM over time may be partially attributed to changes in screening practices.3,21 We were unable to adjust for all potential factors that may have contributed to the observed trends. Importantly, the NHDS data either do not contain data on important covariates (such as parity or smoking), or they are poorly recorded (e.g. race was missing for over a fifth of delivery hospitalisations and in vitro fertilisation was poorly coded). Therefore, our results may be subject to some degree of residual confounding, but it is highly unlikely that accounting for such confounding factors would remove the otherwise powerful age and period effects that we see for GDM. Furthermore, the reporting of GDM on hospital discharge data are accurate. When validated against medical chart audit, the recording of GDM on hospital discharge records resulted in 81.3% (95% CI 69.0–93.5%) and 93.3% (95% CI 86.9–99.7%) true-positive and false-positive fractions, respectively.22
Although we used multilevel models to account for BMI in our analysis, we did not have patient-level data on pre-pregnancy BMI or pregnancy weight gain, both of which may be contributing factors to the prevalence of GDM.23–25 Furthermore, the BMI data obtained from NHANES was not stratified by race, and was missing for certain birth periods and maternal birth cohorts.
Interpretation
Age–period–cohort (APC) analyses are a versatile yet underused analysis tool that enables the decomposition of a temporal trend into age, period, and birth cohort components. This APC analysis highlights that period of birth remains a crucial factor that shapes GDM rates in the US over three decades. When shown in the context of changing screening and diagnostic criteria (Figure 1), it is evident that often the increase in rate of GDM coincides with changes to the screening and diagnostic criteria.
We also show that increasing maternal age is a strong risk factor for GDM in the US, which is consistent with trends previously reported in the literature.13,26,27 The increasing average age of a woman giving birth in the US is thought to contribute to the increased risk for GDM. Given that the APC models produced small cohort effects (especially among women born before 1950 or after 1990), relative to the impressively strong period effects with RRs increasing over time and approaching 8, factors spanning all age groups are probably contributing to this increase more than increasing maternal age at time of pregnancy. The small cohort effects at the extremes of birth cohorts may be a shortcoming of the APC model, where it may be difficult to untangle the separate cohort and maternal age effects, given the calendar years of data available.
Although the rate of GDM is increasing across time, there were several practice recommendations that may account for periods with sharper increases in the rates of GDM (highlighted with diamonds on Figure 1). The first four international workshops on GDM were held in 1980, 1984, 1990, and 1997 (there was also a fifth workshop held in 2005, but the primary focus of this workshop was on postpartum metabolic assessments). Prior to 1980, there were no recommended screening criteria for GDM. The first international workshop on GDM (1980) introduced the notion that all women should be screened between 24 and 28 weeks of gestation.10 This recommendation was maintained through the fourth workshop in 1997. The observed increase in recorded pregnancies with GDM between 1980 and 1997 may be attributed to the uptake of this recommendation to screen all women for GDM via an oral glucose tolerance test (OGTT) using the O’Sullivan and Mahan criteria for diagnosis.28 As shown in Figure 1, there is an increase in rates of GDM that starts to level off between 1990 and 1997; as the recommendation to screen all women becomes more universally implemented, the rate has stabilised over time.
At the fourth international workshop for GDM in 1997, the GDM screening criteria were modified to identify women at low, average, and high risk for GDM.29 Screening was not indicated for women at low risk, thereby decreasing the number of women screened. This, in conjunction with the 1998 decision by the World Health Organization (WHO) to deem any glucose level above normal as indicative of GDM may have contributed to the steeper increase observed between 1998 and 2010.11 The Australian Carbohydrate Intolerance Study in Pregnant Women randomised control trial concluded that the treatment of women with GDM reduced the rate of serious perinatal outcomes from 4% to 1%.30 Shortly thereafter, in 2008, the results from the HAPO blinded prospective observational study highlighted a strong and continuous association between hyperglycaemia and complications during pregnancy. This important finding from the HAPO trial provided impetus to again modify the recommended screening and diagnostic criteria at a 2010 workshop held by the International Association of Diabetes and Pregnancy and Study Group.31–33 The relatively quick uptake of new diagnostic benchmarks based on the HAPO results may explain the sharp increase in the rate of GDM diagnoses around 2008.33
The steep increase in the rate of GDM highlights the speed with which evidence-based recommendations were accepted and implemented, particularly after the results from the Hyperglycemia and Adverse Pregnancy Outcome (HAPO) blinded prospective observational study were published in 2008. The HAPO trial results indicated a continuous association with no obvious cut-offs for increasing risk between hyperglycaemia and pregnancy complications, leading to a modification in the screening and diagnostic criteria for GDM just 2 years later in 2010. Although there has been some concern regarding over-diagnosis and debate over the utility of the new criteria, as well as of the additional benefit gained from it, this analysis demonstrates that the modified screening and diagnostic criteria may have led to a decline in the rate of babies born large for gestational age, probably because of the increased detection of hyperglycaemia and consequently enhanced clinical management. Another possibility for this trend is that the increasing prevalence of conditions such as chronic hypertension, associated with advanced maternal age, may be countering the effects of GDM with regards to the rate of LGA.
The decreased prevalence of large for gestational age and macrosomic infants in the setting of increasing GDM rates supports current screening and diagnostic criteria. As more women are being diagnosed with GDM, dietary management, oral hypoglycaemic agents, and administration of insulin treatment may reduce the risk for macrosomia.34,35 Despite reductions in macrosomia, however, the increased rate of stillbirth in the setting of GDM highlights the risk involved with these pregnancies, and suggests that improving care may represent an opportunity to prevent adverse fetal outcomes. Furthermore, it is important to note that increased risk was noted even in the setting of dramatically increased uptake of electronic fetal monitoring over the study period, which is associated with decreased rates of adverse outcomes, including stillbirth and neonatal mortality.36–38
Given that obesity is a risk factor for GDM, it is important to also consider trends in BMI over the past several decades. In the US, it was estimated that as of 2011–12, the age-adjusted prevalence of obesity (BMI ≥ 30 kg/m2) among women was 36.1%.39 The trend in obesity in the US increased until the early 2000s, and has since stabilised.39–41 This corresponds to the slowing in the acceleration of the rate of GDM around 1995–2005; however, the rate of GDM is still increasing, indicating that the observed temporal increase is likely to have other contributing factors.
Conclusion
The prevalence of GDM has been increasing in the US over the past three decades. The APC analyses demonstrate impressively strong period and maternal age effects. The observed period effects are consistent with the trend towards increasing pre-pregnancy BMI. Age, period, and cohort effects show similar rates between black and white women in the prevalence rates and trends observed for GDM. Further investigation into racial disparities between white and black women, as well as the APC trends in other race categories, may be a research focus for future studies.
Supplementary Material
Figure S1. Trends in gestational diabetes mellitus in the US, by race and region, 1979–2010.
Figure S2. Age–period–cohort effect on gestational diabetes mellitus among singleton births in the US, 1979– 2010.
Table S1. (A) Gestational diabetes mellitus prevalence rates (%) among white women by maternal age, period, and maternal birth cohorts in the US, 1979–2010. (B) Gestational diabetes mellitus prevalence rates (%) among black women by maternal age, period, and maternal birth cohorts in the US, 1979–2010.
Table S2. Age–period–cohort model based on weighted Poisson regression for gestational diabetes prevalence rates in the US, 1979–2010.
Table S3. Results of the multilevel regression models for rates of gestational diabetes mellitus in the US, 1979–2010.
Acknowledgments
This study was presented as a poster at the 36th Annual Meeting for the Society for Maternal–Fetal Medicine, Atlanta, Georgia, 1–6 February 2016.
Funding
None.
Footnotes
Disclosure of interests
Full disclosure of interests available to view online as supporting information.
Contribution to authorship
CVA conceived the idea for this study. JAL managed the data, carried out all the statistical analyses, and drafted the manuscript. CVA, JAL, AMF, KMK, and JDW reviewed the analyses, and reviewed and edited the manuscript to its final form. CVA, JAL, AMF, KMK, and JDW approved the final version of the article.
Details of ethics approval
As the National Hospital Discharge Data are publically available as de-identified data, we did not seek any ethics approval from Columbia University, NY, USA.
Supporting Information
Additional Supporting Information may be found in the online version of this article:
References
- 1.International Diabetes Federation. IDF Diabetes Atlas. 6th. New York: Springer; 2014. [Google Scholar]
- 2.Getahun D, Nath C, Ananth CV, Chavez MR, Smulian JC. Gestational diabetes in the United States: temporal trends 1989 through 2004. Am J Obstet Gynecol. 2008;198:525 e1–5. doi: 10.1016/j.ajog.2007.11.017. [DOI] [PubMed] [Google Scholar]
- 3.Kim C, Ferrara A. Gestational Diabetes During and After Pregnancy. London, UK: Springer; 2010. [Google Scholar]
- 4.Bryson CL, Ioannou GN, Rulyak SJ, Critchlow C. Association between gestational diabetes and pregnancy-induced hypertension. Am J Epidemiol. 2003;158:1148–53. doi: 10.1093/aje/kwg273. [DOI] [PubMed] [Google Scholar]
- 5.Diagnosis ECot, Mellitus CoD. Report of the expert committee on the diagnosis and classification of diabetes mellitus. Diabetes Care. 2003;26(Suppl 1):S5–20. doi: 10.2337/diacare.26.2007.s5. [DOI] [PubMed] [Google Scholar]
- 6.Crane SS, Wojtowycz MA, Dye TD, Aubry RH, Artal R. Association between pre-pregnancy obesity and the risk of cesarean delivery. Obstet Gynecol. 1997;89:213–16. doi: 10.1016/S0029-7844(96)00449-8. [DOI] [PubMed] [Google Scholar]
- 7.Xiong X, Saunders LD, Wang FL, Demianczuk NN. Gestational diabetes mellitus: prevalence, risk factors, maternal and infant outcomes. Int J Gynaecol Obstet. 2001;75:221–8. doi: 10.1016/s0020-7292(01)00496-9. [DOI] [PubMed] [Google Scholar]
- 8.Sobngwi E, Boudou P, Mauvais-Jarvis F, Leblanc H, Velho G, Vexiau P, et al. Effect of a diabetic environment in utero on predisposition to type 2 diabetes. Lancet. 2003;361:1861–5. doi: 10.1016/S0140-6736(03)13505-2. [DOI] [PubMed] [Google Scholar]
- 9.Xiang AH, Wang X, Martinez MP, Walthall JC, Curry ES, Page K, et al. Association of maternal diabetes with autism in offspring. JAMA. 2015;313:1425–34. doi: 10.1001/jama.2015.2707. [DOI] [PubMed] [Google Scholar]
- 10.Freinkel NJJ. American Diabetes Association Workshop-Conference on gestational diabetes: summary and recommendations. Diabetes Care. 1980;3:499–501. [PubMed] [Google Scholar]
- 11.Alberti KG, Zimmet PZ. Definition, diagnosis and classification of diabetes mellitus and its complications. Part 1: diagnosis and classification of diabetes mellitus provisional report of a WHO consultation. Diabet Med. 1998;15:539–53. doi: 10.1002/(SICI)1096-9136(199807)15:7<539::AID-DIA668>3.0.CO;2-S. [DOI] [PubMed] [Google Scholar]
- 12.Ferrara A, Kahn HS, Quesenberry CP, Riley C, Hedderson MM. An increase in the incidence of gestational diabetes mellitus: Northern California, 1991–2000. Obstet Gynecol. 2004;103:526–33. doi: 10.1097/01.AOG.0000113623.18286.20. [DOI] [PubMed] [Google Scholar]
- 13.Dabelea D, Snell-Bergeon JK, Hartsfield CL, Bischoff KJ, Hamman RF, McDuffie RS, et al. Increasing prevalence of gestational diabetes mellitus (GDM) over time and by birth cohort: Kaiser Permanente of Colorado GDM screening program. Diabetes Care. 2005;28:579–84. doi: 10.2337/diacare.28.3.579. [DOI] [PubMed] [Google Scholar]
- 14.National Hospital Discharge Survey, National Center for Health Statistics, Centers for Disease Control Prevention. National Hospital Discharge Survey: Annual summary: US Department of Health and Human Services, Public Health Service Centers for Disease Control, National Center for Health Statistics. 1997 [Google Scholar]
- 15.Carstensen BPM, Laara E, Hills M. Epi: A package for statistical analysis in epidemiology (R package version 2.0) 2012 [ http://CRAN.R-project.org/package=Epi] (accessed 10 July 2014)
- 16.Ananth CV, Keyes KM, Wapner RJ. Pre-eclampsia rates in the United States, 1980–2010: age-period-cohort analysis. BMJ. 2013;347:f6564. doi: 10.1136/bmj.f6564. [DOI] [PMC free article] [PubMed] [Google Scholar]
- 17.Keyes KM, Ananth CV. Age, period, and cohort effects in perinatal epidemiology: implications and considerations. Paediatr Perinat Epidemiol. 2014;28:277–9. doi: 10.1111/ppe.12129. [DOI] [PMC free article] [PubMed] [Google Scholar]
- 18.National Center for Health Statistics. National Health and Nutrition Examination Survey (NHANES) Boca Raton, FL: Inter-university Consortium for Political and Social Research (ICPSR); 2012. [Google Scholar]
- 19.Yang Y, Land K. Age-Period-Cohort Analysis: New Models, Methods and Empirical Applications. 1st. Boca Raton, FL: Chapman and Hall/CRC; 2013. pp. 191–230. [Google Scholar]
- 20.Ananth CV, Vintzileos AM. Trends in cesarean delivery at preterm gestation and association with perinatal mortality. Am J Obstet Gynecol. 2011;204:505 e1–8. doi: 10.1016/j.ajog.2011.01.062. [DOI] [PubMed] [Google Scholar]
- 21.Ferrara A. Increasing prevalence of gestational diabetes mellitus: a public health perspective. Diabetes Care. 2007;30(Suppl 2):S141–6. doi: 10.2337/dc07-s206. [DOI] [PubMed] [Google Scholar]
- 22.Lydon-Rochelle MT, Holt VL, Cardenas V, Nelson JC, Easterling TR, Gardella C, et al. The reporting of pre-existing maternal medical conditions and complications of pregnancy on birth certificates and in hospital discharge data. Am J Obstet Gynecol. 2005;193:125–34. doi: 10.1016/j.ajog.2005.02.096. [DOI] [PubMed] [Google Scholar]
- 23.Torloni MR, Betran AP, Horta BL, Nakamura MU, Atallah AN, Moron AF, et al. Prepregnancy BMI and the risk of gestational diabetes: a systematic review of the literature with meta-analysis. Obes Rev. 2009;10:194–203. doi: 10.1111/j.1467-789X.2008.00541.x. [DOI] [PubMed] [Google Scholar]
- 24.Tsai IH, Chen CP, Sun FJ, Wu CH, Yeh SL. Associations of the pre-pregnancy body mass index and gestational weight gain with pregnancy outcomes in Taiwanese women. Asia Pac J Clin Nutr. 2012;21:82–7. [PubMed] [Google Scholar]
- 25.Ray JG, Vermeulen MJ, Shapiro JL, Kenshole AB. Maternal and neonatal outcomes in pregestational and gestational diabetes mellitus, and the influence of maternal obesity and weight gain: the DEPOSIT study. Diabetes Endocrine Pregnancy Outcome Study in Toronto. QJM. 2001;94:347–56. doi: 10.1093/qjmed/94.7.347. [DOI] [PubMed] [Google Scholar]
- 26.Makgoba M, Savvidou MD, Steer PJ. An analysis of the interrelationship between maternal age, body mass index and racial origin in the development of gestational diabetes mellitus. BJOG. 2012;119:276–82. doi: 10.1111/j.1471-0528.2011.03156.x. [DOI] [PubMed] [Google Scholar]
- 27.Martin JA, Hamilton BE, Sutton PD, Ventura SJ, Menacker F, Munson ML. Births: final data for 2002. Natl Vital Stat Rep. 2003;52:1–113. [PubMed] [Google Scholar]
- 28.O’Sullivan JB, Mahan CM. Criteria for the Oral Glucose Tolerance Test in Pregnancy. Diabetes. 1964;13:278–85. [PubMed] [Google Scholar]
- 29.Metzger BE, Coustan DR. Summary and recommendations of the Fourth International Workshop-Conference on Gestational Diabetes Mellitus. The Organizing Committee. Diabetes Care. 1998;21(Suppl 2):B161–7. [PubMed] [Google Scholar]
- 30.Crowther CA, Hiller JE, Moss JR, McPhee AJ, Jeffries WS, Robinson JS, et al. Effect of treatment of gestational diabetes mellitus on pregnancy outcomes. N Engl J Med. 2005;352:2477–86. doi: 10.1056/NEJMoa042973. [DOI] [PubMed] [Google Scholar]
- 31.Hapo Study Cooperative Research Group. Hyperglycemia and adverse pregnancy outcomes. N Engl J Med. 2008;358:1991–2002. doi: 10.1056/NEJMoa0707943. [DOI] [PubMed] [Google Scholar]
- 32.ACOG Committee on Practice Bulletins. ACOG Practice Bulletin. Clinical management guidelines for obstetrician-gynecologists. Number 30, September 2001 (replaces Technical Bulletin Number 200, December 1994). Gestational diabetes. Obstet Gynecol. 2001;98:525–38. [PubMed] [Google Scholar]
- 33.Metzger BE, Gabbe SG, Persson B, Buchanan TA, Catalano PA, Damm P, et al. International association of diabetes and pregnancy study groups recommendations on the diagnosis and classification of hyperglycemia in pregnancy. Diabetes Care. 2010;33:676–82. doi: 10.2337/dc09-1848. [DOI] [PMC free article] [PubMed] [Google Scholar]
- 34.Buchanan TA, Kjos SL, Montoro MN, Wu PY, Madrilejo NG, Gonzalez M, et al. Use of fetal ultrasound to select metabolic therapy for pregnancies complicated by mild gestational diabetes. Diabetes Care. 1994;17:275–83. doi: 10.2337/diacare.17.4.275. [DOI] [PubMed] [Google Scholar]
- 35.Bonomo M, Cetin I, Pisoni MP, Faden D, Mion E, Taricco E, et al. Flexible treatment of gestational diabetes modulated on ultrasound evaluation of intrauterine growth: a controlled randomized clinical trial. Diabetes Metab. 2004;30:237–44. doi: 10.1016/s1262-3636(07)70114-3. [DOI] [PubMed] [Google Scholar]
- 36.Brown R, Wijekoon JH, Fernando A, Johnstone ED, Heazell AE. Continuous objective recording of fetal heart rate and fetal movements could reliably identify fetal compromise, which could reduce stillbirth rates by facilitating timely management. Med Hypotheses. 2014;83:410–17. doi: 10.1016/j.mehy.2014.07.009. [DOI] [PubMed] [Google Scholar]
- 37.Chen HY, Chauhan SP, Ananth CV, Vintzileos AM, Abuhamad AZ. Electronic fetal heart rate monitoring and its relationship to neonatal and infant mortality in the United States. Am J Obstet Gynecol. 2011;204:491 e1–10. doi: 10.1016/j.ajog.2011.04.024. [DOI] [PubMed] [Google Scholar]
- 38.Ananth CV, Chauhan SP, Chen HY, D’Alton ME, Vintzileos AM. Electronic fetal monitoring in the United States: temporal trends and adverse perinatal outcomes. Obstet Gynecol. 2013;121:927–33. doi: 10.1097/AOG.0b013e318289510d. [DOI] [PubMed] [Google Scholar]
- 39.Ogden CL, Carroll MD, Kit BK, Flegal KM. Prevalence of childhood and adult obesity in the United States, 2011–2012. JAMA. 2014;311:806–14. doi: 10.1001/jama.2014.732. [DOI] [PMC free article] [PubMed] [Google Scholar]
- 40.Flegal KM, Carroll MD, Kuczmarski RJ, Johnson CL. Overweight and obesity in the United States: prevalence and trends, 1960–1994. Int J Obes Relat Metab Disord. 1998;22:39–47. doi: 10.1038/sj.ijo.0800541. [DOI] [PubMed] [Google Scholar]
- 41.Ogden CL, Carroll MD, Curtin LR, McDowell MA, Tabak CJ, Flegal KM. Prevalence of overweight and obesity in the United States, 1999–2004. JAMA. 2006;295:1549–55. doi: 10.1001/jama.295.13.1549. [DOI] [PubMed] [Google Scholar]
Associated Data
This section collects any data citations, data availability statements, or supplementary materials included in this article.
Supplementary Materials
Figure S1. Trends in gestational diabetes mellitus in the US, by race and region, 1979–2010.
Figure S2. Age–period–cohort effect on gestational diabetes mellitus among singleton births in the US, 1979– 2010.
Table S1. (A) Gestational diabetes mellitus prevalence rates (%) among white women by maternal age, period, and maternal birth cohorts in the US, 1979–2010. (B) Gestational diabetes mellitus prevalence rates (%) among black women by maternal age, period, and maternal birth cohorts in the US, 1979–2010.
Table S2. Age–period–cohort model based on weighted Poisson regression for gestational diabetes prevalence rates in the US, 1979–2010.
Table S3. Results of the multilevel regression models for rates of gestational diabetes mellitus in the US, 1979–2010.