Fig. 3.
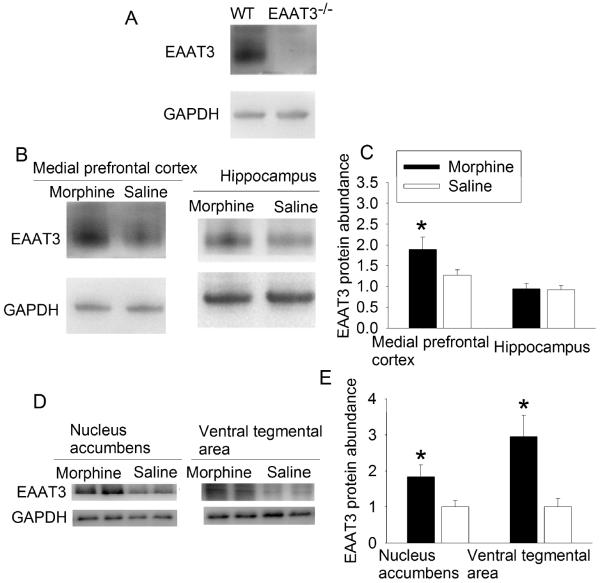
Morphine-induced increase of EAAT3 expression. A: medial prefrontal cortex was collected from wild-type (WT) and EAAT3−/− mice for Western analysis. B to E: Animals received 3 doses of 10 mg/kg morphine, each on alternative days. Brain tissues were harvested at 24 h after the last dose of morphine. Representative images of Western blots are presented in panel B and D. Quantitative results are in panel C and E (mean ± S.E.M., n = 8). * P < 0.05 compared with mice receiving saline.

