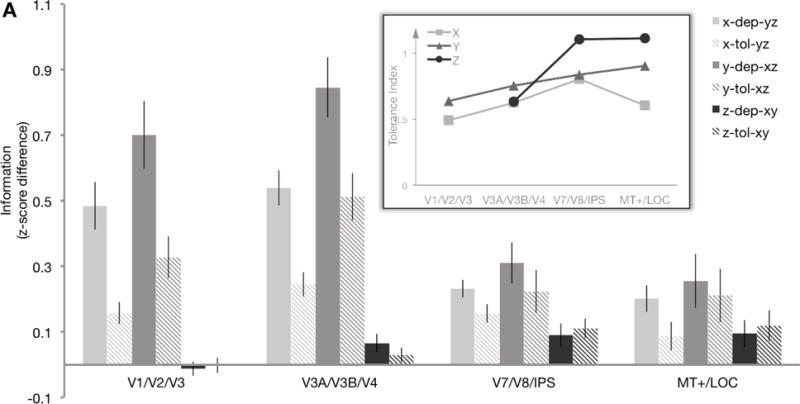
Figure 4.

A, Tolerance analysis. Average X, Y, and Z location information within each ROI group for Experiment 2 (N=12), separated into comparisons where the other two dimensions were the same (dependent information, “dep”) or different (tolerant information, “tol”). Note that each bar is a difference in correlations (as in Fig. 3), but calculated for a different subset of cells in the matrix (see Methods). The inset shows the tolerance index for X, Y, and Z location information, calculated as 1 – [ (dependent − tolerant)/(dependent + tolerant) ]. Tolerance index was only calculated when there was significant information that could be decoded (i.e., not for Z in early visual areas). A larger index (close to 1) means that the location information for the selected dimension was highly tolerant; a smaller index (close to 0) indicates the location information was highly dependent on the other dimensions. Error bars represent SEM. Data from ungrouped ROIs are shown in Figure S6.
