Abstract
Background
Measuring the thickness of the stratum corneum (SC) in vivo is often required in pharmacological, dermatological, and cosmetological studies. Reflectance confocal microscopy (RCM) offers a non-invasive imaging-based approach. However, RCM-based measurements currently rely on purely visual analysis of images, which is time-consuming and suffers from inter-user subjectivity.
Methods
We developed an unsupervised segmentation algorithm that can automatically delineate the SC layer in stacks of RCM images of human skin. We represent the unique textural appearance of SC layer using complex wavelet transform and distinguish it from deeper granular layers of skin using spectral clustering. Moreover, through localized processing in a matrix of small areas (called ‘tiles’), we obtain lateral variation of SC thickness over the entire field of view.
Results
On a set of 15 RCM stacks of normal human skin, our method estimated SC thickness with a mean error of 5.4 ± 5.1 μm compared to the ‘ground truth’ segmentation obtained from a clinical expert.
Conclusion
Our algorithm provides a non-invasive RCM imaging-based solution which is automated, rapid, objective, and repeatable.
Keywords: reflectance confocal microscopy, stratum corneum, spectral clustering, unsupervised segmentation
Measuring the thickness of stratum corneum (SC) in vivo is often required in pharmacological, dermatological, and cosmetological studies. For example, SC thickness must be measured to normalize drug permeation profiles in dermatopharmacokinetic approaches to assessing bioequivalence of topical products (1). In vivo imaging techniques such as reflectance confocal microscopy (RCM) (2), optical coherence tomography (OCT) (3–5), and Raman spectroscopy (RS) (6–9) offer a non-invasive approach for this task and are commonly used by researchers.
Optical coherence tomography-based methods (3) typically distinguish between signal intensity from cornified SC and living stratum granulosum (SG) below, to delineate the SC layer in orthogonally oriented (perpendicular to skin surface) scans. The SC shows up as a thin bright layer, whereas the underlying living epidermis is darker in appearance, which creates distinguishable contrast between two layers. However, depending on skin conditions, this contrast may be difficult to distinguish due to low signal-to-noise ratio and speckle, in many cases. Moreover, traditional OCT does not provide cellular resolution, and therefore, only relatively low spatial resolution thickness maps can be obtained. (Note, however, that newer approaches such as full field-OCT can provide cellular-level resolution and may provide higher resolution maps.)
Raman spectroscopy is more limited, as it provides only point measurements of SC thickness (6). The gradient of water vs. protein concentration ratio as a function of skin depth is used to estimate the thickness of SC. Intensity measurements of Raman bands at 3390 per cm (water) and 2935 per cm (protein) are used to calculate this ratio metric. However, collecting a set of such Raman spectras from a single point at a given depth takes around 3 s, and therefore, measuring SC thickness at more than a few locations is time-consuming. Thus, such point measurements may not always allow adequate sampling in a timely manner.
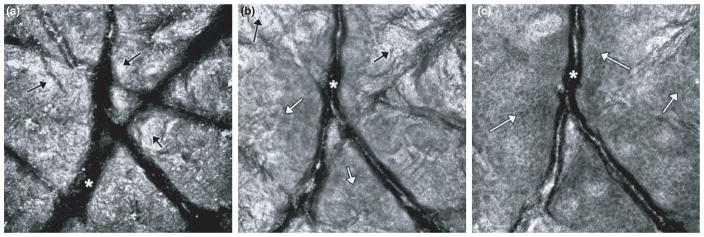
The advantage of RCM imaging is that it provides both optical sectioning and high spatial resolution. Therefore, it allows for determination of the thickness combined with the 3D cellular-level structure of the SC. However, the measurements are currently carried out in a manual fashion. Researchers typically distinguish SC from the other layers beneath it using its unique morphological, textural, and intensity properties. Two factors, one macroscopic and the other microscopic, govern this manual (i.e. purely visual) process. First, field curvature in RCM imaging can result in some images showing both SC and SG layer (Fig. 1). This happens mainly near the transition between the two layers, with the SG being seen in the center of the image, whereas SC around the edges. Second, the SC presents a microscopically uneven surface and the thickness varies with lateral location. Therefore, researchers often conduct localized visual analyses on smaller regions (typically enclosing as small as 40–50 μm in extent) in order to delineate SC thickness over the lateral field of the RCM stack.
Fig. 1.
Due to field curvature in RCM imaging, and non-uniform shape of skin, some images from adjacent layers (e.g. stratum corneum and granulosum layers) may appear in an en face section. This happens particularly at depth locations near the transition between the two layers. On the left (a), the image shows stratum corneum (exemplar areas shown by black arrows) and wrinkles (asterisk). In the center (b), the image shows a granular cell layer (exemplar regions shown using white arrows) in the center surrounded by stratum corneum (black arrows) around the edges. A honeycomb-patterned network of bright cells with dark nuclei (white arrows) is visible. On the right (c), the image shows a spinous cell layer surrounded by a bit of granular cell layer (white arrows) and we can still see corneocytes from SC layer toward lower right edge of the image. Again, a honeycomb-patterned network of bright cells with dark nuclei is seen.
With image processing and machine learning algorithms, this process may be automated and conducted in a quantitative and objective way. Machine learning-based quantitative analysis approaches for RCM images of skin are already being developed for several dermatological applications (10–15). Initial approaches have been focused on delineation of the dermal–epidermal junction, segmentation of nuclei in the epidermis, and classification of malignant vs. benign features in melanocytic lesions. In this paper, we describe an image processing and machine learning-based algorithm that can automatically measure the thickness of SC layer in RCM stacks of in vivo skin.
The overall structure of the algorithm is as follows. First, we register the RCM images collected at different depths of skin (Sec. 4.1). Then we perform low-pass filtering to reduce speckle noise (Sec. 4.2). We then automatically locate the wrinkle areas using a clustering-based segmentation approach (Sec. 4.3). Then we divide these preprocessed stacks into small regions called tiles for further localized processing, and represent the unique texture of the skin in each tile using complex wavelet transformation-based feature extraction (Sec. 5.1). Finally, we classify each tile into SC vs. rest (non-SC) classes using spectral clustering on features (Sec. 5.2). We measured the performance of this approach on a set of 15 RCM stacks of normal human skin and present the results in Sec. 6.
Data Acquisition
Data acquisition was performed using a commercial version of the reflectance confocal microscope (Vivascope 1500, Caliber I.D. (formerly Lucid), Rochester, NY, USA). The Vivascope 1500 is capable of collecting RCM images with a field of view (FOV) of 0.5 mm × 0.5 mm, with lateral resolution of 0.5 μm and optical sectioning thickness of 3 μm. The microscope images through a skin-contact window that localizes the area of interest and provides stabilization during imaging.
Three image acquisition modalities are available with this version of the microscope. The first modality is for acquiring an RCM stack, which is a collection of images captured at varying depths (with discrete steps ≥1.5 μm) in skin and centered at a given lateral location (Fig. 2). In the second modality, one can fix the depth of imaging and acquire a two dimensional matrix of non-overlapping RCM images in raster fashion. Images collected in this fashion can be concatenated or stitched together into RCM mosaics. A mosaic displays wider FOV up to 10 mm × 10 mm. One can collect mosaics at consecutive depths. Such a collection of mosaics with depth is called a ‘RCM cube’.
Fig. 2.
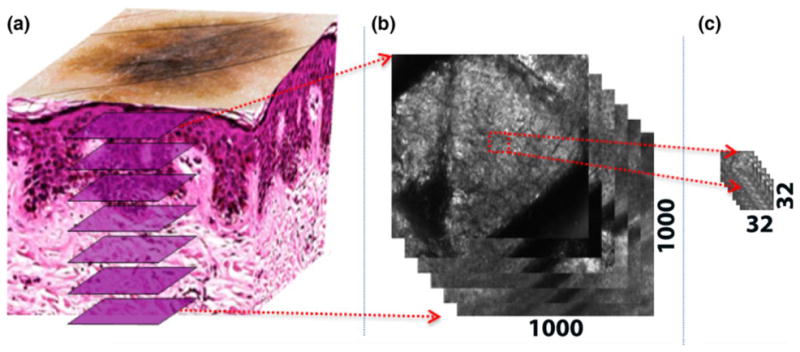
(a) RCM is capable of imaging en face optical sections of skin at depths of up to 150 μm. (b) Each RCM image captures a field of view of 0.5 mm × 0.5 mm, which, in our case, corresponds to 1000 × 1000 pixels. (c) To account for the effects of field curvature and variation of SC thickness with lateral location (as explained in the introduction), we divide each RCM image into smaller regions, called tiles (32 × 32 pixels in our case), for processing, with the content in each tile uniquely displaying either the stratum corneum or stratum granulosum.
In this study, we used 15 RCM stacks that were available, each collected with 1.5 μm depth spacing between images. The dataset contains RCM image stacks collected from the trunk, inner arms or leg of the subjects in vivo. The skin type of the subjects varied between type II (white to fair) to type IV (light brown). The data were not originally collected for this study, so number of slices varies in each stack. To standardize the data, we used only the first 30 images in each stack. All the stacks were labeled by consensus of at least two expert readers. The labeling was performed manually using an open source segmentation tool called Seg3D (16). Using the paintbrush tools provided by Seg3D, we performed manual segmentation at pixel level resolution. The RCM stacks were labeled by the experts into two groups; SC vs. rest (non-SC). This expert labeling was used as the ‘ground truth’ for testing and validation purposes.
Notation
We will use the following notation throughout the paper. A typical RCM image collected at depth z can be represented as Iz(x, y), x, y∈{1, 2, . . ., 1000}, where x, y are spatial locations of the pixels in the image. A stack, S = {Iz}z=z0,..., zn, is a set of RCM images that are collected in sequence at increasing depths. In this notation, n is a user-defined parameter that defines the number of collected images.
To mimic (as mentioned in the introduction) the currently manual (visual) process of localized analyses in small regions, we divide each RCM image into smaller, disjoint regions called tiles Tz(i, j) (Fig. 2). Each tile is independently processed in our automated method. A tile stack T(i, j) is a collection of tiles Tz(i, j) in depth direction that is defined as
where δx, δy are the dimensions of the tile.
We then represent the morphology in each tile using textural features. In SC delineation, the key structures are polygonal-shaped corneocytes, which are as dimensionally large as 10–30 μm. Therefore, we choose our tile size as 32 × 32 pixels (δx, δy ∈ [−16,16]) after downsampling the image to one-fourth of its original size (for computational ease). In this way we can capture representative textures for corneocytes.
Preprocessing of RCM Stacks
Before applying the main algorithm, we apply three preprocessing steps to the RCM stack: registration, downsampling with denoising, and wrinkle detection. In the following subsections, we will give the details of these steps one by one.
Registration
Our algorithm relies on changes in the textural patterns between RCM images of consecutive layers of skin, especially between the SC and underlying granular cell layers. As seen in Fig. 1, each layer has distinct textural appearance. We utilize this property by extracting textural features from each tile in a RCM tile stack and comparing them against each other to locate the transition depths between SC and deeper granular layers. This approach requires consecutive images in a stack to be aligned in depth direction. As subject motion often causes misalignment between consecutive images, images in the depth direction are registered before further processing. For registration, we use an ImageJ (17) plugin called StackReg (18), which utilizes the mean square difference between pixel intensities of the consecutive images.
Denoising
Due to the turbid nature of skin, RCM imaging with coherent light results in detection of randomly phased scattered light patterns originating from the structures in the illuminated voxel (point spread function). This produces speckle noise in the image. Speckle noise is a major source of variance in textural features. Increasing the pinhole size minimizes speckle noise at the expense of optical sectioning (19). The pinhole used in the Vivascope 1500 is usually 3–5 times larger than the size of the lateral resolution, resulting in reasonable averaging of speckle noise and enhancement of contrast.
We further reduce the noise, using a half-band low-pass filter. There are other available filters that have been specifically designed for reducing speckle noise (20, 21). However, these are computationally complex, slow and not particularly necessary for our needs. Half-band low-pass filtering approach for denoising is a simple and rapid operation, which does not affect the textural information crucial for SC delineation.
Wrinkle detection
The final preprocessing step is detection of wrinkles and dermatoglyphics. Wrinkles appear as dark (or even black) structureless regions (asterisks in Fig. 1). In order to detect the wrinkle areas in an RCM image, we developed an entropy filtering-based method to quantify the structure inside a region. The detection algorithm works as follows.
We calculate tile-wise Shannon entropy in each RCM image. The entropy (H) of a tile Tz(i, j) is calculated as
where p(m) is the probability of seeing a pixel with value m in the tile Tz(i, j). This probability can be estimated using the histogram of the intensity values in the corresponding tile. Tiles with highly varying intensity values have larger entropy (typically contain higher spectral frequencies) compared to tiles that contain relatively less varying intensity values (typically lower frequencies).
The topmost layers of the skin are mainly SC, which has high entropy as it is composed of highly varying intensity values, and wrinkles with low entropy. In order to distinguish between these, the tile-wise entropy values in the topmost image of the RCM stack are grouped into two clusters; wrinkle and non-wrinkle tiles. We use K-means clustering with entropy of tiles as features. As mentioned earlier, wrinkles appear as dark, structureless areas, and therefore entropy in those regions is very low. If the mean entropy of both clusters is greater than an empirically determined threshold, the algorithm determines that there is no wrinkle in the RCM stack. Otherwise, we look at the mean intensity value of each cluster (cluster center) and pick the one with lower amplitude as the wrinkle area. The mean entropy value calculated for wrinkle cluster in the first RCM image is used as a threshold to determine the wrinkle areas in the deeper en face sections. Tiles in deeper images, where entropy is smaller than or equal to this threshold value, are classified as potential wrinkle areas (wrinkle tile candidate).
After the clustering, as a post processing step, we examine the segmentation results in a top-to-bottom fashion and refine the results. Our assumption is that a wrinkle appears in the topmost RCM images and disappears as we image deeper. Therefore, starting from the second image in the RCM stack, we compare each wrinkle tile candidate against its immediate neighbor above it and check if it is a wrinkle tile. If so, the current candidate tile is finally classified as wrinkle area. We process each wrinkle tile candidate in this fashion.
Delineation Algorithm
In this section, we present the technical and scientific details of the automated SC thickness detection algorithm. The algorithm is based on two assumptions; (i) SC is present in the topmost image in RCM stacks, and (ii) SC and the SG layer below it, differ in textural appearance and contrast. The SC appears as a bright region with large polygonal-shaped corneocytes without any nuclei (Fig. 1a and b), whereas granulosum appears darker and consists of a honeycomb pattern of circular-or elliptical-shaped granulocyte cells with dark-appearing nuclei. (Fig. 1b and c). Given these observations, we use textural feature-based classification combined with intensity-based post processing, to delineate the border between SC and SG layers. The main steps of the algorithm are: feature extraction and spectral clustering-based classification followed by intensity-based refinement. Finally, we apply median filtering-based smoothing on the resulting thickness map in order to smooth the stepwise boundary produced by the tile-wise processing.
Feature extraction
For feature extraction, we use the Complex Wavelet Transform (CWT) approach. Dual-Tree Complex Wavelet Transform (DT-CWT)(22) is a method that calculates CWT stage by stage using a tree data structure. Using this tree, it is possible to decompose the input image into directional sub-bands. After a single stage of DT-CWT image decomposition, the image is decomposed into directional sub-bands with orientations in ±15, ±45 and ±75 degrees. It is almost shift-invariant, directionally selective. It introduces minimal redundancy (4:1 for images) and is computationally efficient (22). CWT has been preferred over discrete wavelet transform in several texture representation and classification problems due to such properties (23–26).
Construction of dual trees requires a filter bank. Among the several choices of wavelet filter banks, we use Kingsbury’s 6-tap filter (27) and Farras filters (28), which are two of the most commonly used filters for CWT. As DT-CWT produces output images with different sizes at each tree level due to decimation, and these sizes depend on the input image size, it is not feasible to use output images of DT-CWT directly. Instead we use statistical features of outputs of complex wavelet tree. As statistical features we use the first and the second moments (i.e. mean and variance), because they are computationally more efficient and more robust to noise than higher order moments. Using several levels of complex wavelet tree, we find that the classification accuracy does not change noticeably after three level trees. Overall, our feature vector includes mean and variance values of 18 output images (six outputs per level of a three level complex wavelet tree), resulting in a 36-element feature vector.
Spectral clustering-based border delineation and intensity distribution-based refinement
As mentioned earlier, we assume that SC and SG below it can be distinguished through textural appearance. Therefore, we base our algorithm on grouping consecutive tiles in axial (depth) direction with similar textural appearance and using the border between the groups as potential SC-SG boundary locations.
We cluster the consecutive tiles into groups with similar appearance using spectral clustering. Spectral clustering methods operate over the proximity graph of the data, which is obtained using the neighborhood relation between the samples (29). In this way, the axial neighborhood relation between tiles is preserved to some extent. In our algorithm, we implemented one of the most widely used variations (29).
We represent each tile in a tile stack using the CWT features extracted as described in section 5.1. We use the feature representation of the tiles to construct the affinity matrix, which represents the similarity between tiles in a tile stack. Affinity matrix A is a N × N square matrix defined as
| (1) |
where Azz′ is the truncated Euclidean distance between the feature representations of the tiles Tz(i, j) and Tz′(i, j) in a tile stack. In our application we empirically limited the neighborhood span Tneighbor to five tiles. Using a larger span may lead to loss of the effect of neighborhood information on the clustering, whereas smaller span will lead very small clusters, which will eventually cause over-segmentation. Then we form the Laplacian of the affinity matrix as L = D−1/2 AD1/2. In this representation, D is a diagonal matrix where Dij = ΣjAij. We then find the eigenvalues of the Laplacian matrix, and sort them into a descending sequence. We heuristically choose the number of clusters k as index of the eigenvalue that maximizes the eigengap, i.e. k = argmax(λk−1 − λk). Once k is set, we form the X matrix by stacking the corresponding k eigenvectors and normalizing them. Each row of the X matrix can be used as representation of a tile. We apply K-means clustering on this representation and form the tile groups.
After grouping the tiles in the depth direction, we find the boundary between each group. As the contrast of SC and SG differ, the first light tile-to-dark tile transition corresponds to the SC-SG boundary. We find this boundary by comparing the average brightness of neighboring groups starting from the top and determining where the brightness decreases at least 20%. Once we obtain the boundaries for each tile stack, we can create a thickness map for the whole stack by counting the number of the tiles in axial direction from the top of the RCM stack (or the last wrinkle depending on the existence of wrinkle at a particular location) to the respective SC-SG boundary level in the tile stack.
Postprocessing
The spatial resolution of the algorithm is defined by the size of the tiles used for processing. Due to tile-wise processing, the resulting SC thickness map appears coarse. We smooth it by applying median filtering in the spatial direction. Support of the median filter is twice the size of tiles so that resulting thickness map becomes smooth.
Testing and validation
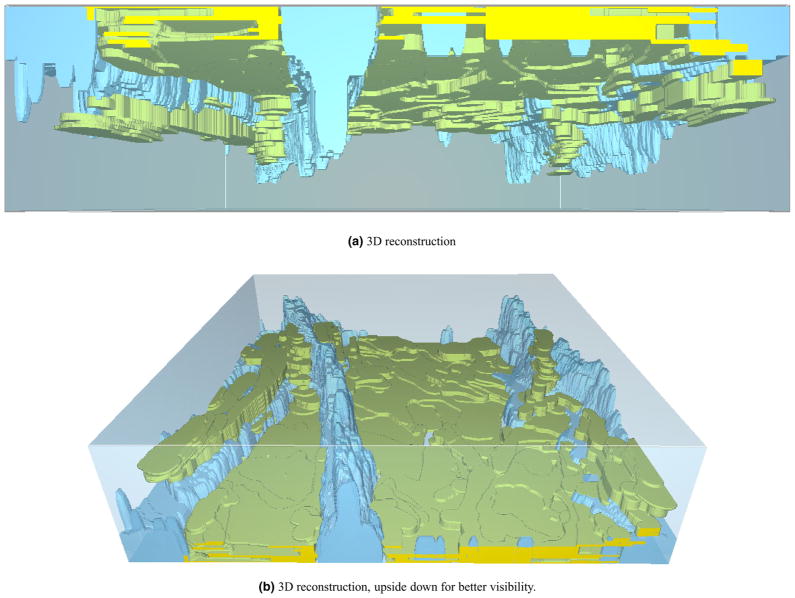
The algorithm gives a binary decision for each pixel, corresponding to SC or not-SC, which results in a 3D segmentation. Example rendering for stack 1 is presented in Fig. 3. At each lateral location, this mask can be converted into a thickness value by accumulating the binary labels in axial direction.
Fig. 3.
3D reconstruction of SC and wrinkle masks. (a) 3D reconstruction (b) 3D reconstruction, upside down for better visibility.
We compare our algorithm with ground truth using two metrics. For first metric, we divide GT mask into tiles the same way we divide the image into tiles in our algorithm, and assign SC label to a tile if there are more SC and non-SC in that tile. Then we look at number of tiles with matching labels. This gives us an estimate of the accuracy of our delineation algorithm in terms locating the SC layer in imaged 3D volume. In order not to bias the results with imbalanced labels, we crop the masks at deepest instance of SC in GT masks. For second metric, we calculate thickness maps from GT segmentation as we calculated in the algorithm, and look at error for each pixel in the maps.
Results
We tested the performance of the algorithm on 15 RCM stacks of human skin in vivo and present the experimental results in Table 1. The results show that between 79% and 92% of tiles are correctly classified. For comparison, note that Huzaira et al. manually measured epidermal keratinocyte layers at various arterial sites, reporting the average SC thickness between 8 and 14 μm (2). Across 15 stacks, we found the average thickness of SC layer to be 9.8 μm, consistent with findings in the literature.
TABLE 1.
Mean absolute error (MAE) and percentage of correctly classified tiles
| Stack | MAE (μm) | Correctly classified tiles (%) |
|---|---|---|
| 1 | 2.9 ± 3.3 | 91.7 |
| 2 | 3.6 ± 3.5 | 84.4 |
| 3 | 4.9 ± 4.9 | 87.3 |
| 4 | 5.5 ± 5.2 | 86.6 |
| 5 | 4.5 ± 4.8 | 85.3 |
| 6 | 5.4 ± 4.4 | 78.9 |
| 7 | 9.5 ± 6.4 | 62.8 |
| 8 | 5.2 ± 4.7 | 87.0 |
| 9 | 6.8 ± 4.8 | 66.6 |
| 10 | 5.2 ± 4.8 | 83.9 |
| 11 | 4.9 ± 4.9 | 87.5 |
| 12 | 5.4 ± 5.9 | 86.7 |
| 13 | 3.8 ± 4.9 | 90.0 |
| 14 | 5.6 ± 6.3 | 84.8 |
| 15 | 8.6 ± 8.3 | 79.9 |
| Average | 5.4 ± 5.1 | 82.9 |
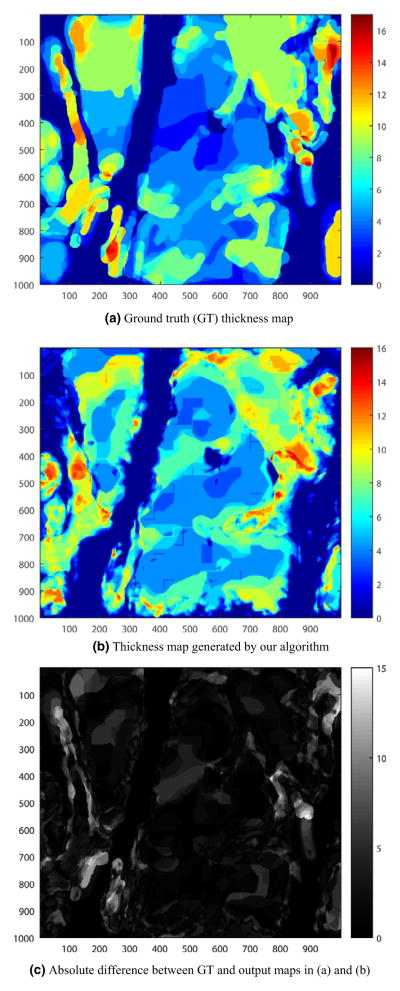
A sample 2D GT thickness map is given in Fig. 4a and the thickness map automatically generated using the algorithm is given in Fig. 4b. Using these thickness maps, we can obtain a thickness error map as shown in Fig. 4c. The absolute value of the error is gray-scale color coded in the figure, where lighter color means relatively high error and darker color means lower error where the GT and output map are in good accordance.
Fig. 4.
Results for Stack 1. (a) Ground truth (GT) thickness map, (b) Thickness map generated by our algorithm, and (c) Absolute difference between GT and output maps in (a) and (b).
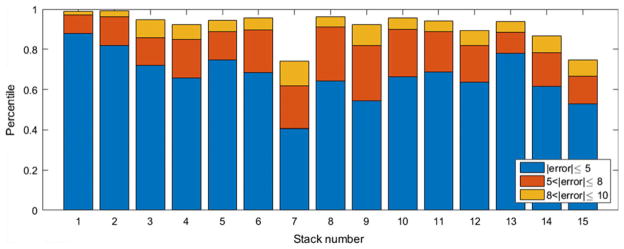
We also looked at the distribution of the error among the stacks. As the SC is located at depths of 0–15 μm from the skin surface in normal skin (30), we also looked into the percentile of the error that is between 0 and 5/8/10 μm for each stack. The results that are presented in Fig. 5 show that, on average, we locate the SC layer with ≤±5 μm precision with 66.78% probability. This probability increases to 84.77% and 91.54% as the error bound increases to ≤±8 μm and ≤±10 μm, respectively.
Fig. 5.
Stacked bar graph of percentiles corresponding to errors up to 5, 8, 10 μm.
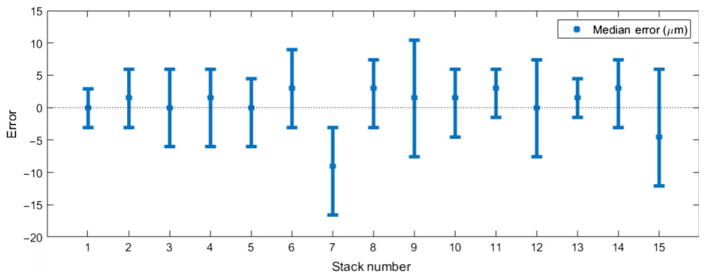
Looking at mean and standard deviation of absolute error may be misleading as distribution of absolute error resembles an exponential distribution rather than a Gaussian. Looking at median error instead of mean absolute error may provide better insight. Figure 6 shows an error plot for all stacks. The bars around each point indicate the range containing 70% of the errors. For most of the stacks, the median error is smaller than 5 μm.
Fig. 6.
Error bar graph for thickness map. Error bars correspond to ranges containing 70% of the errors.
Discussions
Reflectance confocal microscopy is an imaging technique that offers the assessment of skin conditions in a non-invasive manner. Such a technique is very useful in many settings, especially for assessment of benign in vivo skin, where biopsy followed by histology is neither ethical nor practical. Assessment of SC thickness is a good example of an application where a non-invasive imaging technique can be useful.
Through our method, one can objectively estimate SC thickness with high accuracy, precision, and repeatability. Furthermore, this method offers the combined advantages of existing techniques in literature, such as providing localized (tile-based) measurements, similar to those from RS (6–8) as well as surface topography, similar to that from OCT, and both relatively quickly and with high cellular-level resolution that is inherent to RCM imaging. Our method presents a way to rapidly obtain SC thickness maps in the examined FOV (0.5 μm × 0.5 μm in our test set) through localized tile-wise processing. Obviously, the choice of tile size is important. Selecting larger tiles may decrease the resolution for SC delineation, whereas using smaller ones may result in missing the textural and corresponding morphological information. It should also be mentioned that using smaller and/or overlapping tiles may result in increased processing time as more tiles are needed to cover the same FOV.
Similar to tile size, neighborhood size is an important parameter in the wrinkle detection step of the algorithm. This step relies on detecting the distinguishable contrast and texture of the wrinkle regions compared to other layers of skin beneath it. The choice of the tile size is a trade-off as larger tiles leads to better entropy estimation, but, on the other hand, smaller tile size leads to higher resolution in wrinkle segmentation. In our algorithm, entropy is calculated for each pixel using its 15 × 15 pixel neighborhood (corresponds to 7.5 μm × 7.5 μm), which gives a good trade-off between resolution and robust entropy measurement.
Our test set was formed by randomly choosing 15 stacks from a larger set, and it contains a large range of variability, so we can say our test set reasonably accounts for the expected variability in larger sets (see Sec. 2 for details). For example, Figs 5 and 6 show that algorithm fails at stack 7. This was an outlier, and further investigation revealed stack 7 to be a case of parakeratosis. Parakeratosis is identified by the presence of dark-appearing nuclei within bright-appearing corneocytes under RCM. Therefore, the texture seen in RCM images is very different from that normally seen in a healthy SC (30), which explains the low performance of the algorithm.
Finally, we emphasize the importance of standardizing the imaging procedure. In this study, some stacks in our set were found to display ring artifacts in the topmost images. Ring artifact is a bright ring which appears while focusing through the objective lens window due to back-reflection in the glass and field curvature in the scanning of the microscope. Currently, our algorithm handles ring artifacts in preprocessing stage via signal processing methods (namely, zero phase tophat filtering). The proper method to remove such artifacts should be to standardize the imaging procedure. A standardized procedure will also minimize variations between stacks due to imaging, such as registration, and improve consistency between results.
Acknowledgments
This work was supported by grant R01CA199673. This project was also supported in part by MSKCC’s Cancer Center support grant P30CA008748.
References
- 1.Russell LM, Guy RH. Novel imaging method to quantify stratum corneum in dermatopharmacokinetic studies: proof-of-concept with acyclovir formulations. Pharm Res. 2012;29:3362–3372. doi: 10.1007/s11095-012-0831-4. [DOI] [PubMed] [Google Scholar]
- 2.Huzaira M, Rius F, Rajadhyaksha M, Anderson RR, González S. Topographic variations in normal skin, as viewed by in vivo reflectance confocal microscopy. J Invest Dermatol. 2001;116:846–852. doi: 10.1046/j.0022-202x.2001.01337.x. [DOI] [PubMed] [Google Scholar]
- 3.Fruhstorfer H, Abel U, Garthe C-D, Knuttel A. Thickness of the stratum corneum of the volar finger-tips. Clin Anat. 2000;13:429–433. doi: 10.1002/1098-2353(2000)13:6<429::AID-CA6>3.0.CO;2-5. [DOI] [PubMed] [Google Scholar]
- 4.Crowther JM, Sieg A, Blenkiron P, Marcott C, Matts PJ, Kaczvinsky JR, Rawlings AV. Measuring the effects of topical moisturizers on changes in stratum corneum thickness, water gradients and hydration in vivo. Br J Dermatol. 2008;159:567–577. doi: 10.1111/j.1365-2133.2008.08703.x. [DOI] [PubMed] [Google Scholar]
- 5.Tsugita T, Nishijima T, Kitahara T, Takema Y. Positional differences and aging changes in Japanese woman epidermal thickness and corneous thickness determined by OCT (optical coherence tomography) Skin Res Technol. 2013;19:242–250. doi: 10.1111/srt.12021. [DOI] [PubMed] [Google Scholar]
- 6.Caspers PJ, Lucassen GW, Carter EA, Bruining HA, Puppels GJ. In vivo confocal Raman microspectroscopy of the skin: non-invasive determination of molecular concentration profiles. J Invest Dermatol. 2001;116:434–442. doi: 10.1046/j.1523-1747.2001.01258.x. [DOI] [PubMed] [Google Scholar]
- 7.Egawa M, Hirao T, Takahashi M. In vivo estimation of stratum corneum thickness from water concentration profiles obtained with Raman spectroscopy. Acta Derm Venereol. 2007;87:4–8. doi: 10.2340/00015555-0183. [DOI] [PubMed] [Google Scholar]
- 8.Böhling A, Bielfeldt S, Himmelmann A, Keskin M, Wilhelm K-P. Comparison of the stratum corneum thickness measured in vivo with confocal Raman spectroscopy and confocal reflectance microscopy. Skin Res Technol. 2014;20:50–57. doi: 10.1111/srt.12082. [DOI] [PubMed] [Google Scholar]
- 9.Hancewicz TM, Xia C, Weissman J, Foy V, Zhang S, Manoj M. A consensus modeling approach for the determination of stratum corneum thickness using in-vivo confocal Raman spectroscopy. J Cosmet Dermatol Sci Appl. 2012;2:241–251. [Google Scholar]
- 10.Kurugol S, Kose K, Park B, Dy JG, Brooks DH, Rajadhyaksha M. Automated delineation of dermal-epidermal junction in reflectance confocal microscopy image stacks of human skin. J Invest Dermatol. 2015;135:710–717. doi: 10.1038/jid.2014.379. [DOI] [PMC free article] [PubMed] [Google Scholar]
- 11.Kurugol S, Dy JG, Brooks DH, Rajadhyaksha M. Pilot study of semiautomated localization of the dermal/epidermal junction in reflectance confocal microscopy images of skin. J Biomed Optics. 2011;16:036005. doi: 10.1117/1.3549740. [DOI] [PMC free article] [PubMed] [Google Scholar]
- 12.Gareau D. Automated identification of epidermal keratinocytes in reflectance confocal microscopy. J Biomed Optics. 2011;16:030502. doi: 10.1117/1.3552639. [DOI] [PMC free article] [PubMed] [Google Scholar]
- 13.Gareau D, Hennessy R, Wan E, Pellacani G, Jacques SL. Automated detection of malignant features in confocal microscopy on superficial spreading melanoma versus nevi. J Biomed Optics. 2010;15:061713. doi: 10.1117/1.3524301. [DOI] [PMC free article] [PubMed] [Google Scholar]
- 14.Wiltgen M, Gerger A, Wagner C, Smolle J. Automatic identification of diagnostic significant regions in confocal laser scanning microscopy of melanocytic skin tumors. Methods Inf Med. 2008;47:14–25. doi: 10.3414/me0463. [DOI] [PubMed] [Google Scholar]
- 15.Koller S, Wiltgen M, Ahlgrimm-Siess V, Weger W, Hofmann-Wellenhof R, Richtig E, Smolle J, Gerger A. In vivo reflectance confocal microscopy: automated diagnostic image analysis of melanocytic skin tumours. J Eur Acad Dermatol Venereol. 2011;25:554–558. doi: 10.1111/j.1468-3083.2010.03834.x. [DOI] [PubMed] [Google Scholar]
- 16.CIBC. Seg3D: Volumetric Image Segmentation and Visualization. Scientific Computing and Imaging Institute (SCI); 2013. Available at: http://www.seg3d.org. [Google Scholar]
- 17.Abràmoff MD, Magalhães PJ, Ram SJ. Image processing with ImageJ. Biophotonics Int. 2004;11:36–42. [Google Scholar]
- 18.Thévenaz P, Ruttimann UE, Unser M. A pyramid approach to sub-pixel registration based on intensity. IEEE Trans Image Process. 1998;7:27–41. doi: 10.1109/83.650848. [DOI] [PubMed] [Google Scholar]
- 19.Glazowski C, Rajadhyaksha M. Optimal detection pinhole for lowering speckle noise while maintaining adequate optical sectioning in confocal reflectance microscopes. J Biomed Optics. 2012;17:085001. doi: 10.1117/1.JBO.17.8.085001. [DOI] [PMC free article] [PubMed] [Google Scholar]
- 20.Lee JS, Jurkevich L, Dewaele P, Wambacq P, Oosterlinck A. Speckle filtering of synthetic aperture radar images: a review. Remote Sens Rev. 1994;8:313–340. [Google Scholar]
- 21.Frost VS, Stiles JA, Shanmugam KS, Holtzman JC, Smith SA. An adaptive filter for smoothing noisy radar images. Proc IEEE. 1981;69:133–135. [Google Scholar]
- 22.Selesnick IW, Baraniuk RG, Kingsbury NC. The dual-tree complex wavelet transform. Signal Processing Magazine IEEE. 2005;22:123–151. [Google Scholar]
- 23.Hill PR, Bull DR, Canagarajah CN. Rotationally invariant texture features using the dual-tree complex wavelet transform. Image Processing, 2000. Proceedings. 2000 International Conference; IEEE; 2000. pp. 901–904. [Google Scholar]
- 24.Celik T, Tjahjadi T. Multiscale texture classification using dual-tree complex wavelet transform. Pattern Recogn Lett. 2009;30:331–339. [Google Scholar]
- 25.Hatipoglu S, Mitra SK, Kingsbury N. Texture classification using dual-tree complex wavelet transform. Image Processing and its Applications, 1999. Seventh International Conference on (Conf. Publ. No. 465); IET; 1999. pp. 344–347. [Google Scholar]
- 26.Portilla J, Simoncelli EP. A parametric texture model based on joint statistics of complex wavelet coefficients. Int J Comput Vision. 2000;40:49–70. [Google Scholar]
- 27.Kingsbury N. A dual-tree complex wavelet transform with improved orthogonality and symmetry properties. Image Processing, 2000. Proceedings. 2000 International Conference; IEEE; 2000. pp. 375–378. [Google Scholar]
- 28.Abdelnour AF, Selesnick IW. Nearly symmetric orthogonal wavelet bases. Proc. IEEE Int. Conf. Acoust., Speech, Signal Processing (ICASSP); 2001. [Google Scholar]
- 29.Ng AY, Jordan MI, Weiss Y. On spectral clustering: analysis and an algorithm. In: Dietterich TG, Becker S, Ghahramani Z, editors. Advances in neural information processing systems. Cambridge: MIT Press; 2001. pp. 849–856. [Google Scholar]
- 30.González S, Gill M, Halpern AC. Reflectance confocal microscopy of cutaneous tumors: an atlas with clinical, dermoscopic and histological correlations. 1. London: Informa Healthcare; 2008. [Google Scholar]


